Download to read offline


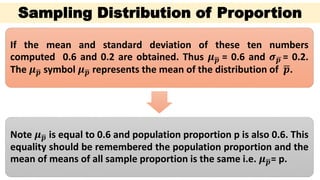


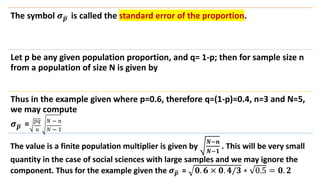
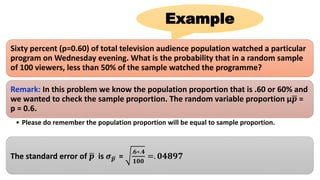
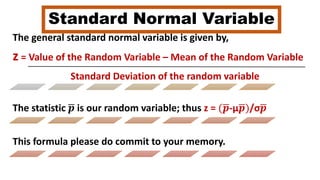
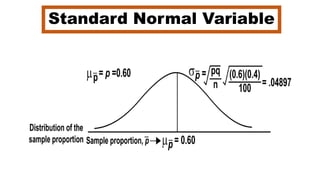
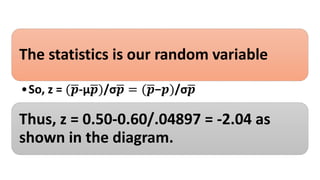
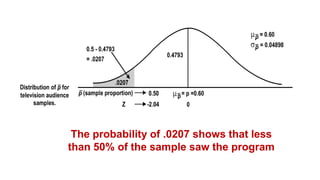

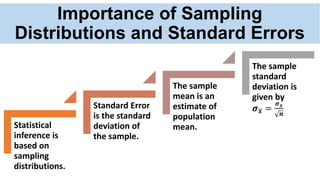


This document discusses sampling distributions and concepts related to proportions in statistics. It explains that the proportion of a characteristic in a sample (p) is a random variable whose distribution depends on the sample size (n). The mean (μp) of this sampling distribution is equal to the population proportion (p). It also defines the standard error of a proportion as the standard deviation of its sampling distribution. An example shows how to calculate the probability that a sample proportion is less than a value using the normal distribution. The key point is that sampling distributions allow inferences about populations based on sample statistics and their standard errors.


![The Crooked Timber of New India [Autosaved].pptx](https://cdn.slidesharecdn.com/ss_thumbnails/thecrookedtimberofnewindiaautosaved-240302045121-e57b6550-thumbnail.jpg?width=640&height=640&fit=bounds)


