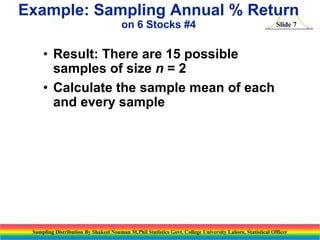
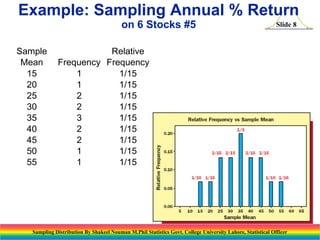
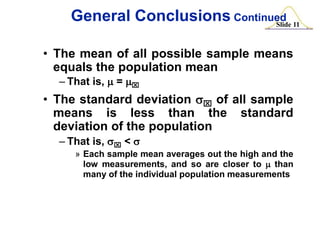
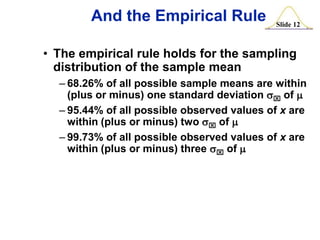
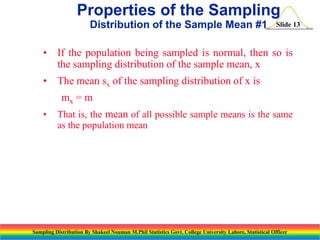
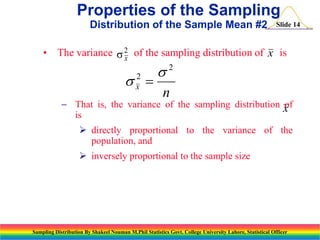
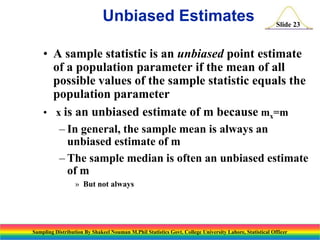
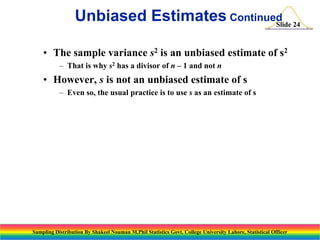
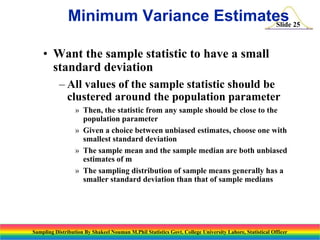
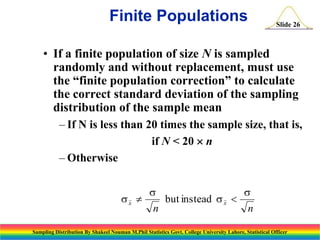
This chapter discusses sampling and sampling distributions. The key points are:
1) A sample is a subset of a population that is used to make inferences about the population. Sampling is important because it is less time consuming and costly than a census.
2) Descriptive statistics describe samples, while inferential statistics make conclusions about populations based on sample data. Sampling distributions show the distribution of all possible values of a statistic from samples of the same size.
3) The sampling distribution of the sample mean is normally distributed for large sample sizes due to the central limit theorem. Its mean is the population mean and its standard deviation decreases with increasing sample size. Acceptance intervals can be used to determine the range a
Simulation plays important role in many problems of our daily life. There has been increasing interest in the use of simulation to teach the concept of sampling distribution. In this paper we try to show the sampling distribution of some important statistic we often found in statistical methods by taking 10,000 simulations. The simulation is presented using R-programming language to help students to understand the concept of sampling distribution. This paper helps students to understand the concept of central limit theorem, law of large number and simulation of distribution of some important statistic we often encounter in statistical methods. This paper is about one sample and two sample inference. The paper shows the convergence of t-distribution to standard normal distribution. The sum of the square of deviations of items from population mean and sample mean follow chi-square distribution with different degrees of freedom. The ratio of two sample variance follow F-distribution. It is interesting that in linear regression the sampling distribution of the estimated parameters are normally distributed.
This document discusses sampling distributions and their relationship to statistical inference. It defines key terms like population, parameter, sample, and statistic. A sampling distribution describes the possible values of a statistic calculated from random samples of the same size from a population. It explains that there are population distributions, sample data distributions, and sampling distributions. The mean and spread of a sampling distribution determine if a statistic is an unbiased estimator and how variable it is. Larger sample sizes result in smaller variability in the sampling distribution.
The document defines a sampling distribution of sample means as a distribution of means from random samples of a population. The mean of sample means equals the population mean, and the standard deviation of sample means is smaller than the population standard deviation, equaling it divided by the square root of the sample size. As sample size increases, the distribution of sample means approaches a normal distribution according to the Central Limit Theorem.
This document discusses the distribution of sample means and introduces three key principles:
1) There will usually be a difference between sample statistics and the true population mean due to random selection.
2) Larger sample sizes produce more accurate estimates of the population mean.
3) Greater variability in the population variable leads to greater differences between sample statistics and the population mean.
It also discusses how the distribution of sample means approaches a normal distribution as sample size increases, and how this distribution can be used to determine probabilities regarding sample means.
Chapter 5 part1- The Sampling Distribution of a Sample Meannszakir
Mathematics, Statistics, Population Distribution vs. Sampling Distribution, The Mean and Standard Deviation of the Sample Mean, Sampling Distribution of a Sample Mean, Central Limit Theorem
This document discusses sampling distributions and their properties. It begins by describing the distribution of the sample mean for both normal and non-normal populations. As sample size increases, the distribution of the sample mean approaches a normal distribution regardless of the population distribution. The document then discusses the sampling distribution of the sample proportion. For large samples, this distribution is approximately normal with mean equal to the population proportion and standard deviation inversely related to sample size. Examples are provided to illustrate computing sample proportions and probabilities involving sampling distributions.
This document provides an overview of sampling and sampling distributions. It discusses how random samples are used to make statistical inferences about populations. The key points covered include:
- Sampling is the process of selecting a portion of a population to estimate characteristics of the whole population.
- There are two main types of sampling: probability sampling and non-probability sampling.
- The distribution of sample statistics (like the sample mean) is called the sampling distribution.
- According to the central limit theorem, the sampling distribution of the mean will follow a normal distribution, even if the population is not normally distributed, as long as the sample size is sufficiently large.
- The standard error of the sampling distribution of the
This document discusses statistical concepts related to sampling and making inferences about populations based on samples. It covers simple random sampling, point estimation, sampling distributions, and provides an example using data from St. Andrew's University applicants. Specifically, it looks at taking a census versus sampling to estimate the average SAT score and proportion wanting on-campus housing. It demonstrates how to select a simple random sample using a random number table and computer-generated random numbers in Excel. Point estimates and their sampling distributions are defined.
This document discusses sampling distribution about sample mean. It defines key terms like population, sample, sampling units, stratified random sampling, systematic sampling, cluster sampling, probability sampling, non-probability sampling, estimation, estimator, estimate, and sampling distribution. It also discusses the sampling distribution of the sample mean and provides an example to calculate and compare the mean and variance of sample means for sampling with and without replacement.
This document discusses sampling and sampling distributions. It begins by explaining why sampling is preferable to a census in terms of time, cost and practicality. It then defines the sampling frame as the listing of items that make up the population. Different types of samples are described, including probability and non-probability samples. Probability samples include simple random, systematic, stratified, and cluster samples. Key aspects of each type are defined. The document also discusses sampling distributions and how the distribution of sample statistics such as means and proportions can be approximated as normal even if the population is not normal, due to the central limit theorem. It provides examples of how to calculate probabilities and intervals for sampling distributions.
Sampling and sampling distribution ttttpardeepkaur60
This document discusses sampling and sampling distributions. It defines sampling as selecting a subset of a population for study. Random sampling gives each member of the population an equal chance of being selected, while non-random sampling uses other factors like convenience. The document outlines the steps in sampling design and describes different random and non-random sampling methods. It also distinguishes between sampling errors and non-sampling errors and discusses the concept of sampling distributions and how they allow inferences to be made about population parameters from sample statistics.
This document provides an overview of sampling distributions and sampling error. It aims to explain the concepts of the sampling distribution of the mean and proportion. Key points include:
- Sampling distributions describe the distribution of sample statistics from repeated samples of a population.
- Sampling error is the difference between a sample statistic and the population parameter. It depends on the sample size and decreases with larger samples.
- The sampling distribution of the mean for samples of size n from a normal population is a normal distribution with mean equal to the population mean and standard deviation equal to the population standard deviation divided by the square root of the sample size.
- For sample sizes greater than 30, the Central Limit Theorem states the sampling
Sampling distributions stat ppt @ bec domsBabasab Patil
The document discusses sampling distributions and their properties. It defines sampling error and how to calculate it. It explains that the sampling distribution of the sample mean x is normally distributed with mean equal to the population mean and standard deviation equal to the population standard deviation divided by the square root of the sample size. Similarly, the sampling distribution of the sample proportion p is normally distributed when the sample size is large. The Central Limit Theorem states that the sampling distribution will be approximately normal for large sample sizes regardless of the population distribution.
This document discusses sampling distributions and their properties. It provides steps to construct a sampling distribution of sample means from a population. Specifically, it shows how to determine the number of possible samples, calculate the mean of each sample, and compile these into a frequency distribution. The sampling distribution's mean equals the population mean, while its variance is the population variance divided by the sample size. Examples demonstrate calculating the mean and variance of sampling distributions for different sample sizes. Key properties of sampling distributions are summarized.
Chapter 5 part2- Sampling Distributions for Counts and Proportions (Binomial ...nszakir
Mathematics, Statistics, Sampling Distributions for Counts and Proportions, Binomial Distributions for Sample Counts,
Binomial Distributions in Statistical Sampling, Binomial Mean and Standard Deviation, Sample Proportions, Normal Approximation for Counts and Proportions, Binomial Formula
This chapter discusses sampling and sampling distributions. It defines key terms like population, parameter, sample, and statistic. It also differentiates between a population and a sample. The chapter covers different sampling methods like simple random sampling, stratified random sampling, and cluster sampling. It describes the properties of the sampling distribution of the sample mean, including its expected value and standard deviation. The chapter also explains the central limit theorem.
The document discusses sampling and sampling distributions for estimation. It notes that sampling is used when the population is too large to observe entirely, like India's population of TV viewers. Random sampling of 10,000 TV sets is used to determine viewing preferences. The chapter examines questions around sample size, selection methods, and knowing when a sample accurately reflects the population. Simple random sampling, systematic sampling, stratified sampling and cluster sampling are probability sampling methods discussed. The central limit theorem states that as sample size increases, the sampling distribution of means approaches a normal distribution.
Sampling is the process of selecting a subset of observations from within a larger population to estimate characteristics of the entire population. There are two main types of sampling: probability sampling, where units have a known, non-zero chance of being selected; and non-probability sampling, where units are selected in a non-random fashion. Some common probability sampling techniques include simple random sampling, stratified random sampling, cluster sampling and systematic sampling. Common non-probability techniques include convenience sampling and purposive sampling. The key advantages of sampling are that it saves time, money and effort while still providing reasonably accurate estimates of the entire population.
1) This document discusses sampling and sampling distributions, including key terms like population, sample, parameter, statistic, and point estimation.
2) It describes simple random sampling for both finite and infinite populations and introduces the concept of sampling distributions - the probability distributions of sample statistics.
3) The sampling distribution of the mean is discussed, including how it approaches a normal distribution as sample size increases due to the central limit theorem.
- Sampling distribution describes the distribution of sample statistics like means or proportions drawn from a population. It allows making statistical inferences about the population.
- The central limit theorem states that sampling distributions of sample means will be approximately normally distributed regardless of the population distribution, if the sample size is large.
- Standard error measures the amount of variability in values of a sample statistic across different samples. It is used to construct confidence intervals for population parameters.
Applied Statistics : Sampling method & central limit theoremwahidsajol
This document discusses sampling methods and the central limit theorem. It provides details on types of probability sampling including simple random sampling, systematic sampling, stratified sampling, and cluster sampling. Simple random sampling involves randomly selecting items from a population so that each item has an equal chance of selection. Systematic sampling selects every kth item from a population. Stratified sampling divides a population into subgroups and then randomly samples from each subgroup. Cluster sampling divides a population into geographical clusters and randomly samples from each cluster. The document also explains that the central limit theorem states that the sampling distribution of sample means will approximate a normal distribution as sample size increases.
Please Subscribe to this Channel for more solutions and lectures
http://www.youtube.com/onlineteaching
Elementary Statistics Practice Test 1
Module 1: Chapters 1-3
Chapter 1: Introduction to Statistics.
Chapter 2: Exploring Data with Tables and Graphs.
Chapter 3: Describing, Exploring, and Comparing Data.
This document provides information about sampling methods that will be used in a study being conducted in the Cordillera Administrative Region of the Philippines. It describes the population as the provinces in this region. The sample will include one province from each of three income classifications (second class, third class, fourth class) plus the city of Baguio, to represent the diversity of the region. Formulas for determining sample size are provided for both probability and non-probability sampling.
FellowBuddy.com is an innovative platform that brings students together to share notes, exam papers, study guides, project reports and presentation for upcoming exams.
We connect Students who have an understanding of course material with Students who need help.
Benefits:-
# Students can catch up on notes they missed because of an absence.
# Underachievers can find peer developed notes that break down lecture and study material in a way that they can understand
# Students can earn better grades, save time and study effectively
Our Vision & Mission – Simplifying Students Life
Our Belief – “The great breakthrough in your life comes when you realize it, that you can learn anything you need to learn; to accomplish any goal that you have set for yourself. This means there are no limits on what you can be, have or do.”
Like Us - https://www.facebook.com/FellowBuddycom
This document provides an introduction to key concepts in statistics including sampling, data, and measurement. It discusses descriptive and inferential statistics, probability, populations and samples, parameters and statistics, variables and data types. Specific sampling methods like simple random sampling, stratified sampling, and cluster sampling are explained. The document also covers qualitative and quantitative data, graphs to represent qualitative data, sources of error in sampling, and the importance of critical evaluation of statistical studies.
This document discusses key concepts in sampling and statistical inference. It defines parameters and statistics, and explains sampling distributions including the sampling distribution of the mean, proportion, and difference between means. The central limit theorem is covered, stating that as sample size increases, the sampling distribution of the mean approaches a normal distribution. Common distributions used in statistical inference like the t, F, and chi-square distributions are also summarized.
The document discusses sampling distributions and summarizes key points about the sampling distribution of the mean for both known and unknown population variance. It states that the sampling distribution of the mean has a normal distribution with mean equal to the population mean and variance equal to the population variance divided by the sample size when the population variance is known. When the population variance is unknown, the sampling distribution follows a t-distribution if the population is normally distributed.
This document provides information on population and sampling concepts. It defines key terms like population, sample, parameter, statistic and discusses different sampling methods like random sampling (simple random sampling, stratified sampling, systematic sampling) and non-random sampling (judgment sampling, quota sampling, convenience sampling).
It also discusses the theory of estimation including point estimation and interval estimation. Qualities of a good estimator like unbiasedness, consistency and efficiency are explained. Hypothesis testing procedures including setting null and alternative hypotheses, test statistics, decision rules and types of errors are outlined. Common statistical tests like the z-test and its applications are described.
This document discusses research methodology and sampling techniques. It defines key terms like population, sample, census, and probability and non-probability sampling. It describes different sampling methods like simple random sampling, systematic sampling, stratified sampling, cluster sampling, and their advantages and disadvantages. Finally, it discusses issues around internet sampling and methods like using web site visitors, panels, and opt-in lists.
The document discusses key concepts in sampling, including:
- The target population is the group to which results will be generalized.
- Sampling units are the smallest elements that can be selected from the sampling frame.
- The sampling frame is the list from which potential respondents are drawn.
- Probability sampling methods like simple random sampling, stratified sampling, and cluster sampling aim to select a representative sample and allow estimates of sampling error. Non-probability methods do not involve random selection.
The document provides an introduction to the gamma function Γ(x). Some key points:
1) The gamma function was introduced by Euler to generalize the factorial to non-integer values. It is defined by definite integrals and satisfies the functional equation Γ(x+1)=xΓ(x).
2) The gamma function can be defined for both positive and negative real values, except for negative integers where it has simple poles. It is related to important constants like Euler's constant.
3) The gamma function satisfies important formulas like the duplication formula, multiplication formula, and complement/reflection formula. Stirling's formula approximates the gamma function for large integer values.
Unit 3 random number generation, random-variate generationraksharao
This document discusses random number generation and random variate generation. It covers:
1) Properties of random numbers such as uniformity, independence, maximum density, and maximum period.
2) Techniques for generating pseudo-random numbers such as the linear congruential method and combined linear congruential generators.
3) Tests for random numbers including Kolmogorov-Smirnov, chi-square, and autocorrelation tests.
4) Random variate generation techniques like the inverse transform method, acceptance-rejection technique, and special properties for distributions like normal, lognormal, and Erlang.
The document defines correlation and regression, and describes how to calculate them. Correlation measures the strength and direction of a linear relationship between two random variables on a scale from -1 to 1. Regression finds the linear relationship between a random variable and a fixed variable to make predictions. The document provides examples of calculating correlation using Pearson's r and determining the regression line and equation from sample data.
The document discusses the Newton-Raphson method, an iterative method for finding approximations of the zeros of a real-valued function. It begins by explaining how the ancient Babylonians approximated square roots through iterative averaging. Then it describes how Newton and Raphson generalized this method to any function by using the tangent line approximation at each step. Finally, it provides examples of using the Newton-Raphson method to find approximations of the square root of 2 and the solution to an example equation to 10 decimal places within 5 iterations, demonstrating the method's effectiveness.
1) Newton Raphson method is a numerical technique used to find roots of algebraic and transcendental equations. It uses successive approximations, starting from an initial guess, to find better approximations for the roots of the equations.
2) The method involves calculating the derivative of the function f(x) and determining the next approximation using the formula xn+1 = xn - f(xn)/f'(xn).
3) An example of finding the root of x3 - 2x - 5 = 0 is shown, starting from an initial guess of 2.5 and iteratively applying the Newton Raphson formula to obtain the root as 2.094551482.
Sampling Design and Sampling DistributionVikas Sonwane
This document discusses various sampling methods and concepts. It defines key terms like target population, sampling unit, and sampling frame. It then describes different probability sampling techniques like simple random sampling, systematic sampling, and stratified sampling. It also covers non-probability sampling techniques like convenience sampling and judgment sampling. The document emphasizes selecting the most appropriate sampling design based on factors like accuracy needed, available resources, and knowledge of the population. It concludes with discussing internet sampling methods like using web site visitors, established panels, and opt-in lists.
The Newton-Raphson method is an iterative method used to find approximations of the roots, or zeros, of a real-valued function. It uses the function's derivative to improve its guess for the root during each iteration. The method starts with an initial guess and iteratively computes better approximations until the root is found within a specified tolerance. The algorithm involves calculating the slope of the tangent line to the function at each guess and using the x-intercept of this line as the next guess. The process repeats until convergence within the tolerance is reached. The method is efficient and fast compared to other root-finding algorithms.
It is most useful for the students of BBA for the subject of "Data Analysis and Modeling"/
It has covered the content of chapter- Data regression Model
Visit for more on www.ramkumarshah.com.np/
The document describes the Newton-Raphson method for finding the roots of nonlinear equations. It provides the derivation of the method, outlines the algorithm as a 3-step process, and gives an example of applying it to find the depth a floating ball submerges in water. The advantages are that it converges fast if it converges and requires only one initial guess. Drawbacks include potential issues with division by zero, root jumping, and oscillations near local extrema.
The moment distribution method can be used to analyze statically indeterminate beams and frames. It involves solving the linear equations obtained in the slope-deflection method through successive approximations. The key aspects of the method are:
1. Stiffness factor is defined as the moment required to produce a unit rotation at a point, and is used to relate moments and rotations.
2. Carry-over factor is the ratio of the moment induced at the far end of a propped cantilever to the moment applied at the near end.
3. Distribution factor is the ratio of a member's stiffness factor to the sum of stiffnesses of members meeting at a joint, and is used to distribute an
This document discusses point and interval estimation. It defines an estimator as a function used to infer an unknown population parameter based on sample data. Point estimation provides a single value, while interval estimation provides a range of values with a certain confidence level, such as 95%. Common point estimators include the sample mean and proportion. Interval estimators account for variability in samples and provide more information than point estimators. The document provides examples of how to construct confidence intervals using point estimates, confidence levels, and standard errors or deviations.
This document discusses different types of validity in testing:
1. Content validity refers to how well a test measures the specific construct it aims to assess. A test needs to be related to the relevant class content.
2. Criterion-related validity is the degree of agreement between a test and an independent, reliable standard. There are two types: concurrent and predictive validity.
3. Construct validity provides evidence that test items measure the intended underlying abilities. Think-aloud and retrospection methods can provide evidence of construct validity.
Validity in scoring and face validity are also discussed. To improve validity, test specifications and a representative sample of content should be used, and scoring should directly relate to what
Linear regression and correlation analysis ppt @ bec domsBabasab Patil
This document introduces linear regression and correlation analysis. It discusses calculating and interpreting the correlation coefficient and linear regression equation to determine the relationship between two variables. It covers scatter plots, the assumptions of regression analysis, and using regression to predict and describe relationships in data. Key terms introduced include the correlation coefficient, linear regression model, explained and unexplained variation, and the coefficient of determination.
Estimation is the process of calculating the approximate costs of an engineering project before work begins. It requires thorough knowledge of construction procedures, material and labor costs, and skills like experience, judgment, and foresight. There are two main types of estimates - rough cost estimates and detailed estimates. A rough cost estimate provides an initial approximate cost based on unit costs from similar past projects. It is used to assess the feasibility of a project and obtain initial approval. A detailed estimate provides a more accurate expected cost based on detailed plans and specifications by calculating the quantities of materials and hours of labor.
This document discusses finding the mean and variance of the sampling distribution of means. It provides examples of computing the mean and variance of the sampling distribution when random samples are drawn from a population. It also explains the Central Limit Theorem - that as the sample size increases, the sampling distribution of the mean approaches a normal distribution, regardless of the population distribution. Exercises are provided to practice calculating the mean and variance of sampling distributions based on population parameters and sample sizes.
This document discusses the distribution of sample means and the central limit theorem. It begins by explaining how sampling distributions allow us to consider probabilities for groups of scores rather than single scores. It then discusses how the distribution of all possible sample means from a population follows a predictable pattern. Specifically, the central limit theorem states that the distribution of sample means will be normally distributed with a mean equal to the population mean and a standard deviation related to the sample size. This allows probabilities and z-scores to be calculated for sample means. The document provides examples to illustrate these concepts.
This document presents a lecture on sampling methods given by Shakeel Nouman. It discusses various probability and non-probability sampling techniques including stratified random sampling, cluster sampling, systematic sampling, and dealing with nonresponse. Specific topics covered include defining populations and frames, estimating means and proportions for stratified and cluster samples, and calculating confidence intervals. Worked examples are provided to demonstrate how to estimate sample sizes, means, variances and confidence intervals for stratified sampling. Optimum allocation methods for stratified samples are also described.
We know that frequency distributions serve useful purposes but there are many situations that require other type of data summarizations. What we need in many instances is the ability to summarize the data by means of a single number called a descriptive measure. Descriptive measures may be computed from the data of a sample or the data of a population.
1) The document discusses different statistical tests including z-tests, t-tests, and F-tests/ANOVAs that are used to make inferences about populations based on experimental sample data. It provides examples of how each test is used including formulas and worked examples.
2) Statistical tests in SPM, like t-tests and F-tests, are used to test specific hypotheses about differences between conditions in a brain imaging experiment by creating linear combinations of regressors in the design matrix called contrasts.
3) The document emphasizes that statistical tests allow researchers to test the probability that sample data come from a hypothesized population distribution in order to make inferences about whether experimental manipulations have significant effects.
concept of sample and sampling, sampling process and problems, types of samples: probability and non probability sampling, determination and sample size, sampling and non sampling errors
This document discusses sampling techniques and concepts in statistics. It begins by outlining learning objectives related to sampling, errors, and statistical analysis. It then discusses reasons for sampling such as saving money and time compared to a census. The document contrasts random and non-random sampling methods. It provides examples of random sampling techniques including simple random sampling, systematic random sampling, stratified random sampling, and cluster sampling. It also discusses non-random convenience sampling and sources of non-sampling errors. Finally, it introduces the concepts of sampling distributions and the central limit theorem, and provides examples of using normal approximations.
The document discusses sampling and provides definitions and examples. It defines sampling as selecting a sample from a target population to generalize results. It lists types of sampling such as probability and non-probability sampling. Probability sampling uses random selection so all units have an equal chance of being selected, while non-probability sampling does not use random selection. Formulas for sampling with and without replacement are provided. The benefits of sampling over studying the entire population are given as lower cost, more accuracy, and faster data collection.
This document provides an introduction to statistical inference. It discusses populations versus samples, and the two main types of statistical inference procedures - estimating population parameters and hypothesis testing. The key concepts covered include sampling distributions, the central limit theorem, standard error, and confidence intervals. Hypothesis testing is introduced as a procedure to compare sample results to a known or hypothesized population parameter. Examples are provided to illustrate concepts such as sampling distributions, the central limit theorem, and how to calculate confidence intervals.
1. The sampling distribution of a statistic is the distribution of all possible values that statistic can take when calculating it from samples of the same size randomly drawn from a population. The sampling distribution will have the same mean as the population but lower variance equal to the population variance divided by the sample size.
2. For a sample mean, the sampling distribution will be approximately normal according to the central limit theorem. A 95% confidence interval for the population mean can be constructed as the sample mean plus or minus 1.96 times the standard error of the mean.
3. For a sample proportion, the sampling distribution will also be approximately normal. A 95% confidence interval can be constructed as the sample proportion plus or minus 1
This document provides an overview of Module 5 on sampling distributions. It discusses key concepts like parameters vs statistics, sampling variability, and sampling distributions. It explains that the sampling distribution of a sample mean is a normal distribution with a mean equal to the population mean and standard deviation equal to the population standard deviation divided by the square root of the sample size. The central limit theorem states that as the sample size increases, the distribution of sample means will approach a normal distribution regardless of the shape of the population distribution. The module also covers binomial distributions for sample counts and proportions.
This document discusses sampling and sampling distributions. It begins by defining key concepts related to sampling such as population, sample, parameter, and statistic. It then explains the difference between probability and non-probability sampling methods. The rest of the document focuses on describing sampling distributions, particularly the sampling distribution of the sample mean. It explains how to determine the expected value and standard deviation of this distribution and compares it to the original population distribution. The document also discusses how the central limit theorem allows us to assume the sampling distribution of the mean will be approximately normal even if the population is not.
Chp11 - Research Methods for Business By Authors Uma Sekaran and Roger BougieHassan Usman
This document discusses sampling and sampling distributions. It defines key concepts like population, sample, probability distributions, sampling distributions, and the central limit theorem. It explains that as sample size increases, the sampling distribution approximates a normal distribution according to the central limit theorem. It also discusses different types of sampling methods like simple random sampling, systematic random sampling, and stratified random sampling.
This document provides an overview of descriptive statistics concepts including measures of central tendency (mean, median, mode), measures of variability (range, standard deviation, variance), and how to compute them from both ungrouped and grouped data. It defines key terms like mean, median, mode, percentiles, quartiles, range, standard deviation, variance, and coefficient of variation. It also discusses how standard deviation can be used to measure financial risk and the empirical rule and Chebyshev's theorem for interpreting standard deviation.
This document discusses sampling distributions and related statistical concepts. It defines descriptive and inferential statistics, and explains that inferential statistics uses samples to draw conclusions about populations. Key concepts covered include sampling, probability distributions, sampling distributions, and the central limit theorem. The sampling distribution of the sample mean is examined in depth. For a sample mean, the expected value is equal to the population mean, while the standard error depends on factors like the population standard deviation and sample size. Examples are provided to illustrate these statistical properties.
The document discusses different sampling methods used in statistics. It describes two main types of sampling - probability sampling and non-probability sampling. Probability sampling techniques ensure each member of the population has an equal chance of being selected, such as simple random sampling, cluster sampling, systematic sampling, and stratified random sampling. Non-probability sampling does not use random selection and includes convenience sampling, quota sampling, and snowball sampling. The document also covers sampling distribution, sampling distribution of mean and proportion, and T-distribution. It defines sampling error and lists different types of sampling errors.
This document provides an overview of key concepts regarding the distribution of sample means. It discusses how the distribution of sample means approaches a normal shape as sample size increases based on the central limit theorem. The mean of this distribution is equal to the population mean, making the sample mean an unbiased statistic. The variability of the distribution is measured by the standard error, which decreases as sample size increases. The document shows how to calculate a z-score for a sample mean based on the standard error in order to determine the probability of obtaining a sample with a given mean. It previews how these concepts will be applied in inferential statistics.
This document presents an overview of statistical techniques for comparing two populations. It discusses paired sample comparisons using a t-test and independent sample comparisons using a z-test. Examples are provided to demonstrate hypothesis testing to examine differences in population means and proportions. Specific topics covered include: paired t-tests, independent z-tests, testing situations for comparing two means, test statistics and examples comparing credit card charges and battery life. Templates are shown for conducting the tests in several examples.
This document contains slides from a presentation on simple linear regression and correlation. It introduces simple linear regression modeling, including estimating the regression line using the method of least squares. It discusses the assumptions of the simple linear regression model and defines key terms like the regression coefficients (intercept and slope), error variance, standard errors of the estimates, and how to perform hypothesis tests and construct confidence intervals for the regression parameters. Examples are provided to demonstrate calculating quantities like sums of squares, estimating the regression line, and evaluating the fit of the regression model.
This document presents an overview of statistical methods for comparing two populations. It discusses paired sample comparisons and independent sample comparisons. For paired samples, it covers the paired t-test and constructing confidence intervals. For independent samples, it explains how to test whether population means are equal using a z-test or t-test. Several examples are provided to demonstrate these techniques. The document also briefly discusses testing differences in population proportions and variances.
The document discusses quality control techniques using statistics. It introduces various control charts used to monitor processes, including X-bar, R, s, p, and c charts. Control charts plot statistics over time and use control limits to identify when processes may be out of control. The document provides examples demonstrating how to construct and interpret these charts.
Nonparametric methods and chi square tests (1)Shakeel Nouman
This document discusses nonparametric statistical methods and chi-square tests. It introduces several nonparametric tests that do not rely on assumptions about the population distribution, including the sign test for paired comparisons, the runs test for detecting randomness, and ranks tests like the Mann-Whitney U test for comparing two populations and the Wilcoxon signed-rank test for paired comparisons. It also discusses the Kruskal-Wallis and Friedman tests for comparing multiple populations and chi-square tests for goodness of fit, independence, and equality of proportions. Examples are provided to demonstrate how to perform and interpret these various nonparametric tests.
This document provides an overview of multiple regression analysis. It discusses (1) the multiple regression model and how it generalizes linear regression to multiple predictors, (2) estimating the regression coefficients using the method of least squares, and (3) methods for evaluating the fit of the regression model, including analysis of variance tables, goodness-of-fit measures, and testing the significance of individual predictors. Examples are provided to illustrate key concepts.
The document discusses the normal distribution and its key properties. It introduces the normal probability density function and how it is characterized by a mean and variance. Some key properties covered are that the sum of independent normally distributed variables is also normally distributed, with the mean being the sum of the individual means and the variance being the sum of the individual variances. It also discusses how to compute probabilities and find values for the standard normal distribution.
Main Java[All of the Base Concepts}.docxadhitya5119
This is part 1 of my Java Learning Journey. This Contains Custom methods, classes, constructors, packages, multithreading , try- catch block, finally block and more.
How to Fix the Import Error in the Odoo 17Celine George
An import error occurs when a program fails to import a module or library, disrupting its execution. In languages like Python, this issue arises when the specified module cannot be found or accessed, hindering the program's functionality. Resolving import errors is crucial for maintaining smooth software operation and uninterrupted development processes.
A review of the growth of the Israel Genealogy Research Association Database Collection for the last 12 months. Our collection is now passed the 3 million mark and still growing. See which archives have contributed the most. See the different types of records we have, and which years have had records added. You can also see what we have for the future.
A workshop hosted by the South African Journal of Science aimed at postgraduate students and early career researchers with little or no experience in writing and publishing journal articles.
This slide is special for master students (MIBS & MIFB) in UUM. Also useful for readers who are interested in the topic of contemporary Islamic banking.
Walmart Business+ and Spark Good for Nonprofits.pdfTechSoup
"Learn about all the ways Walmart supports nonprofit organizations.
You will hear from Liz Willett, the Head of Nonprofits, and hear about what Walmart is doing to help nonprofits, including Walmart Business and Spark Good. Walmart Business+ is a new offer for nonprofits that offers discounts and also streamlines nonprofits order and expense tracking, saving time and money.
The webinar may also give some examples on how nonprofits can best leverage Walmart Business+.
The event will cover the following::
Walmart Business + (https://business.walmart.com/plus) is a new shopping experience for nonprofits, schools, and local business customers that connects an exclusive online shopping experience to stores. Benefits include free delivery and shipping, a 'Spend Analytics” feature, special discounts, deals and tax-exempt shopping.
Special TechSoup offer for a free 180 days membership, and up to $150 in discounts on eligible orders.
Spark Good (walmart.com/sparkgood) is a charitable platform that enables nonprofits to receive donations directly from customers and associates.
Answers about how you can do more with Walmart!"
हिंदी वर्णमाला पीपीटी, hindi alphabet PPT presentation, hindi varnamala PPT, Hindi Varnamala pdf, हिंदी स्वर, हिंदी व्यंजन, sikhiye hindi varnmala, dr. mulla adam ali, hindi language and literature, hindi alphabet with drawing, hindi alphabet pdf, hindi varnamala for childrens, hindi language, hindi varnamala practice for kids, https://www.drmullaadamali.com
1. Sampling Distribution
Slide 1
Shakeel Nouman
M.Phil Statistics
Sampling Distribution By Shakeel Nouman M.Phil Statistics Govt. College University Lahore, Statistical Officer
2. Sampling Distributions
6.1
6.2
Slide 2
The Sampling Distribution of the Sample Mean
The Sampling Distribution of the Sample
Proportion
Sampling Distribution By Shakeel Nouman M.Phil Statistics Govt. College University Lahore, Statistical Officer
3. Sampling Distribution of the
Sample Mean
Slide 3
The sampling distribution of the sample mean is the
probability distribution of the population of the
sample means obtainable from all possible samples
of size n from a population of size N
Sampling Distribution By Shakeel Nouman M.Phil Statistics Govt. College University Lahore, Statistical Officer
4. Example: Sampling Annual % Return
on 6 Stocks #1
Slide 4
• Population of the percent returns from six
stocks
– In order, the values of % return are:
10%, 20%, 30%, 40%, 50%, and 60%
» Label each stock A, B, C, …, F in order of increasing %
return
» The mean rate of return is 35% with a standard deviation
of 17.078%
– Any one stock of these stocks is as likely
to be picked as any other of the six
» Uniform distribution with N = 6
» Each stock has a probability of being picked of 1/6 =
0.1667
Sampling Distribution By Shakeel Nouman M.Phil Statistics Govt. College University Lahore, Statistical Officer
5. Example: Sampling Annual %
Return
Slide 5
on 6 Stocks #2
Stock
Stock A
Stock B
Stock C
Stock D
Stock E
Stock F
Total
% Return
10
20
30
40
50
60
Frequency
1
1
1
1
1
1
6
Relative
Frequency
1/6
1/6
1/6
1/6
1/6
1/6
1
Sampling Distribution By Shakeel Nouman M.Phil Statistics Govt. College University Lahore, Statistical Officer
6. Example: Sampling Annual % Return
on 6 Stocks #3
Slide 6
• Now, select all possible samples of
size n = 2 from this population of
stocks of size N = 6
– Now select all possible pairs of stocks
• How to select?
– Sample randomly
– Sample without replacement
– Sample without regard to order
Sampling Distribution By Shakeel Nouman M.Phil Statistics Govt. College University Lahore, Statistical Officer
7. Example: Sampling Annual % Return
on 6 Stocks #4
Slide 7
• Result: There are 15 possible
samples of size n = 2
• Calculate the sample mean of each
and every sample
Sampling Distribution By Shakeel Nouman M.Phil Statistics Govt. College University Lahore, Statistical Officer
8. Example: Sampling Annual % Return
on 6 Stocks #5
Sample
Mean
15
20
25
30
35
40
45
50
55
Slide 8
Relative
Frequency Frequency
1
1/15
1
1/15
2
1/15
2
1/15
3
1/15
2
1/15
2
1/15
1
1/15
1
1/15
Sampling Distribution By Shakeel Nouman M.Phil Statistics Govt. College University Lahore, Statistical Officer
9. Observations
•
•
Slide 9
Although the population of N = 6 stock
returns has a uniform distribution, …
… the histogram of n = 15 sample mean
returns:
1. Seem to be centered over the
sample mean return of 35%, and
2. Appears to be bell-shaped and
less spread out than the
histogram of individual returns
Sampling Distribution By Shakeel Nouman M.Phil Statistics Govt. College University Lahore, Statistical Officer
10. General Conclusions
Slide 10
• If the population of individual items is
normal, then the population of all
sample means is also normal
• Even if the population of individual
items is not normal, there are
circumstances when the population of
all sample means is normal (Central
Limit Theorem)
11. General Conclusions Continued 11
Slide
• The mean of all possible sample means
equals the population mean
– That is, m = mx
• The standard deviation sx of all sample
means is less than the standard
deviation of the population
– That is, sx < s
» Each sample mean averages out the high and the
low measurements, and so are closer to m than
many of the individual population measurements
12. And the Empirical Rule
Slide 12
• The empirical rule holds for the sampling
distribution of the sample mean
– 68.26% of all possible sample means are within
(plus or minus) one standard deviation sx of m
– 95.44% of all possible observed values of x are
within (plus or minus) two sx of m
– 99.73% of all possible observed values of x are
within (plus or minus) three sx of m
13. Properties of the Sampling
Distribution of the Sample Mean #1
Slide 13
• If the population being sampled is normal, then so is
the sampling distribution of the sample mean, x
• The mean sx of the sampling distribution of x is
mx = m
•
That is, the mean of all possible sample means is the same
as the population mean
Sampling Distribution By Shakeel Nouman M.Phil Statistics Govt. College University Lahore, Statistical Officer
14. Properties of the Sampling
Distribution of the Sample Mean #2
Slide 14
• The variance s 2 of the sampling distribution of x is
x
s
2
x
s2
n
That is, the variance of the sampling distribution x
of
is
directly proportional to the variance of the
population, and
inversely proportional to the sample size
Sampling Distribution By Shakeel Nouman M.Phil Statistics Govt. College University Lahore, Statistical Officer
15. Properties of the Sampling
Distribution of the Sample Mean #3
Slide 15
• The standard deviation sx of the sampling distribution
of x is
sx
s
n
That is, the standard deviation of the sampling
distribution of x is
directly proportional to the standard deviation of
the population, and
inversely proportional to the square root of the
sample size
Sampling Distribution By Shakeel Nouman M.Phil Statistics Govt. College University Lahore, Statistical Officer
16. Notes
Slide 16
• The formulas for s2x and sx hold if the sampled
population is infinite
• The formulas hold approximately if the sampled
population is finite but if N is much larger (at
least 20 times larger) than the n (N/n ≥ 20)
– x is the point estimate of m, and the larger the
sample size n, the more accurate the estimate
– Because as n increases, sx decreases as 1/√n
» Additionally, as n increases, the more
representative is the sample of the population
• So, to reduce sx, take bigger samples!
17. Reasoning from the Sampling
Distribution
Slide 17
• Recall from Chapter 2 mileage example,
x = 31.5531 mpg for a sample of size n=49
– With s = 0.7992
• Does this give statistical evidence that the
population mean m is greater than 31 mpg
– That is, does the sample mean give evidence that m
is at least 31 mpg
• Calculate the probability of observing a
sample mean that is greater than or equal to
31.5531 mpg if m = 31 mpg
– Want P(x > 31.5531 if m = 31)
18. Reasoning from the Sampling
Distribution Continued
Slide 18
• Use s as the point estimate for s so that
sx
s
n
0.7992
0.1143
49
• Then
31.5531 m x
Px 31.5531if m 31 P z
sx
31.5531 31
P z
0.1143
Pz 4.84
• But z = 4.84 is off the standard normal table
• The largest z value in the table is 3.09, which has a right hand
tail area of 0.001
Sampling Distribution By Shakeel Nouman M.Phil Statistics Govt. College University Lahore, Statistical Officer
19. Reasoning from the Sampling
Distribution #3
Slide 19
• z = 4.84 > 3.09, so P(z ≥ 4.84) < 0.001
• That is, if m = 31 mpg, then fewer than 1 in 1,000
of all possible samples have a mean at least as
large as observed
• Have either of the following explanations:
– If m is actually 31 mpg, then very unlucky in
picking this sample
OR
– Not unlucky, but m is not 31 mpg, but is really
larger
• Difficult to believe such a small chance would
occur, so conclude that there is strong evidence
that m does not equal 31 mpg
– Also, m is, in fact, actually larger than 31 mpg
Sampling Distribution By Shakeel Nouman M.Phil Statistics Govt. College University Lahore, Statistical Officer
20. Central Limit Theorem
Slide 20
• Now consider sampling a non-normal population
• Still have: m x m
and
sx s n
– Exactly correct if infinite population
– Approximately correct if population size N finite but much
larger than sample size n
» Especially if N ≥ 20 n
• But if population is non-normal, what is the shape of the
sampling distribution of the sample mean?
– Is it normal, like it is if the population is normal?
– Yes, the sampling distribution is approximately normal if the
sample is large enough, even if the population is non-normal
» By the “Central Limit Theorem”
Sampling Distribution By Shakeel Nouman M.Phil Statistics Govt. College University Lahore, Statistical Officer
21. The Central Limit Theorem #2 21
Slide
• No matter what is the probability distribution
that describes the population, if the sample
size n is large enough, then the population of
all possible sample means is approximately
normal with mean m x m and standard
deviation s x s n
• Further, the larger the sample size n, the closer
the sampling distribution of the sample mean
is to being normal
– In other words, the larger n, the better the
approximation
Sampling Distribution By Shakeel Nouman M.Phil Statistics Govt. College University Lahore, Statistical Officer
22. How Large?
Slide 22
• How large is “large enough?”
• If the sample size is at least 30, then for most
sampled populations, the sampling distribution of
sample means is approximately normal
– Here, if n is at least 30, it will be assumed that the
sampling distribution of x is approximately normal
» If the population is normal, then the sampling
distribution of x is normal no regardless of the sample
size
23. Unbiased Estimates
Slide 23
• A sample statistic is an unbiased point estimate
of a population parameter if the mean of all
possible values of the sample statistic equals the
population parameter
• x is an unbiased estimate of m because mx=m
– In general, the sample mean is always an
unbiased estimate of m
– The sample median is often an unbiased estimate
of m
» But not always
Sampling Distribution By Shakeel Nouman M.Phil Statistics Govt. College University Lahore, Statistical Officer
24. Unbiased Estimates Continued 24
Slide
• The sample variance s2 is an unbiased estimate of s2
– That is why s2 has a divisor of n – 1 and not n
• However, s is not an unbiased estimate of s
– Even so, the usual practice is to use s as an estimate of s
Sampling Distribution By Shakeel Nouman M.Phil Statistics Govt. College University Lahore, Statistical Officer
25. Minimum Variance Estimates 25
Slide
• Want the sample statistic to have a small
standard deviation
– All values of the sample statistic should be
clustered around the population parameter
» Then, the statistic from any sample should be close to the
population parameter
» Given a choice between unbiased estimates, choose one with
smallest standard deviation
» The sample mean and the sample median are both unbiased
estimates of m
» The sampling distribution of sample means generally has a
smaller standard deviation than that of sample medians
Sampling Distribution By Shakeel Nouman M.Phil Statistics Govt. College University Lahore, Statistical Officer
26. Finite Populations
Slide 26
• If a finite population of size N is sampled
randomly and without replacement, must use
the “finite population correction” to calculate
the correct standard deviation of the sampling
distribution of the sample mean
– If N is less than 20 times the sample size, that is,
if N < 20 n
– Otherwise
sx
s
n
but instead s x
s
n
Sampling Distribution By Shakeel Nouman M.Phil Statistics Govt. College University Lahore, Statistical Officer
27. Finite Populations ContinuedSlide 27
• The finite population correction is
N n
N 1
• and the standard error is
sx
s
n
N n
N 1
Sampling Distribution By Shakeel Nouman M.Phil Statistics Govt. College University Lahore, Statistical Officer
28. Sampling Distribution of the
Sample Proportion
Slide 28
The probability distribution of all possible sample
proportions is the sampling distribution of the sample
proportion
ˆ
p
If a random sample of size n is taken from a population
then the sampling distribution of is
ˆ
p
approximately normal, if n is large
has mean m ˆ p
p
p1 p
has standard deviation s ˆp
n
p
where p is the population proportion andˆ is a sampled
proportion
29. Slide 29
Name
Religion
Domicile
Contact #
E.Mail
M.Phil (Statistics)
Shakeel Nouman
Christian
Punjab (Lahore)
0332-4462527. 0321-9898767
sn_gcu@yahoo.com
sn_gcu@hotmail.com
GC University, .
(Degree awarded by GC University)
M.Sc (Statistics)
Statitical Officer
(BS-17)
(Economics & Marketing
Division)
GC University, .
(Degree awarded by GC University)
Livestock Production Research Institute
Bahadurnagar (Okara), Livestock & Dairy Development
Department, Govt. of Punjab
Sampling Distribution By Shakeel Nouman M.Phil Statistics Govt. College University Lahore, Statistical Officer