Download to read offline
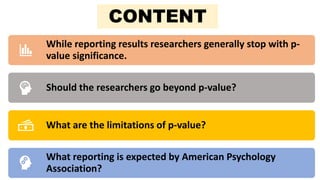

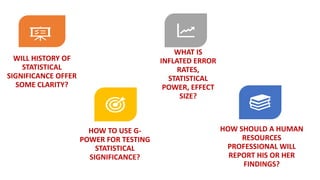
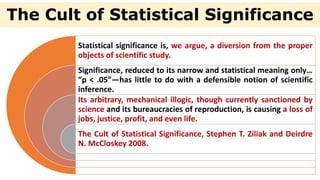
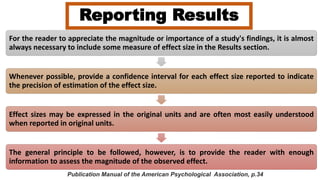


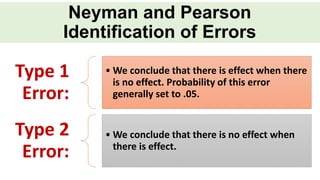


The document discusses the limitations and criticisms of p-values in statistical significance testing, emphasizing the need for effect size and confidence intervals to better represent study findings. It highlights the difference between null and alternative hypotheses, the implications of type I and type II errors, and how sample size and multiple comparisons can affect the reliability of p-values. Ultimately, the document argues for a more nuanced understanding of statistical significance beyond conventional threshold values like p < .05.


![The Crooked Timber of New India [Autosaved].pptx](https://cdn.slidesharecdn.com/ss_thumbnails/thecrookedtimberofnewindiaautosaved-240302045121-e57b6550-thumbnail.jpg?width=640&height=640&fit=bounds)


