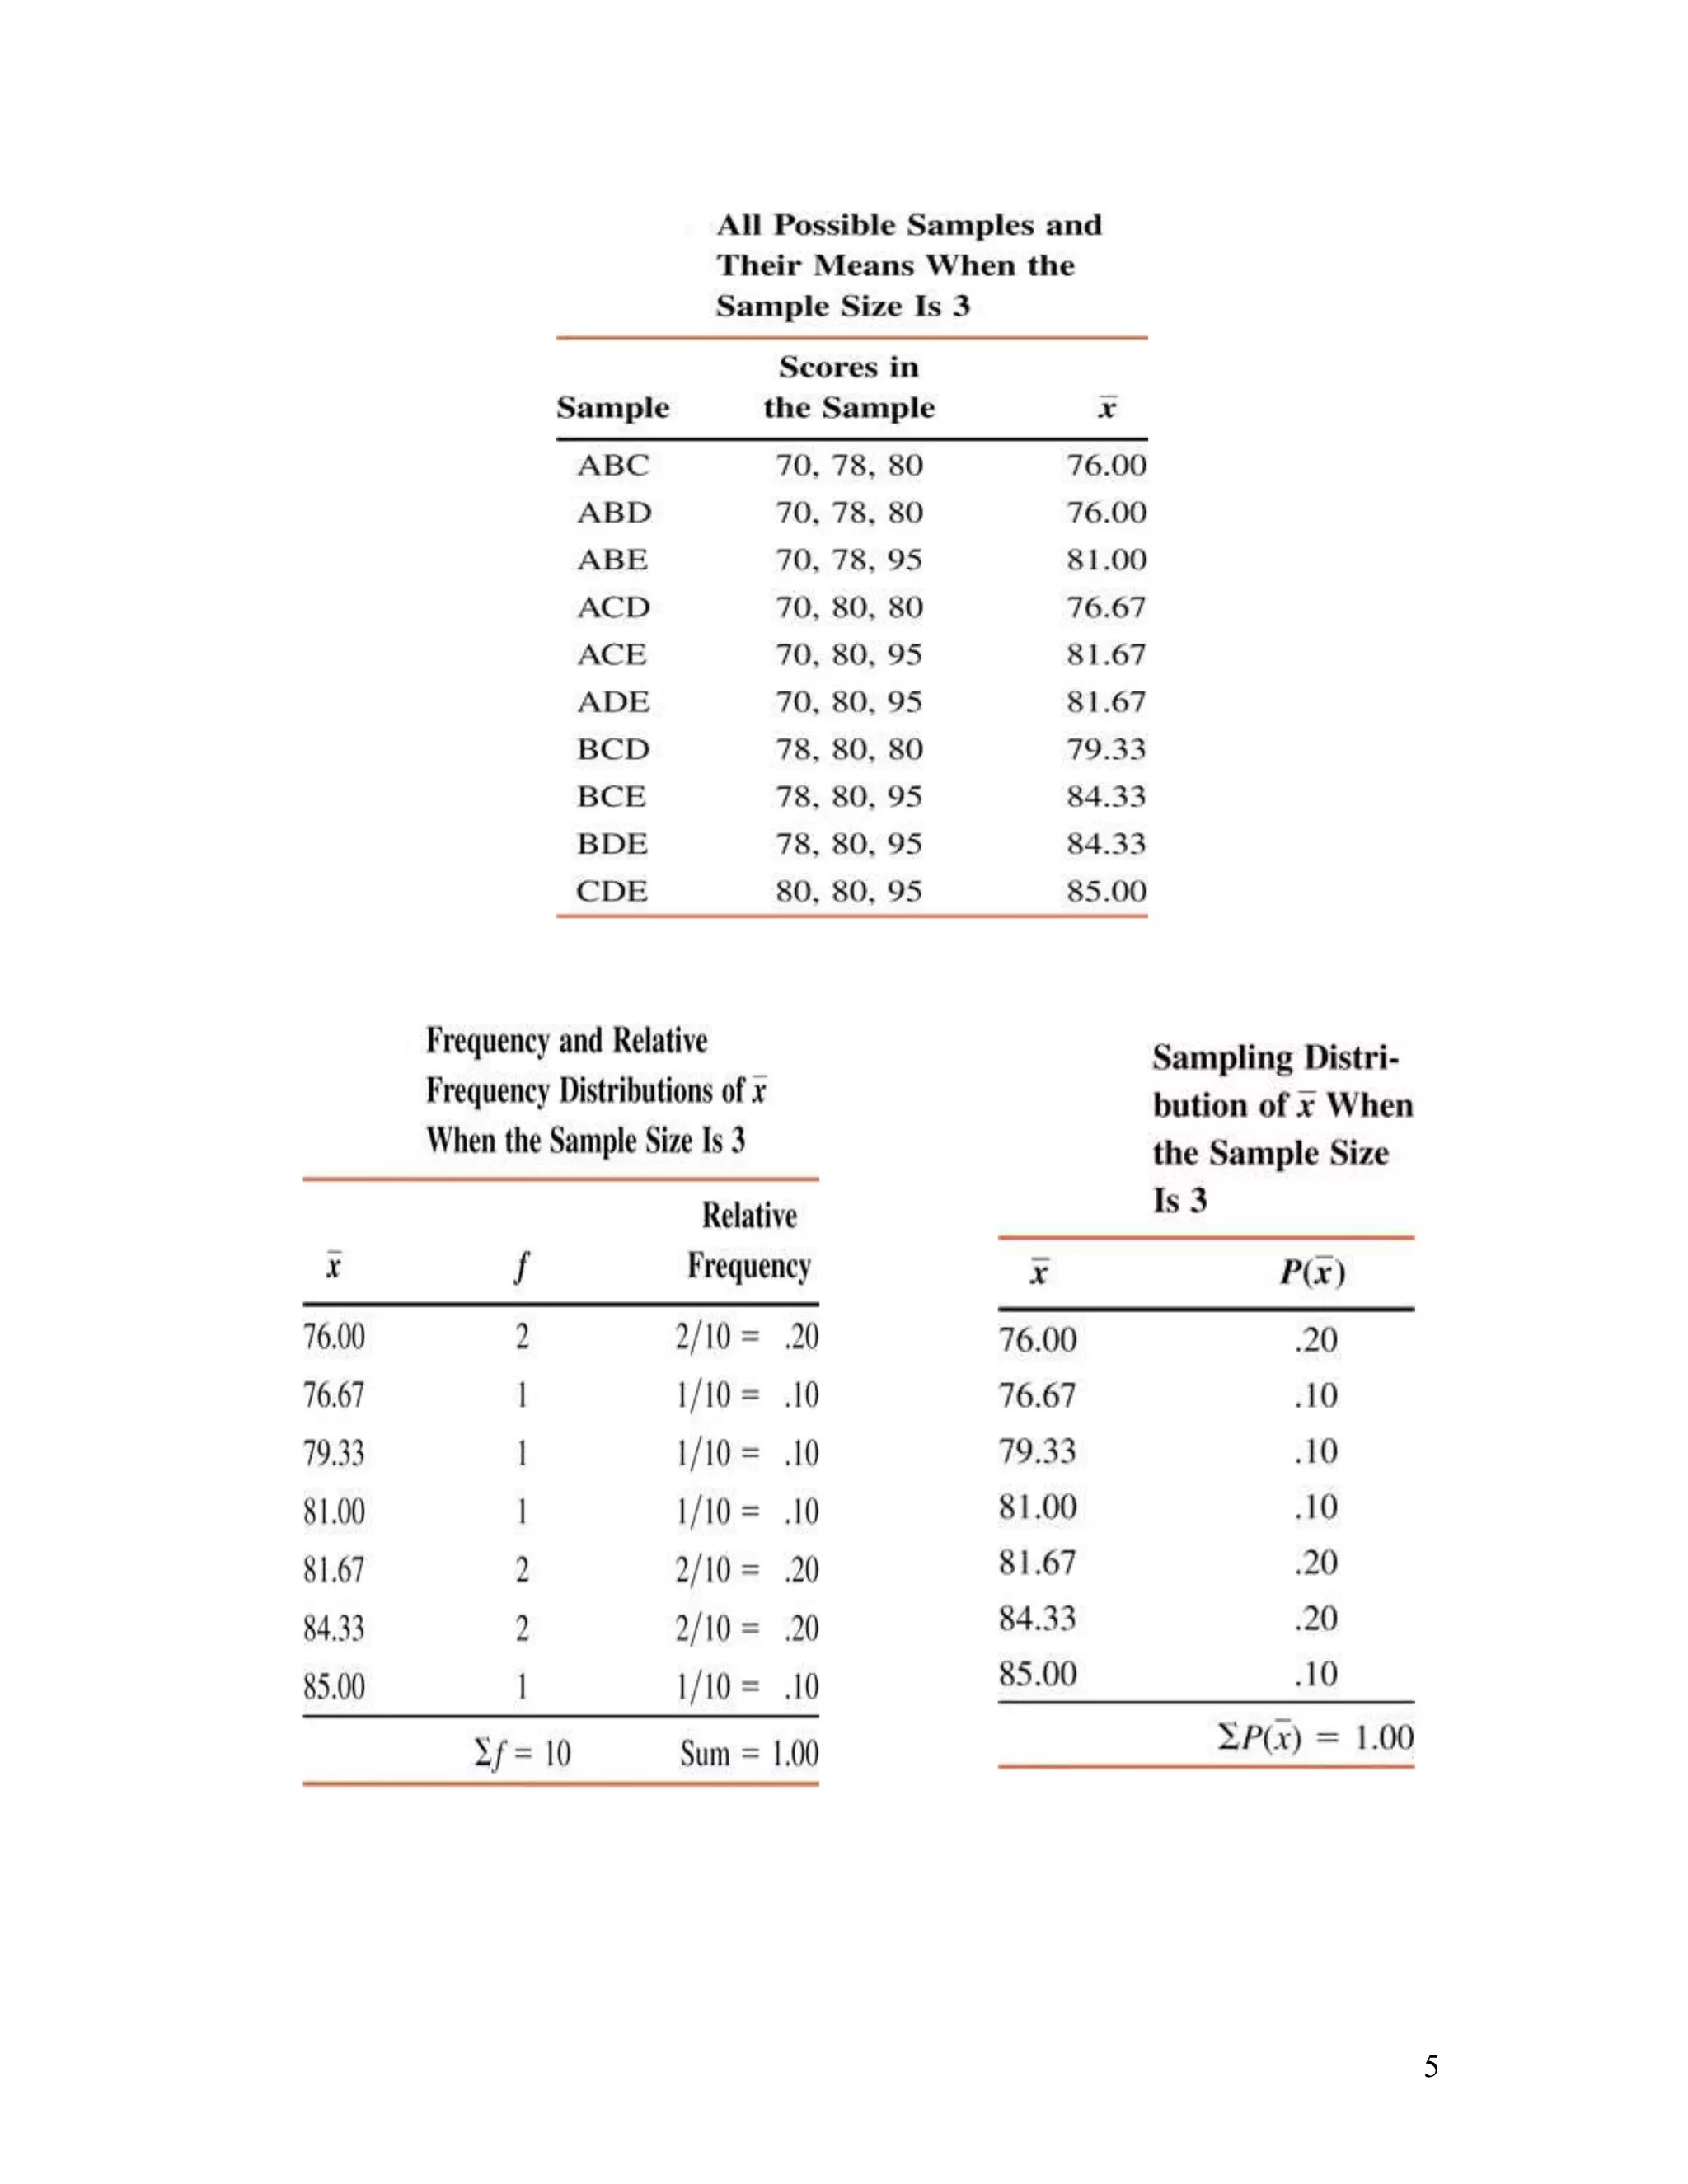
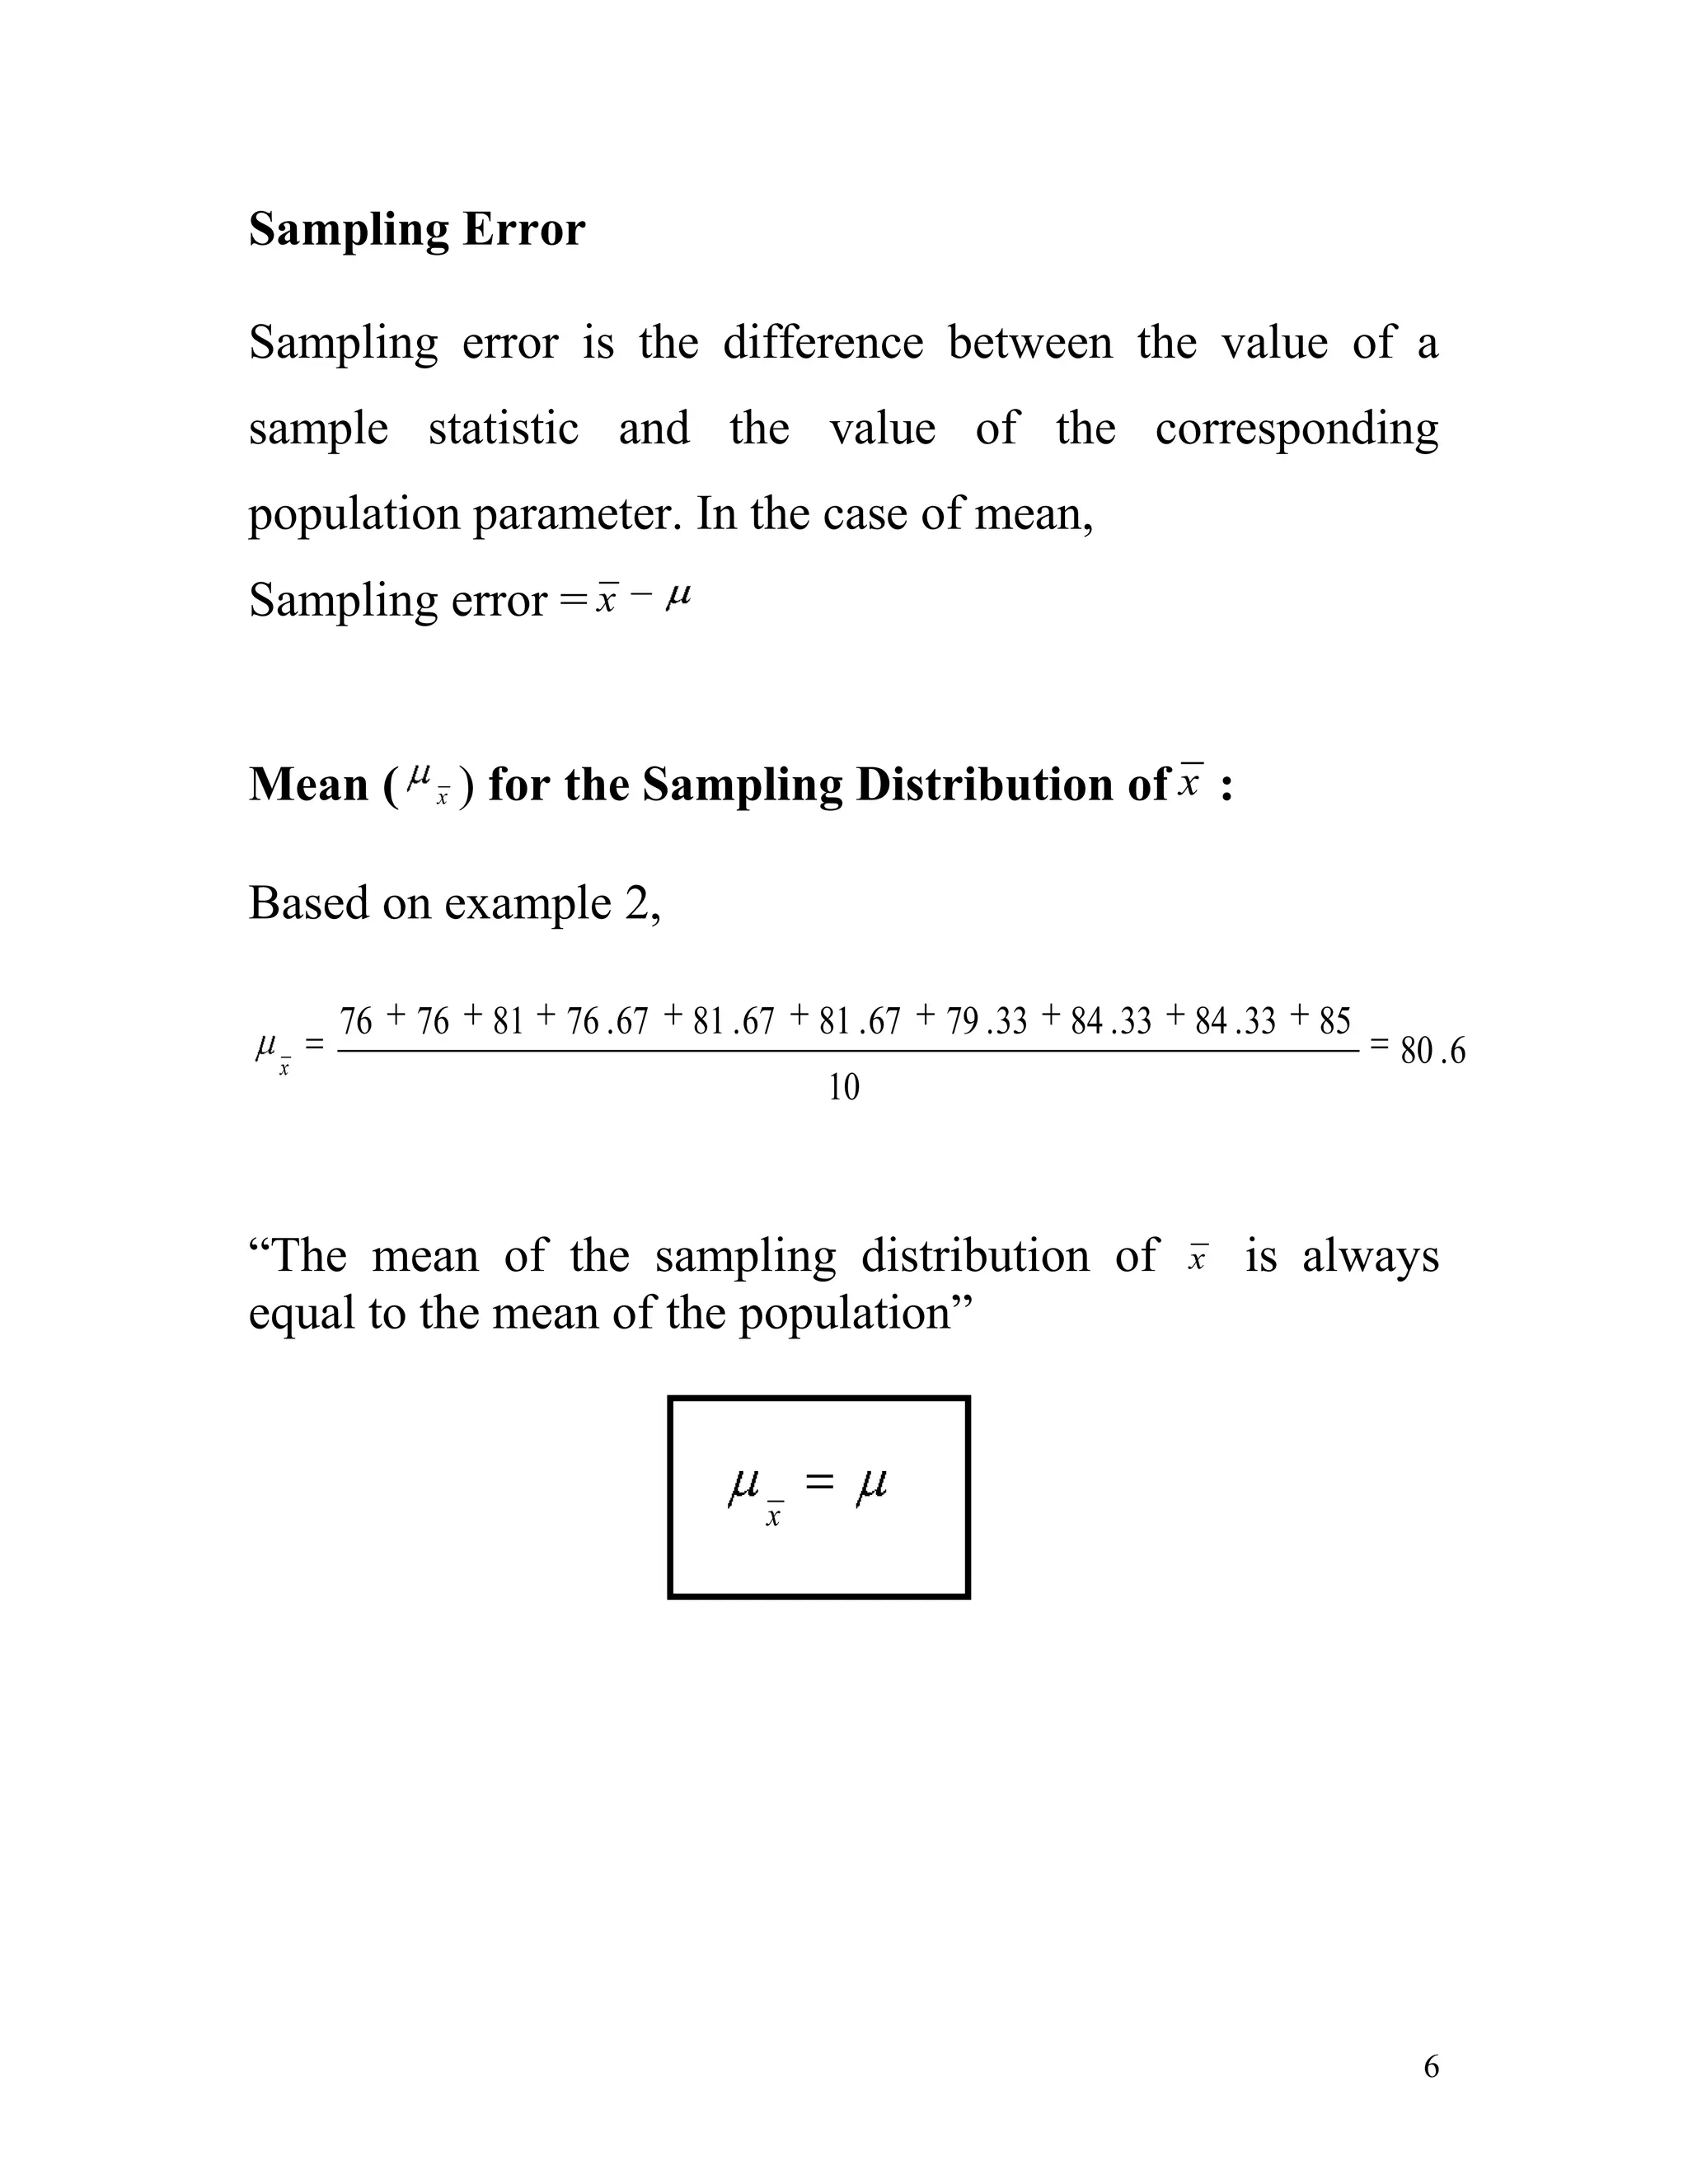
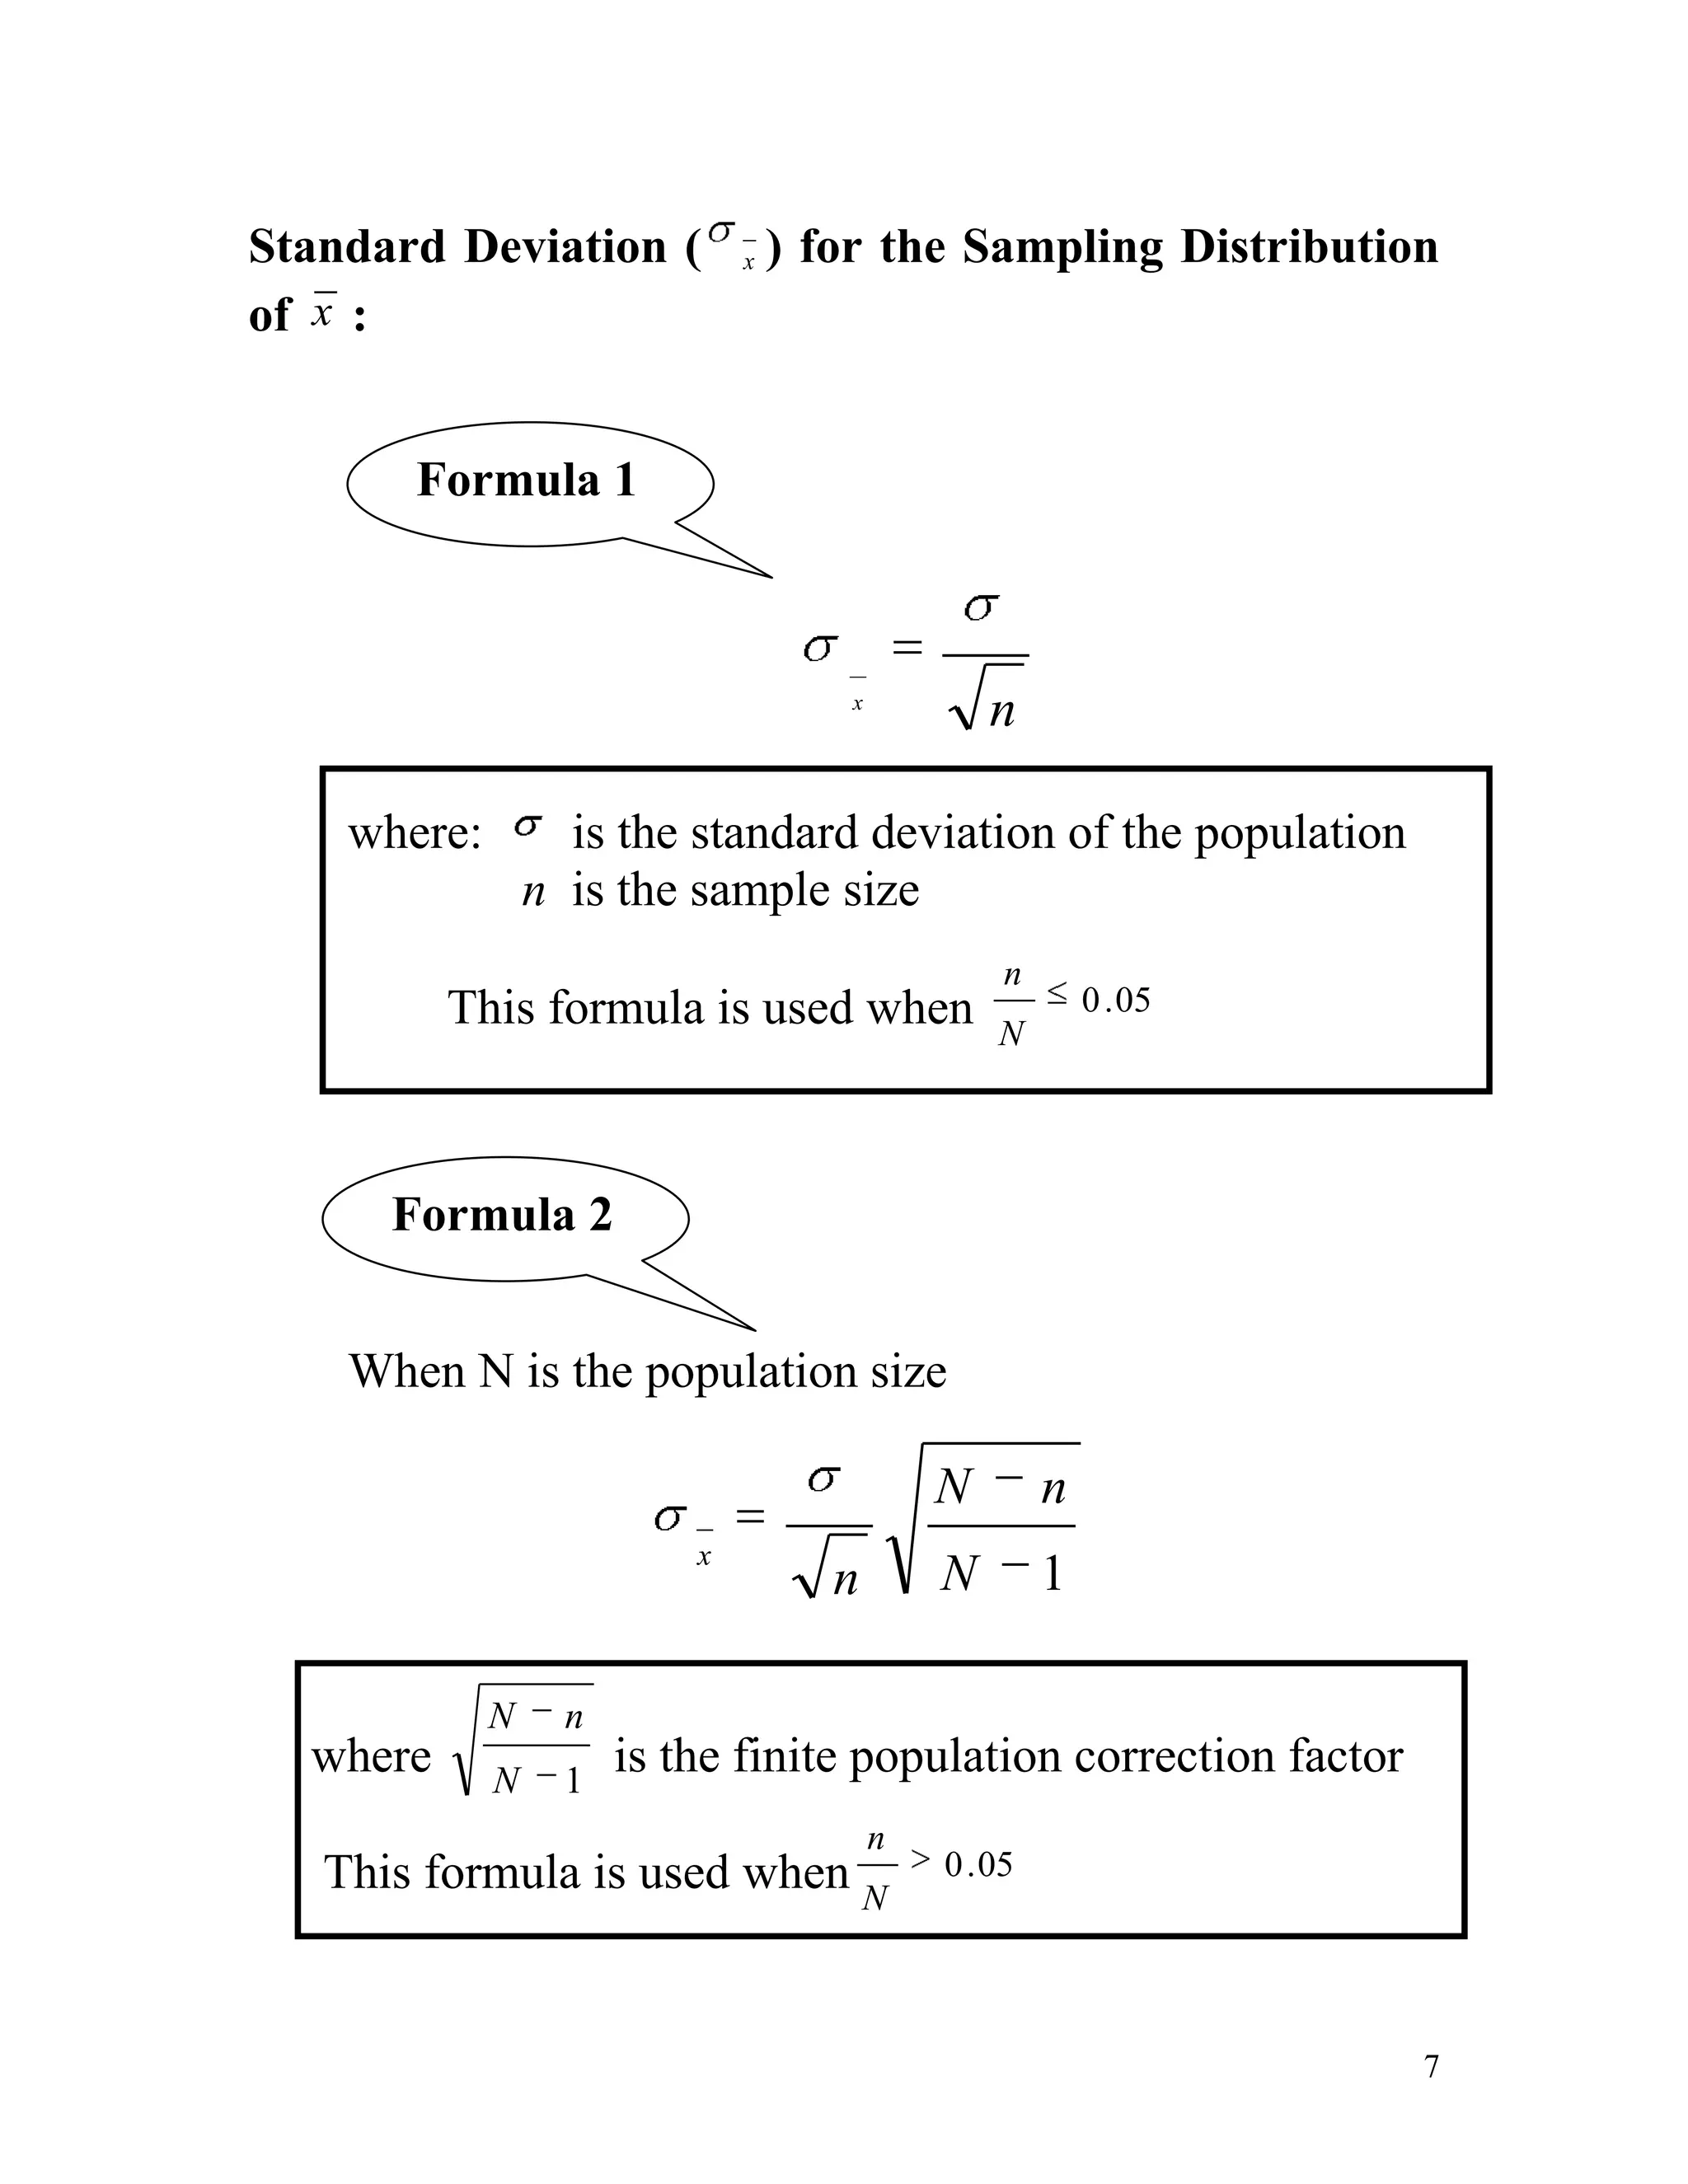
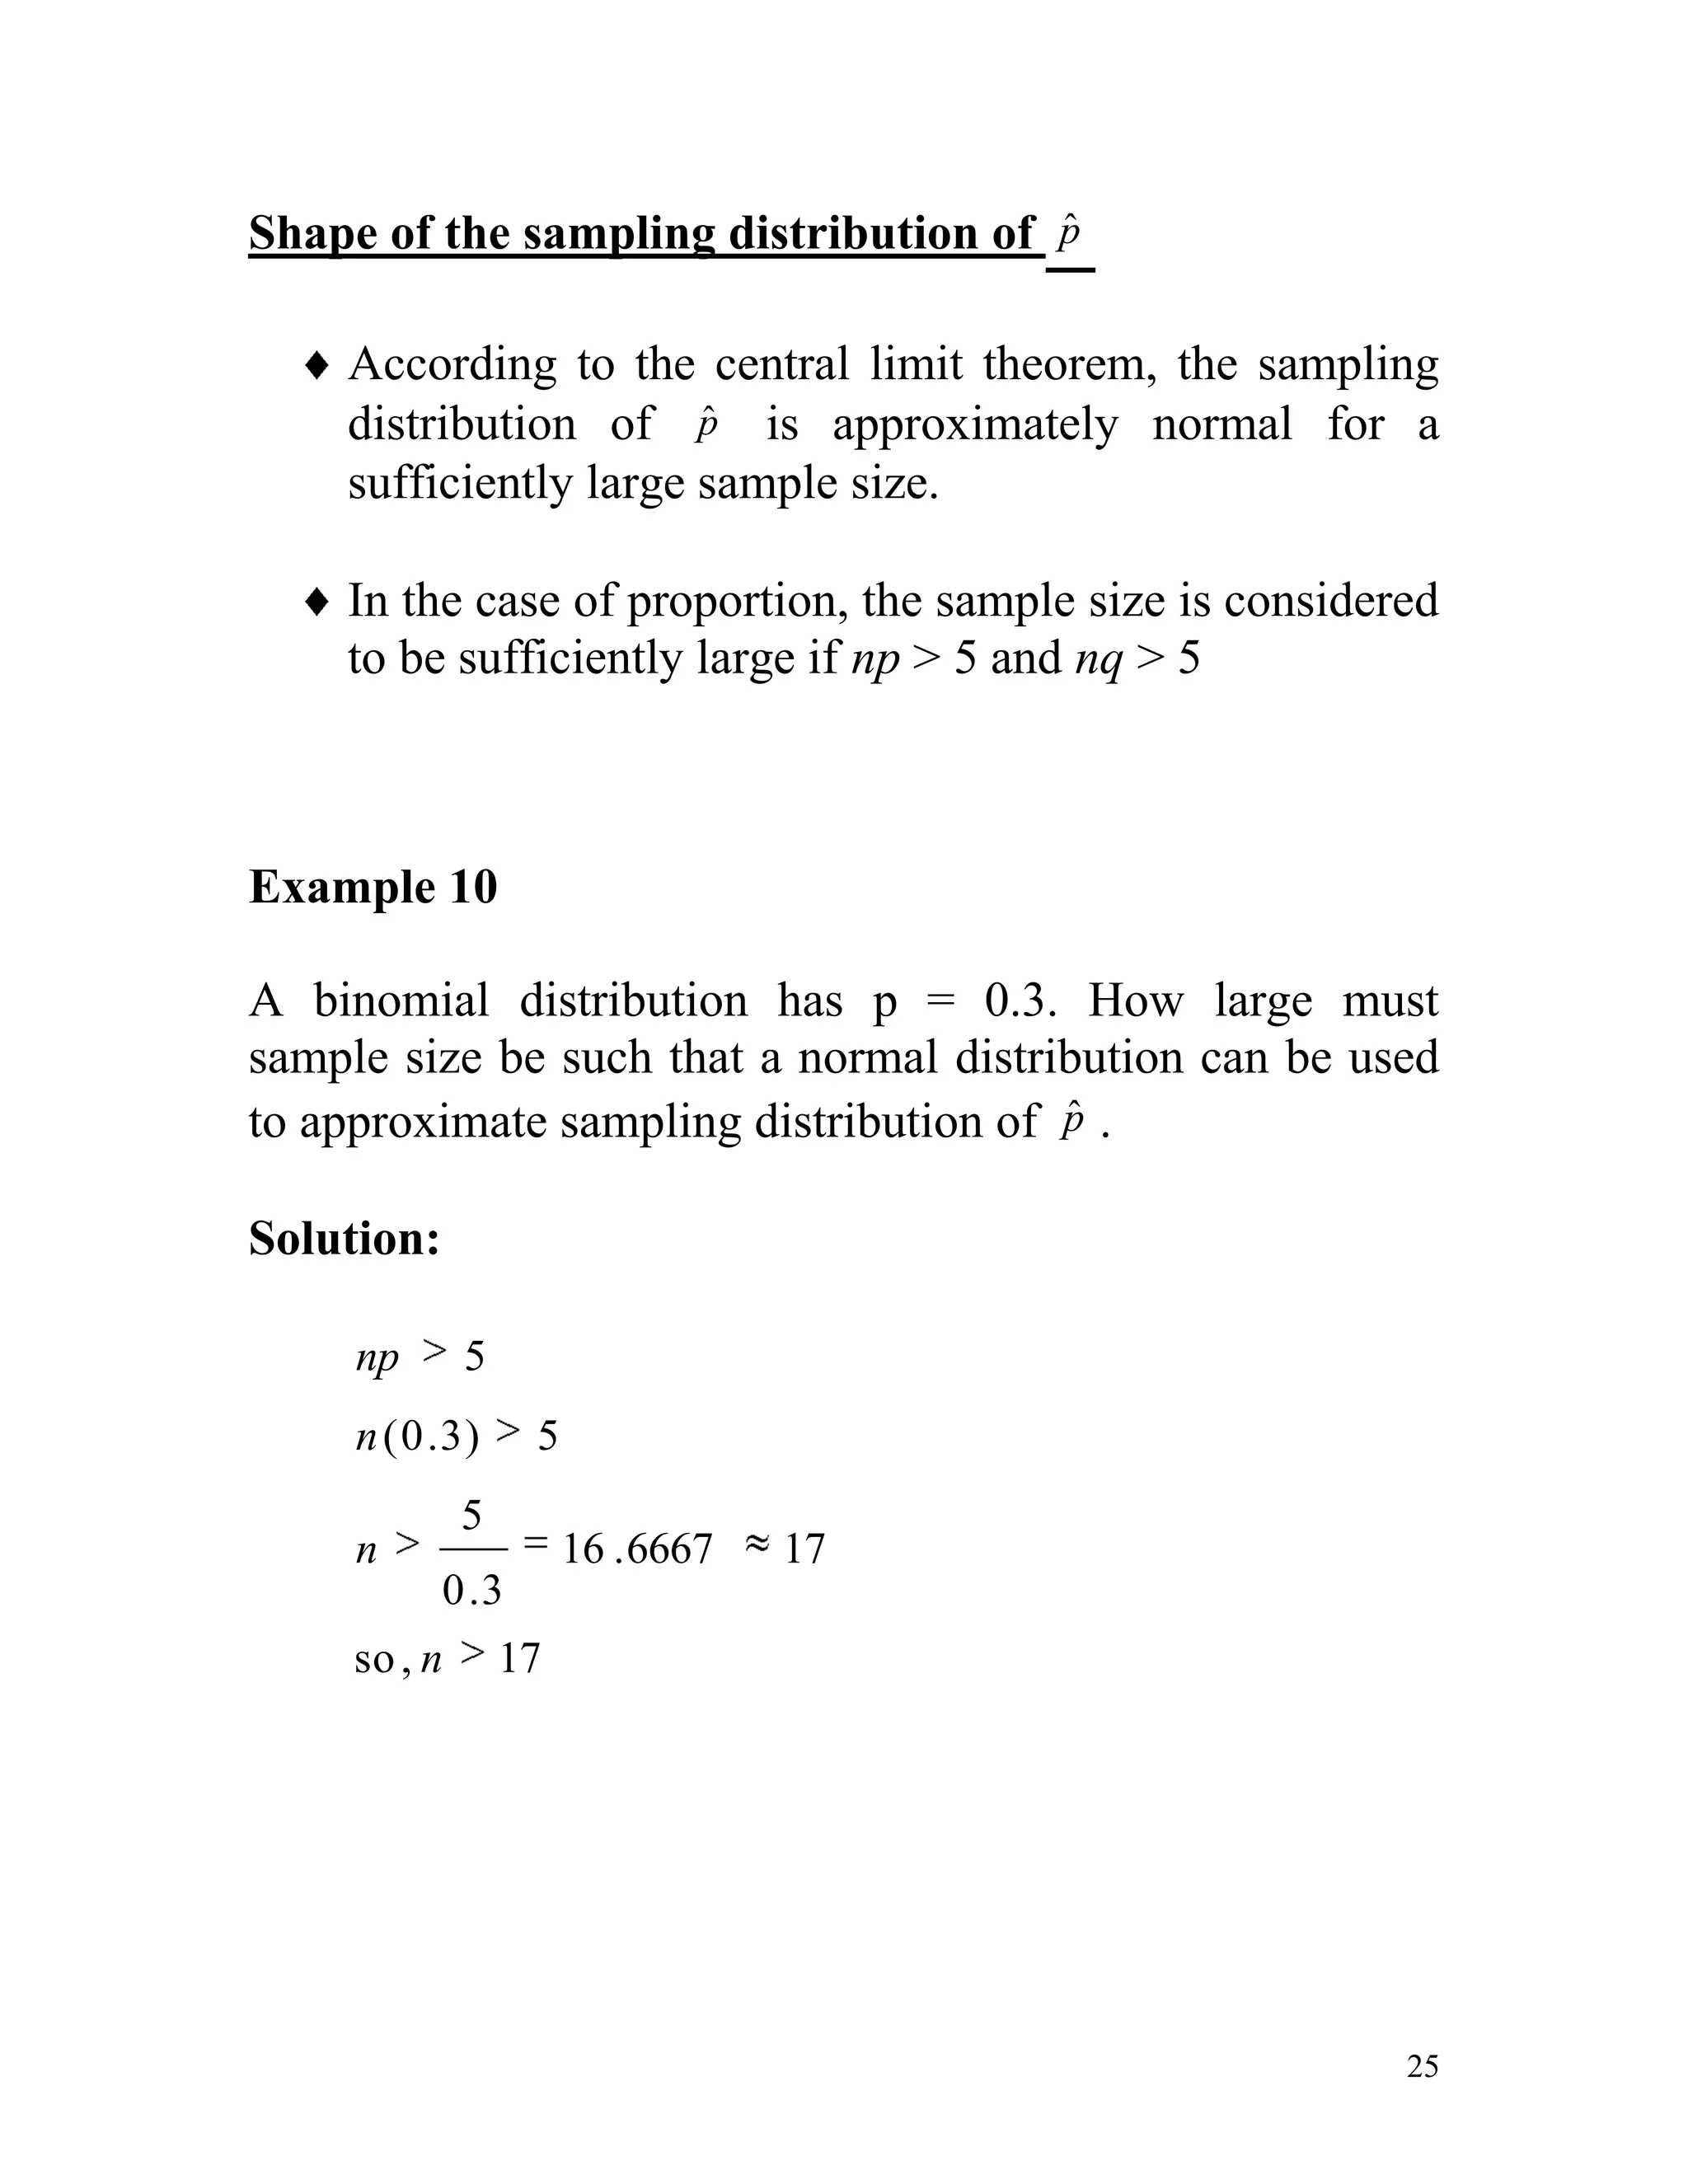
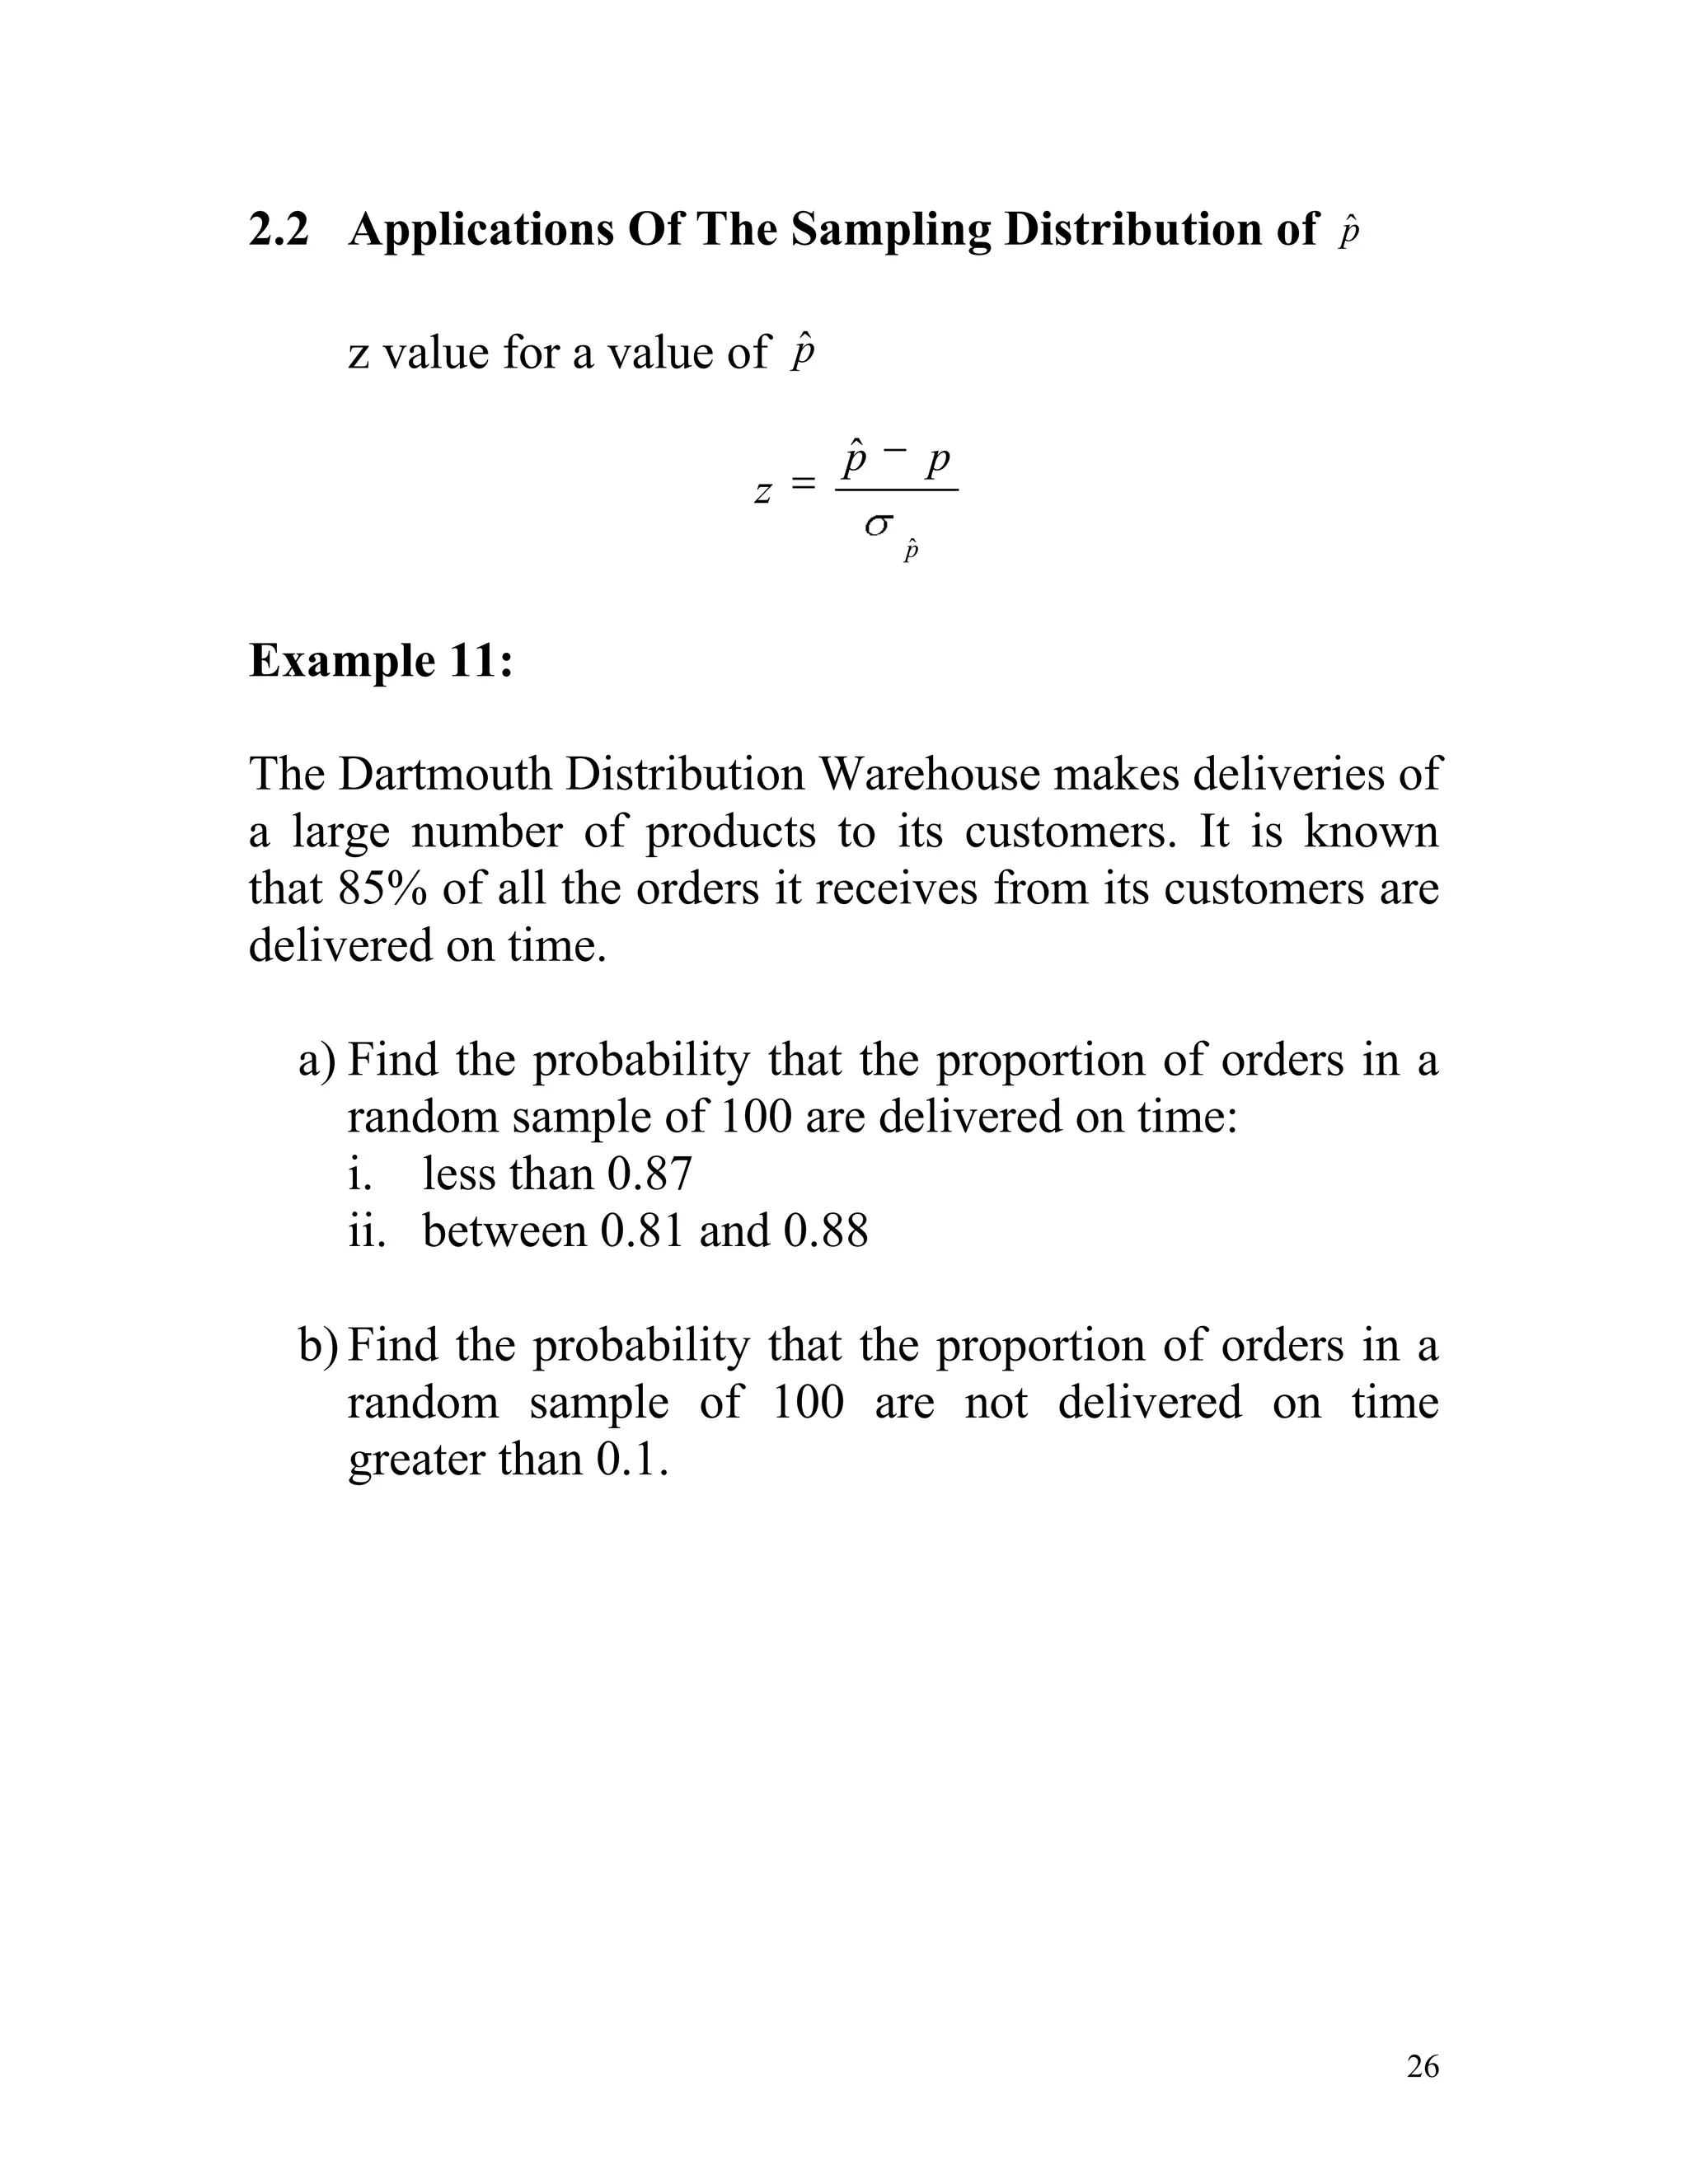
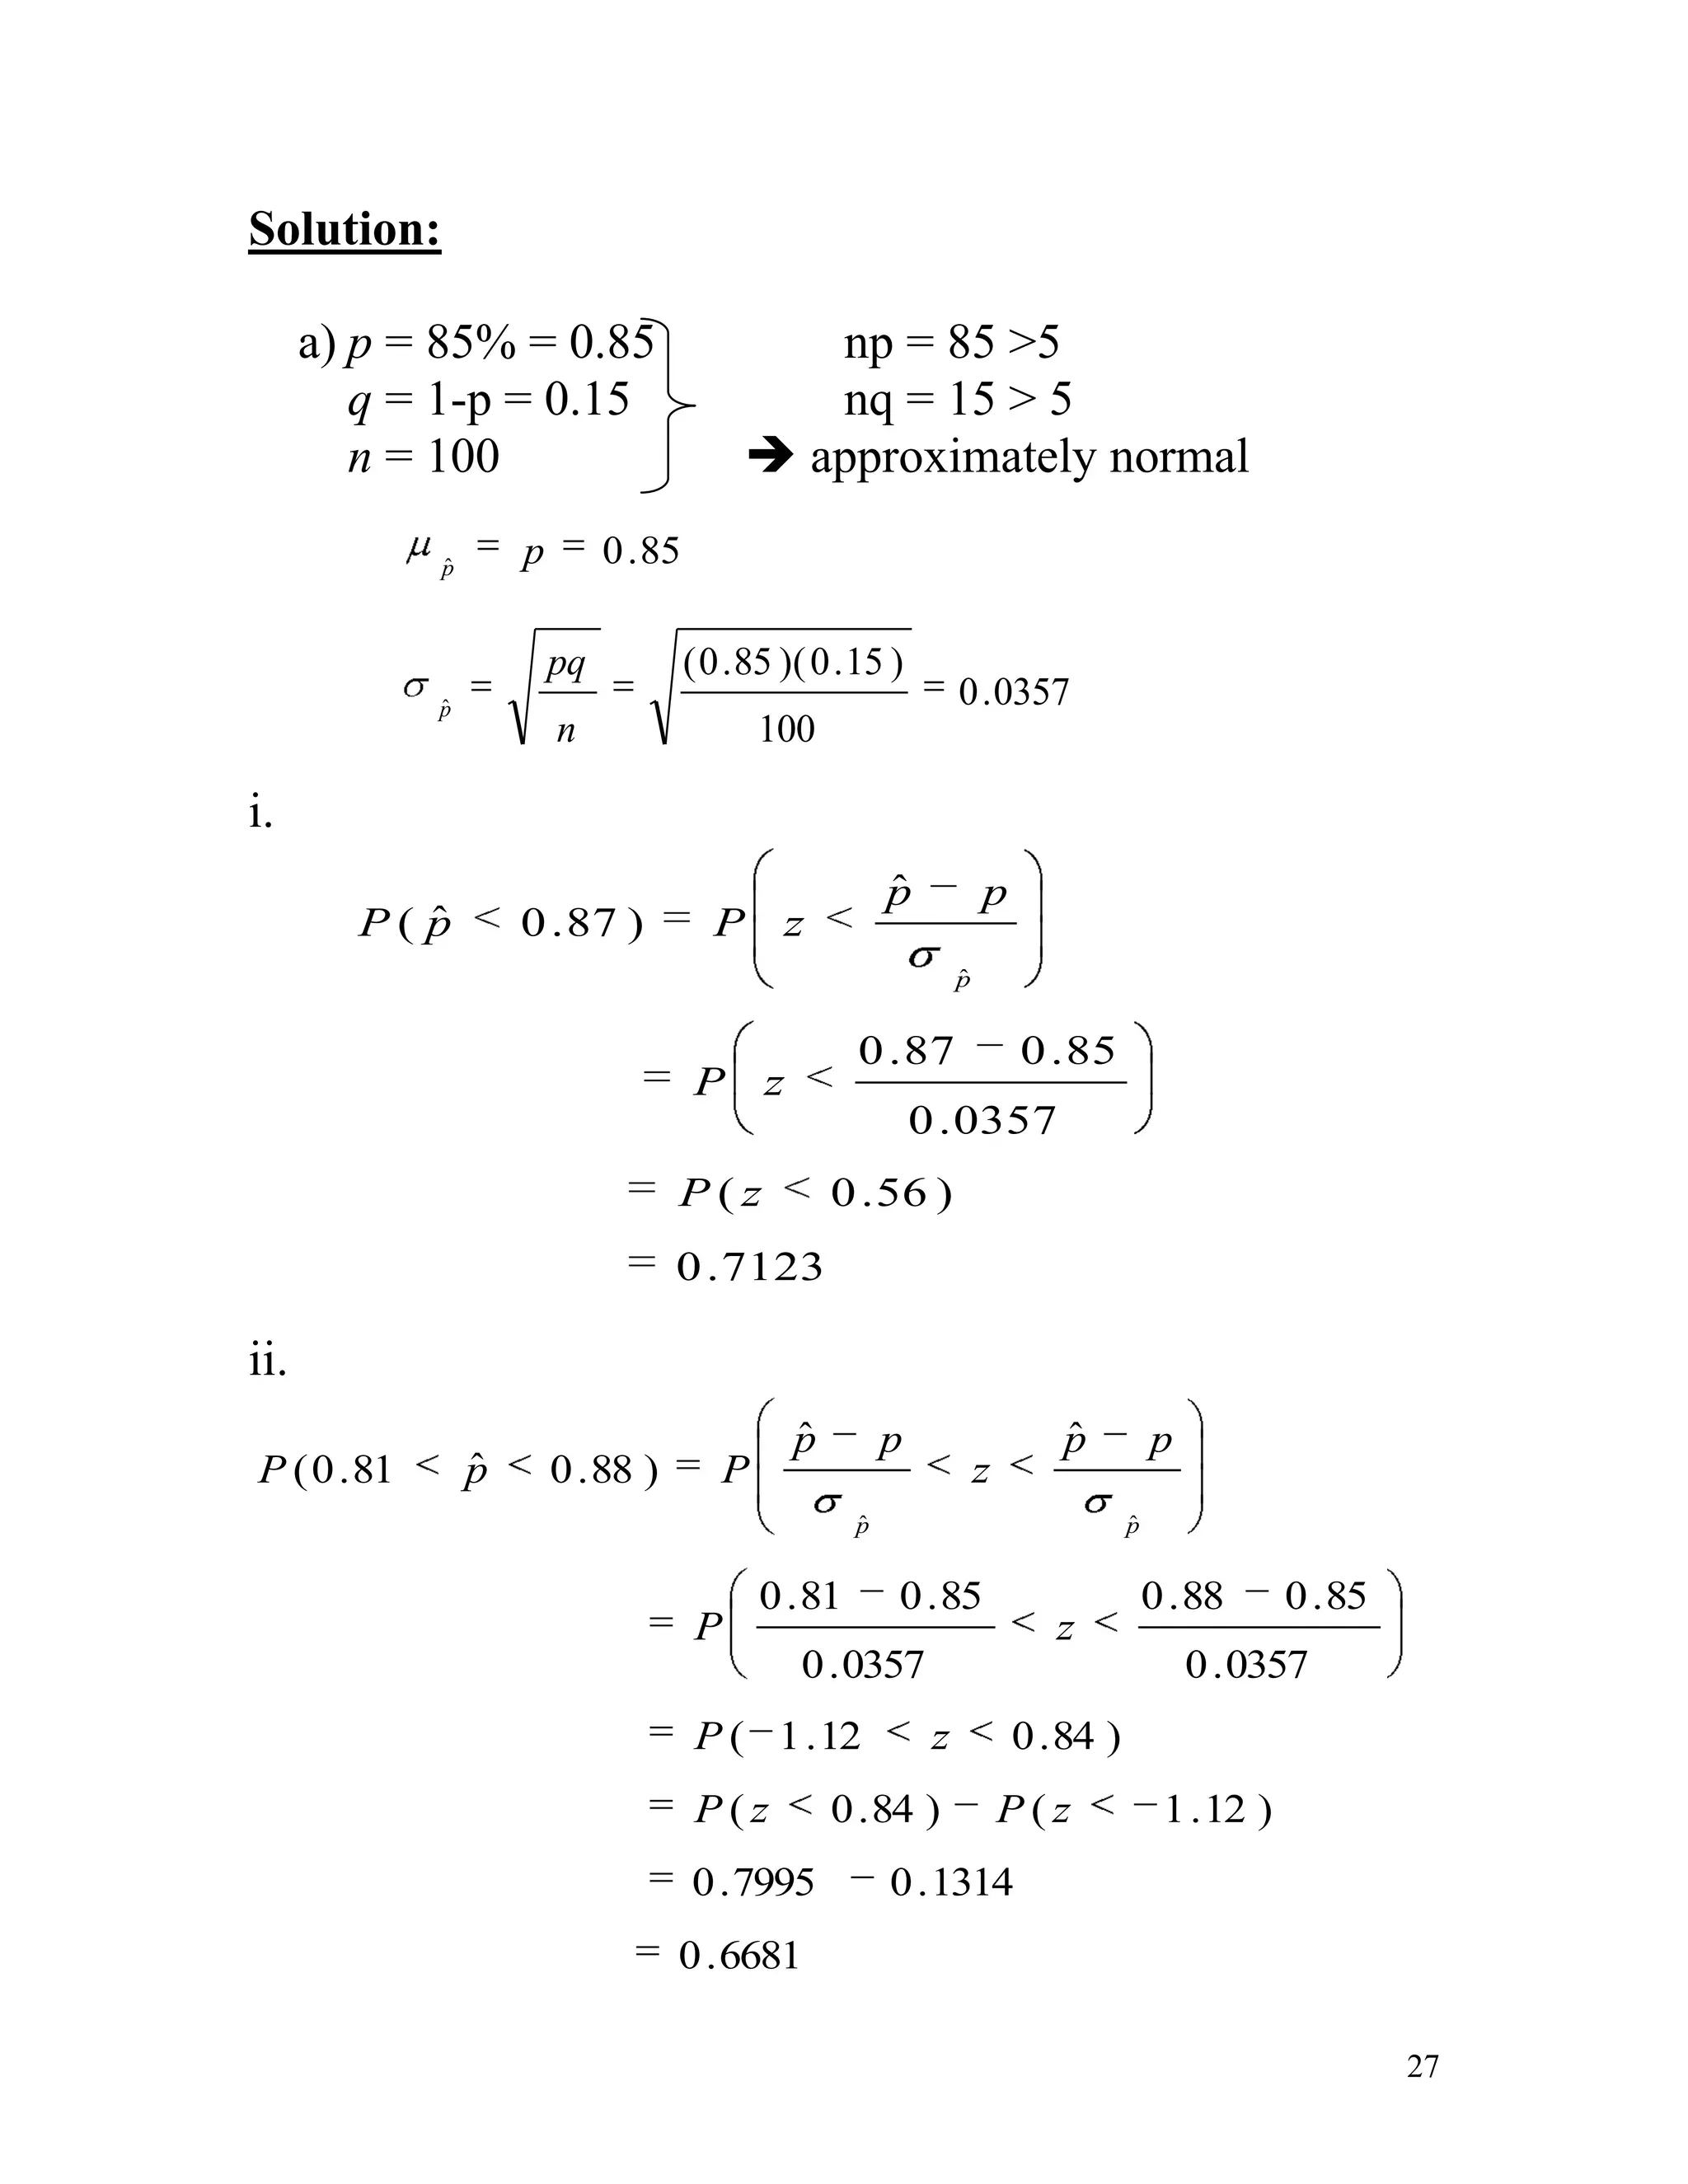
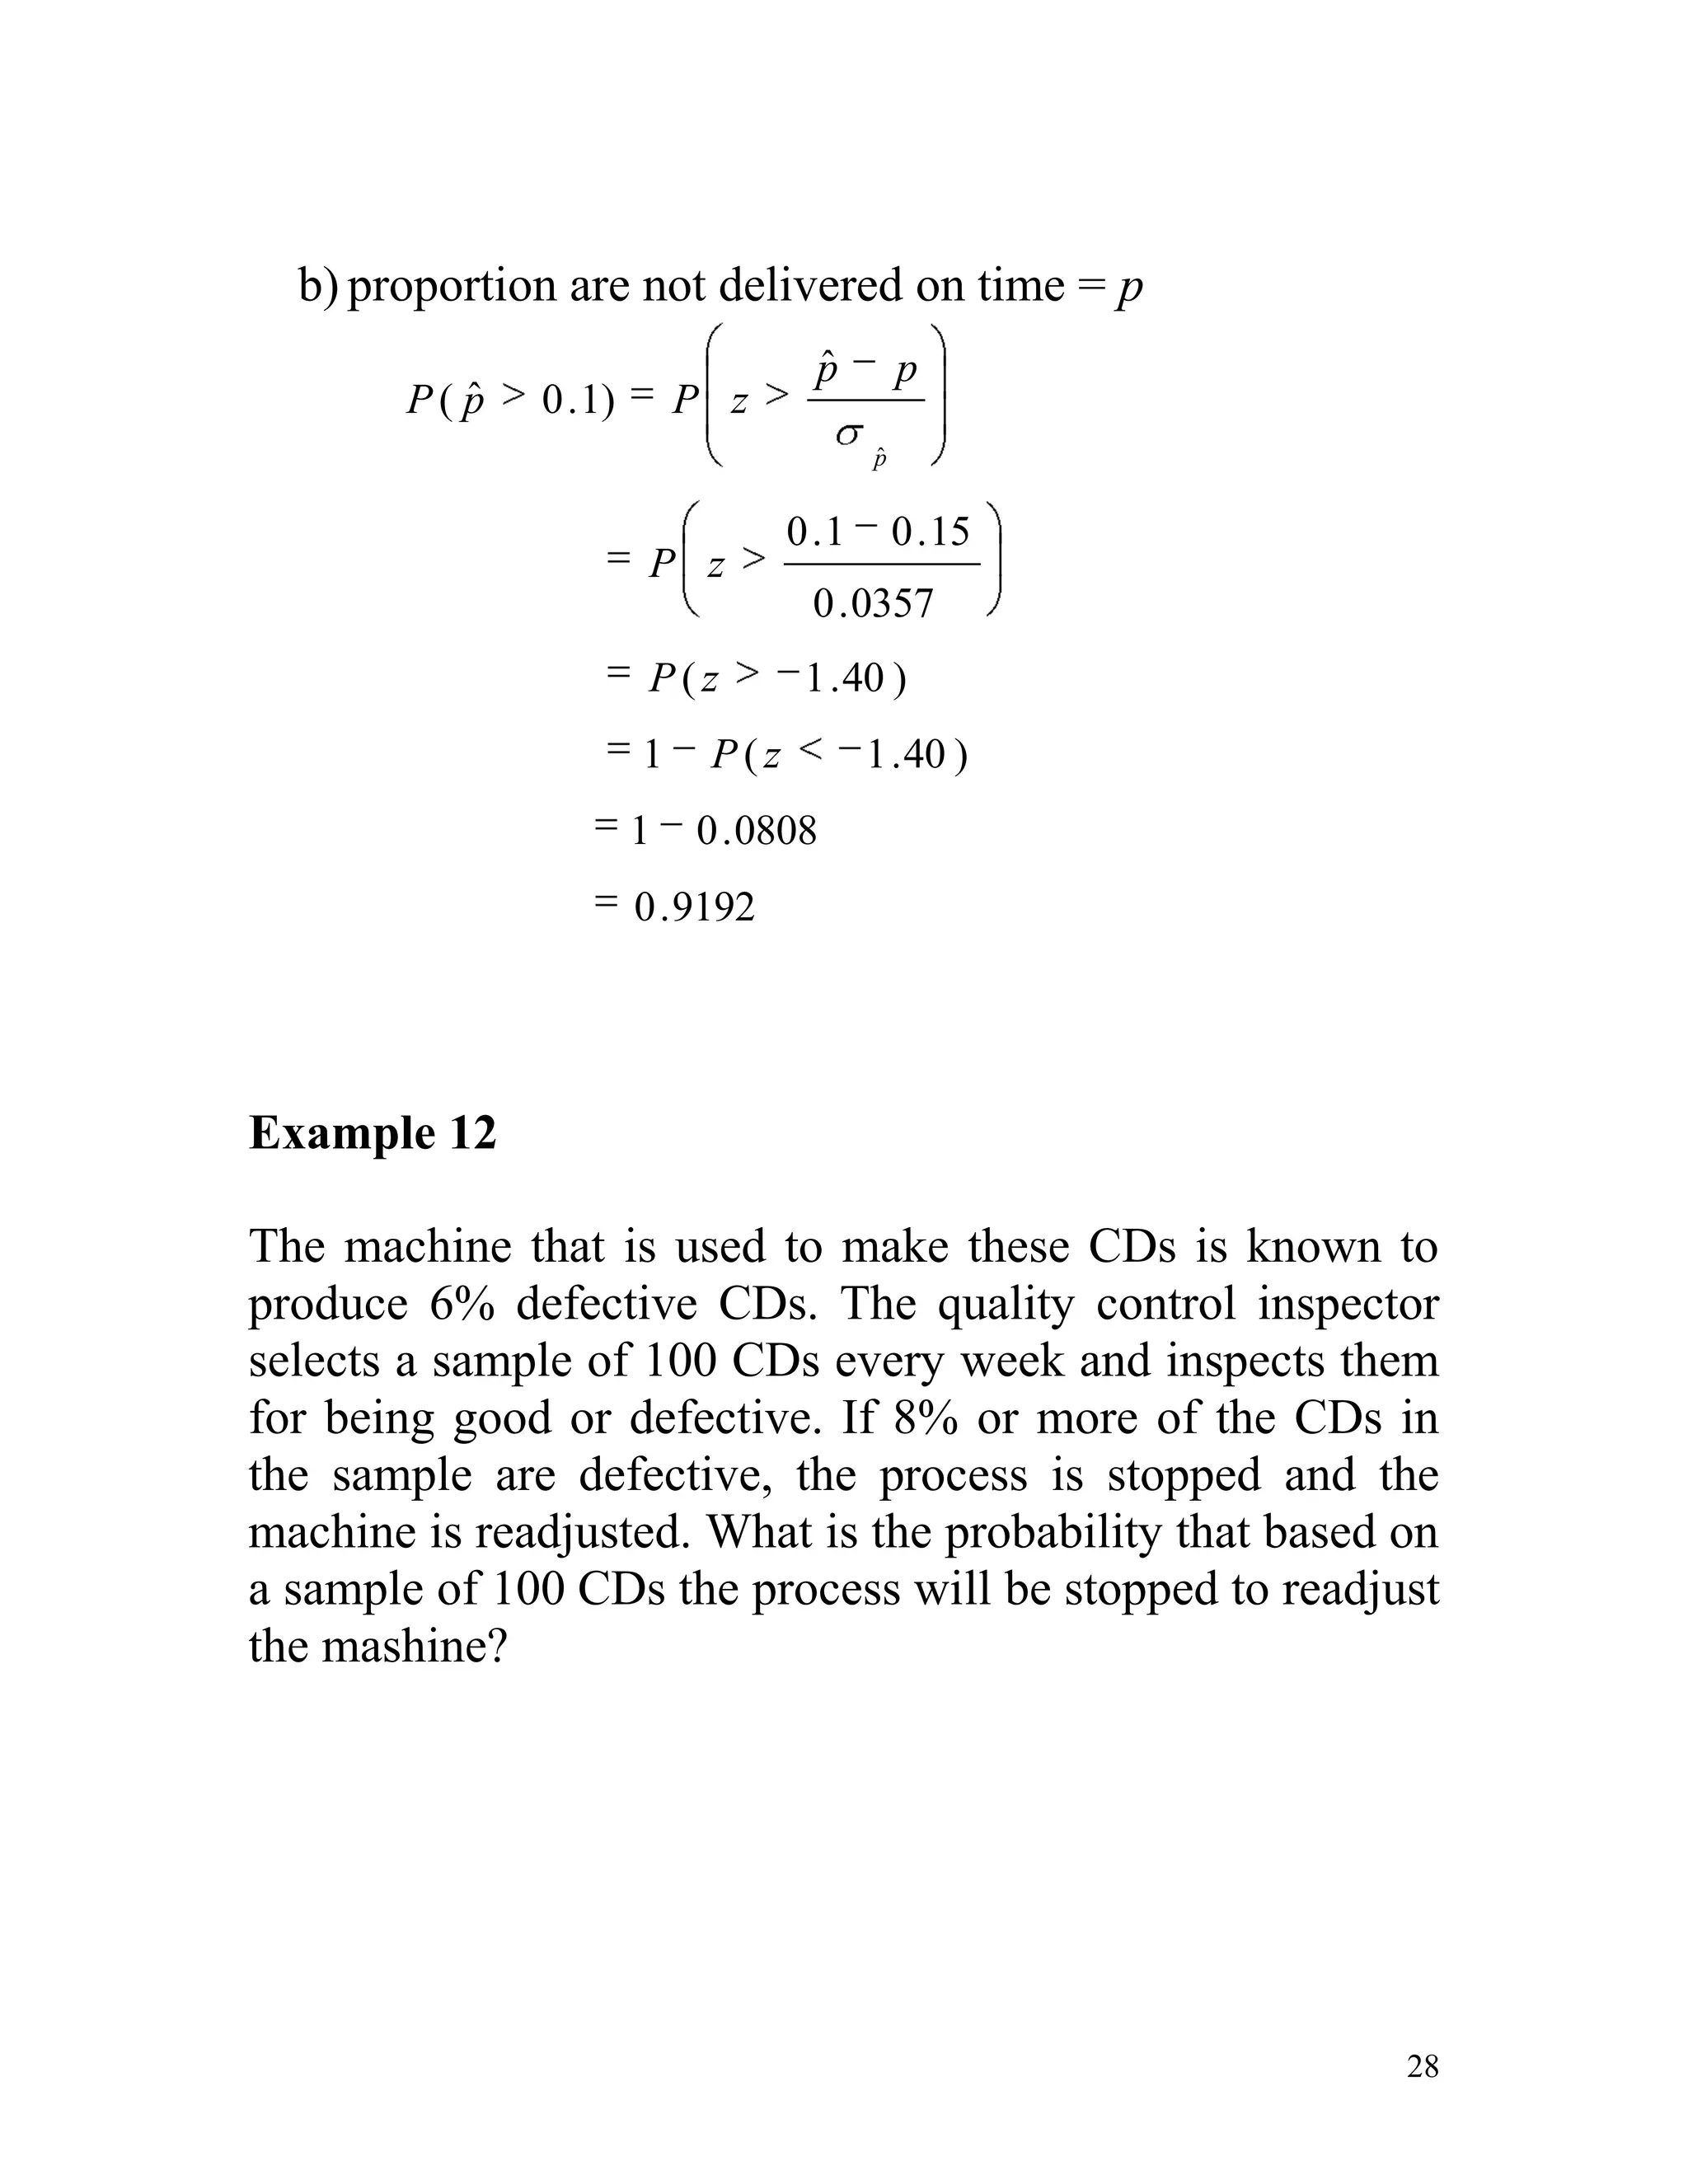
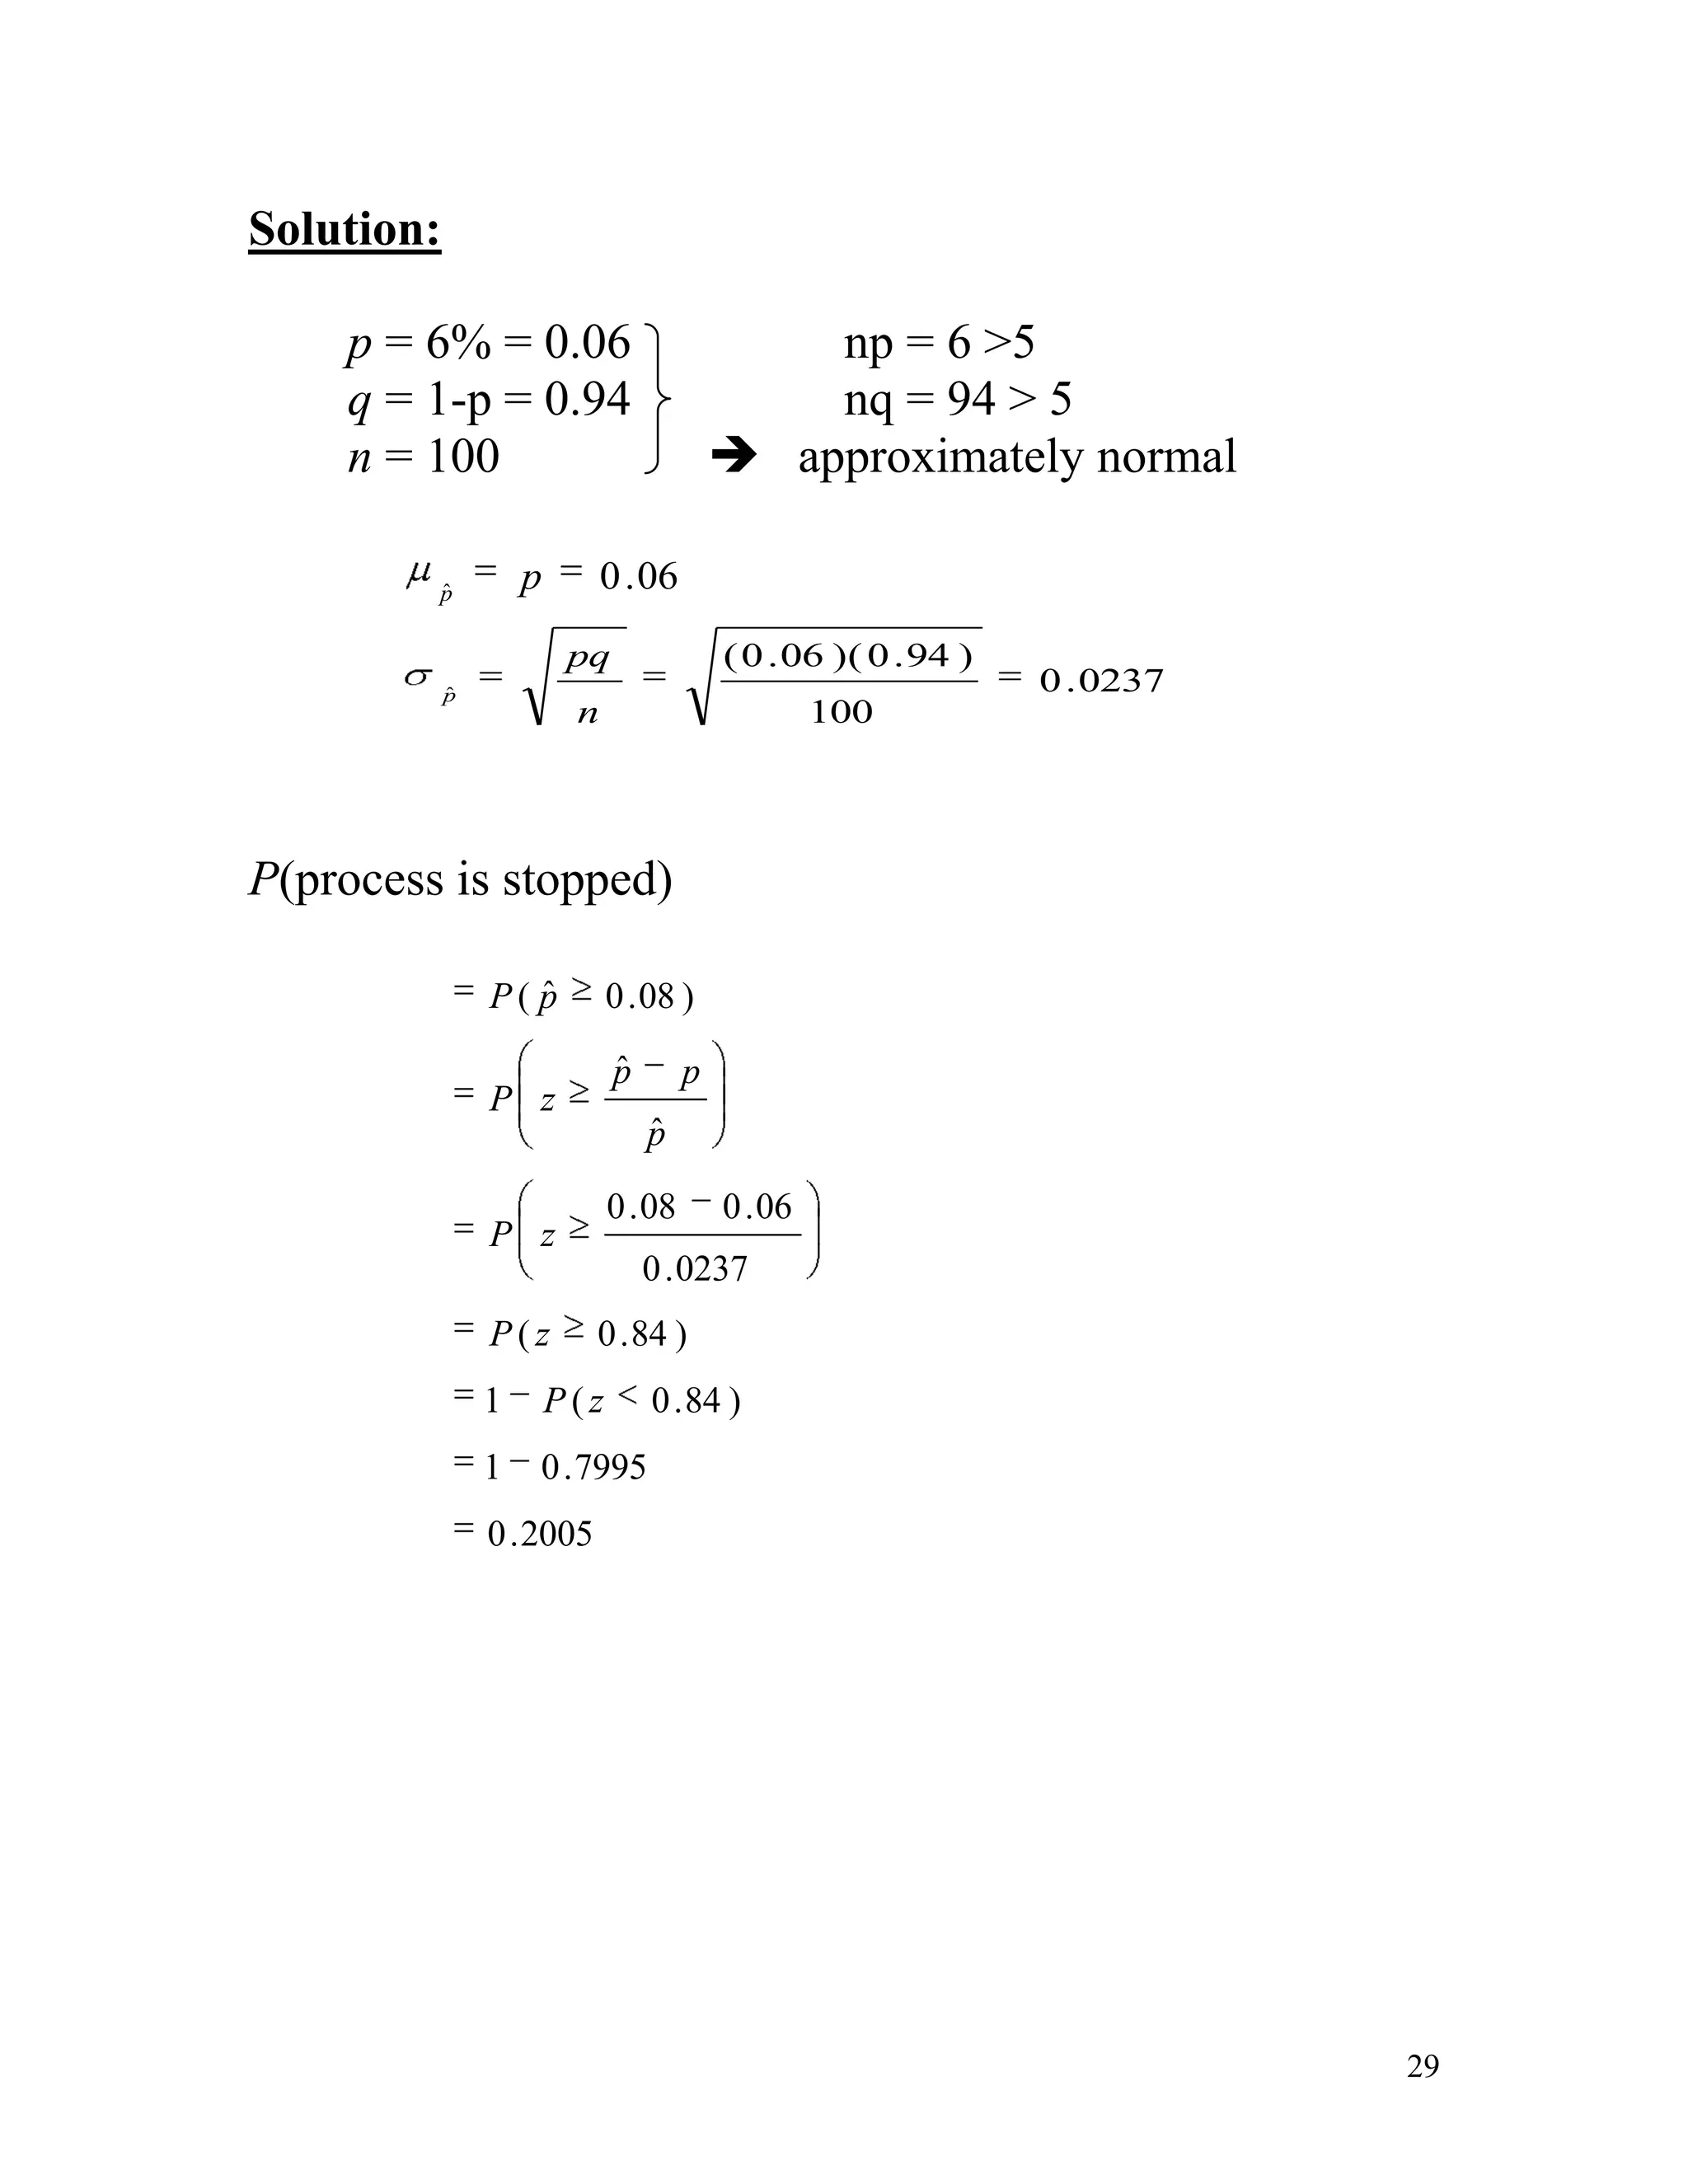
The document discusses sampling distributions and their properties. It defines key terms like population distribution, sampling distribution, sampling error, and sampling distribution of the mean. It presents formulas for calculating the mean and standard deviation of sampling distributions of the mean and proportion. Several examples are provided to demonstrate calculating probabilities related to sampling distributions.
Please Subscribe to this Channel for more solutions and lectures
http://www.youtube.com/onlineteaching
Chapter 7: Estimating Parameters and Determining Sample Sizes
7.3: Estimating a Population Standard Deviation or Variance
Please Subscribe to this Channel for more solutions and lectures
http://www.youtube.com/onlineteaching
Chapter 7: Estimating Parameters and Determining Sample Sizes
7.3: Estimating a Population Standard Deviation or Variance
This ppt will guide the students who want to crack gujarat public service exam (GPSC). This ppt includes reference books,streatagy ,syllabus to pass gpsc exam and very much helpful to friends.
It's a good presentation for those students who just started to learn accounting.
Basic theory of accounting must be clear, and there for here I have uploaded this presentation.
Lecture 5 Sampling distribution of sample mean.pptxshakirRahman10
Objectives:
Distinguish between the distribution of population and distribution of its sample means
Explain the importance of central limit
theorem
Compute and interpret the standard error of the mean.
Sampling distribution of
sample mean:
A population is a collection or a set of measurements of interest to the researcher. For example a researcher may be interested in studying the income of households in Karachi. The measurement of interest is income of each household in Karachi and the population is a list of all households in Karachi and their incomes.
Any subset of the population is called a sample from the population. A sample of ‘n’ measurements selected from a population is said to be a random sample if every different sample of size ‘n’ from the population is equally likelyto be selected.
For the purpose of estimation of certain characteristics in the population we would like to select a random sample to be a good representative of the population.
The set of measurements in the population may be summarized by a descriptive characteristic, called a parameter. In the above example the average income of households would be the parameter.
The set of measurements in a sample may be summarized by a descriptive statistic, called a statistic . For example to estimate the average household income in Karachi, we take a random sample of the population in Karachi. The sample mean is a statistic and is an estimate of the population mean.
Because no one sample is exactly like the next , the sample mean will vary from sample to sample ,and hence is itself a random variable.
Random variables have distribution ,and since the sample mean is a random variable it must have a distribution.
If the sample mean has a normal distribution ,we can compute probabilities for specific events using the properties of the normal distribution.
Consider the population with population mean = μ
and standard deviation = σ.
Next, we take many samples of size n, calculate the mean for each one of them, and create a distribution of the sample means.
This distribution is called the Sampling Distribution of Means.
Technically, a sampling distribution of a statistic is the distribution of values of the statistic in all possible samples of the same size from the same population.
Standard error of the
mean:
The quantity σ is referred to as the standard deviation .it is a measure of spread in the population .
The quality σ/n is referred to as the standard error of the sample mean .It is a measure of spread in the distribution of mean
A very important result of statistics referring to the sampling distribution of the sample mean is the Central Limit Theorem .
Central Limit Theorem:
Consider a population with finite mean and standard deviation . If random samples of n measurements are repeatedly drawn from the population then, when n is large, the relative frequency histogram for the sample means ( calculated from repeated samples)
Chapter 5 part2- Sampling Distributions for Counts and Proportions (Binomial ...nszakir
Mathematics, Statistics, Sampling Distributions for Counts and Proportions, Binomial Distributions for Sample Counts,
Binomial Distributions in Statistical Sampling, Binomial Mean and Standard Deviation, Sample Proportions, Normal Approximation for Counts and Proportions, Binomial Formula
This presentation includes topics related to sampling and its distributions, estimates related to large samples and small samples using Z test and T test respectively. Also when to use Finite Population Multiplier is explained in detail.
Unit 8 - Information and Communication Technology (Paper I).pdfThiyagu K
This slides describes the basic concepts of ICT, basics of Email, Emerging Technology and Digital Initiatives in Education. This presentations aligns with the UGC Paper I syllabus.
Synthetic Fiber Construction in lab .pptxPavel ( NSTU)
Synthetic fiber production is a fascinating and complex field that blends chemistry, engineering, and environmental science. By understanding these aspects, students can gain a comprehensive view of synthetic fiber production, its impact on society and the environment, and the potential for future innovations. Synthetic fibers play a crucial role in modern society, impacting various aspects of daily life, industry, and the environment. ynthetic fibers are integral to modern life, offering a range of benefits from cost-effectiveness and versatility to innovative applications and performance characteristics. While they pose environmental challenges, ongoing research and development aim to create more sustainable and eco-friendly alternatives. Understanding the importance of synthetic fibers helps in appreciating their role in the economy, industry, and daily life, while also emphasizing the need for sustainable practices and innovation.
Honest Reviews of Tim Han LMA Course Program.pptxtimhan337
Personal development courses are widely available today, with each one promising life-changing outcomes. Tim Han’s Life Mastery Achievers (LMA) Course has drawn a lot of interest. In addition to offering my frank assessment of Success Insider’s LMA Course, this piece examines the course’s effects via a variety of Tim Han LMA course reviews and Success Insider comments.
Introduction to AI for Nonprofits with Tapp NetworkTechSoup
Dive into the world of AI! Experts Jon Hill and Tareq Monaur will guide you through AI's role in enhancing nonprofit websites and basic marketing strategies, making it easy to understand and apply.
A Strategic Approach: GenAI in EducationPeter Windle
Artificial Intelligence (AI) technologies such as Generative AI, Image Generators and Large Language Models have had a dramatic impact on teaching, learning and assessment over the past 18 months. The most immediate threat AI posed was to Academic Integrity with Higher Education Institutes (HEIs) focusing their efforts on combating the use of GenAI in assessment. Guidelines were developed for staff and students, policies put in place too. Innovative educators have forged paths in the use of Generative AI for teaching, learning and assessments leading to pockets of transformation springing up across HEIs, often with little or no top-down guidance, support or direction.
This Gasta posits a strategic approach to integrating AI into HEIs to prepare staff, students and the curriculum for an evolving world and workplace. We will highlight the advantages of working with these technologies beyond the realm of teaching, learning and assessment by considering prompt engineering skills, industry impact, curriculum changes, and the need for staff upskilling. In contrast, not engaging strategically with Generative AI poses risks, including falling behind peers, missed opportunities and failing to ensure our graduates remain employable. The rapid evolution of AI technologies necessitates a proactive and strategic approach if we are to remain relevant.
Operation “Blue Star” is the only event in the history of Independent India where the state went into war with its own people. Even after about 40 years it is not clear if it was culmination of states anger over people of the region, a political game of power or start of dictatorial chapter in the democratic setup.
The people of Punjab felt alienated from main stream due to denial of their just demands during a long democratic struggle since independence. As it happen all over the word, it led to militant struggle with great loss of lives of military, police and civilian personnel. Killing of Indira Gandhi and massacre of innocent Sikhs in Delhi and other India cities was also associated with this movement.
June 3, 2024 Anti-Semitism Letter Sent to MIT President Kornbluth and MIT Cor...Levi Shapiro
Letter from the Congress of the United States regarding Anti-Semitism sent June 3rd to MIT President Sally Kornbluth, MIT Corp Chair, Mark Gorenberg
Dear Dr. Kornbluth and Mr. Gorenberg,
The US House of Representatives is deeply concerned by ongoing and pervasive acts of antisemitic
harassment and intimidation at the Massachusetts Institute of Technology (MIT). Failing to act decisively to ensure a safe learning environment for all students would be a grave dereliction of your responsibilities as President of MIT and Chair of the MIT Corporation.
This Congress will not stand idly by and allow an environment hostile to Jewish students to persist. The House believes that your institution is in violation of Title VI of the Civil Rights Act, and the inability or
unwillingness to rectify this violation through action requires accountability.
Postsecondary education is a unique opportunity for students to learn and have their ideas and beliefs challenged. However, universities receiving hundreds of millions of federal funds annually have denied
students that opportunity and have been hijacked to become venues for the promotion of terrorism, antisemitic harassment and intimidation, unlawful encampments, and in some cases, assaults and riots.
The House of Representatives will not countenance the use of federal funds to indoctrinate students into hateful, antisemitic, anti-American supporters of terrorism. Investigations into campus antisemitism by the Committee on Education and the Workforce and the Committee on Ways and Means have been expanded into a Congress-wide probe across all relevant jurisdictions to address this national crisis. The undersigned Committees will conduct oversight into the use of federal funds at MIT and its learning environment under authorities granted to each Committee.
• The Committee on Education and the Workforce has been investigating your institution since December 7, 2023. The Committee has broad jurisdiction over postsecondary education, including its compliance with Title VI of the Civil Rights Act, campus safety concerns over disruptions to the learning environment, and the awarding of federal student aid under the Higher Education Act.
• The Committee on Oversight and Accountability is investigating the sources of funding and other support flowing to groups espousing pro-Hamas propaganda and engaged in antisemitic harassment and intimidation of students. The Committee on Oversight and Accountability is the principal oversight committee of the US House of Representatives and has broad authority to investigate “any matter” at “any time” under House Rule X.
• The Committee on Ways and Means has been investigating several universities since November 15, 2023, when the Committee held a hearing entitled From Ivory Towers to Dark Corners: Investigating the Nexus Between Antisemitism, Tax-Exempt Universities, and Terror Financing. The Committee followed the hearing with letters to those institutions on January 10, 202
Model Attribute Check Company Auto PropertyCeline George
In Odoo, the multi-company feature allows you to manage multiple companies within a single Odoo database instance. Each company can have its own configurations while still sharing common resources such as products, customers, and suppliers.
Digital Artifact 2 - Investigating Pavilion Designs
Statistik Chapter 6
1. CHAPTER 6 SAMPLING DISTRIBUTION OBJECTIVES: After completing this chapter, student should be able to: Form a sampling distribution for a mean and proportion based on a small, finite population. Understand that a sampling distribution is a probability distribution for a sample statistic. Present and describe the sampling distribution of sample means and the central limit theorem. Explain the relationship between the sampling distributions with the central limit theorem. Compute, describe and interpret z-scores corresponding to known values of Compute z-scores and probabilities for applications of the sampling distribution of sample means and sample proportions. 1.0POPULATION AND SAMPLING DISTRIBUTION 1.1Population Distribution Definition: The probability distribution of the population data. Example 1: Suppose there are only five students in an advanced statistics class and the midterm scores of these five students are: 7078808095 Let x denote the score of a student. Mean for Population: Standard Deviation for Population: 1.2Sampling Distribution Definition: The probability distribution of a sample statistic. Sample statistic such as median, mode, mean and standard deviation 1.2.1Sampling Distribution of Mean Sample Definition: The sampling distribution of is a distribution obtained by using the means computed from random samples of a specific size taken from a population. Example 2: Reconsider the population of midterm scores of five students given in example 1. Let say we draw all possible samples of three numbers each and compute the mean. Total number of samples = 5C3 = Suppose we assign the letters A, B, C, D and E to scores of the five students, so that A = 70,B = 78,C=80,D = 80, E = 95 Then the 10 possible samples of three scores each are ABC, ABD, ABE, ACD, ACE, ADE, BCD, BCE, BDE, CDE Sampling Error Sampling error is the difference between the value of a sample statistic and the value of the corresponding population parameter. In the case of mean, Sampling error = Mean () for the Sampling Distribution of: Based on example 2, “The mean of the sampling distribution of is always equal to the mean of the population” Standard Deviation () for the Sampling Distribution of : Formula 1 where: is the standard deviation of the population n is the sample size This formula is used when Formula 2 When N is the population size where is the finite population correction factor This formula is used when The spread of the sampling distribution of is smaller than the spread of the corresponding population distribution, . The standard deviation of the sampling distribution of decreases as the sample size increase. The standard deviation of the sample means is called the standard error of the mean. Sampling from a Normally Distributed Population The shape of the sampling distribution of is normal, whatever the value of n. Shape of the sampling distribution Sampling from a Not Normally Distributed Population Most of the time the population from which the samples are selected is not normally distributed. In such cases, the shape of the sampling distribution of is inferred from central limit theorem. Central limit theorem: for a large sample size, the sampling distribution of is approximately normal, irrespective of the population distribution. the sample size is usually considered to be large if. Shape of the sampling distribution Applications of the Sampling Distribution of The z value for a value of is calculated as: Example 3: In a study of the life expectancy of 500 people in a certain geographic region, the mean age at death was 72 years and the standard deviation was 5.3 years. If a sample of 50 people from this region is selected, find the probability that the mean life expectancy will be less than 70 years. Solution: need correction factor Example 4: Assume that the weights of all packages of a certain brand of cookies are normally distributed with a mean of 32 ounces and a standard deviation of 0.3 ounce. Find the probability that the mean weight,of a random sample of 20 packages of this brand of cookies will be between 31.8 and 31.9 ounces. Solution: Although the sample size is small (), the shape of the sampling distribution of is normal because the population is normally distributed. 57150047625Example 5: A Bulletin reported that children between the ages of 2 and 5 watch an average of 25 hours of television per week. Assume the variable is normally distributed and the standard deviation is 3 hours. If 20 children between the ages of 2 and 5 are randomly selected, find the probability that the mean of the number of hours they watch television will be: greater than 26.3 hours. less than 24 hours between 24 and 26.3 hours. Solution: greater than 26.3 hours less than 24 hours between 24 and 26.3 hours OR Remember!Sometimes you have difficulty deciding whether to use or The formula should be used to gain information about a sample mean. The formula is used to gain information about an individual data value obtained from the population. Example 6: The average number of pounds of meat that a person consumes a year is 218.4 pounds. Assume that the standard deviation is 25 pounds and the distribution is approximately normal. Find the probability that a person selected at random consumes less than 224 pounds per year. If a sample of 40 individuals selected, find the probability that the mean of the sample will be less than 224 pounds per year. Solution: The question asks about an individual person . , The question concerns the mean of a sample with a size of 40 , POPULATION AND SAMPLE PROPORTIONS Formula for: Population proportionSample proportion Where N = total number of element in the population n = total number of element in the sample X = number of element in the population that possess a specific characteristic x = number of element in the sample that possess a specific characteristic Example 7 Suppose a total of 789 654 families live in a city and 563 282 of them own homes. A sample of 240 families is selected from the city and 158 of them own homes. Find the proportion of families who own homes in the population and in the sample. Solution: The proportion of all families in this city who own homes is The sample proportion is 2.1Sampling Distribution of Example 8 Boe Consultant Associates has five employees. Table below gives the names of these five employees and information concerning their knowledge of statistics. Where: p = population proportion of employees who know statistics Let say we draw all possible samples of three employees each and compute the proportion. Total number of samples = 5C3 = Mean of the sample proportion: Standard deviation of the sample proportion: If , then use formula If , then use formula where p = population proportion q = 1 – p n = sample size Example 9 Based on example Boe Consultant Associates, Shape of the sampling distribution of According to the central limit theorem, the sampling distribution of is approximately normal for a sufficiently large sample size. In the case of proportion, the sample size is considered to be sufficiently large if np > 5 and nq > 5 Example 10 A binomial distribution has p = 0.3. How large must sample size be such that a normal distribution can be used to approximate sampling distribution of . Solution: 2.2Applications Of The Sampling Distribution of z value for a value of Example 11: The Dartmouth Distribution Warehouse makes deliveries of a large number of products to its customers. It is known that 85% of all the orders it receives from its customers are delivered on time. Find the probability that the proportion of orders in a random sample of 100 are delivered on time: less than 0.87 between 0.81 and 0.88 Find the probability that the proportion of orders in a random sample of 100 are not delivered on time greater than 0.1. Solution: p = 85% = 0.85 np = 85 >5 q = 1-p = 0.15nq = 15 > 5 n = 100 approximately normal i. ii. proportion are not delivered on time = p Example 12 The machine that is used to make these CDs is known to produce 6% defective CDs. The quality control inspector selects a sample of 100 CDs every week and inspects them for being good or defective. If 8% or more of the CDs in the sample are defective, the process is stopped and the machine is readjusted. What is the probability that based on a sample of 100 CDs the process will be stopped to readjust the mashine? Solution: p = 6% = 0.06 np = 6 >5 q = 1-p = 0.94nq = 94 > 5 n = 100 approximately normal P(process is stopped) EXERCISES Given a population with mean, µ = 400 and standard deviation, σ = 60. If the population is normally distributed, what is the shape for the sampling distribution of sample mean with random sample size of 16 If we do not know the shape of the population in 1(a), Can we answer 1(a)? Explain. Can we answer 1(a) if we do not know the population distribution but we have been given random sample with size 36? Explain. A random sample with size, n = 30, is obtained from a normal distribution population with µ = 13 and s = 7. What are the mean and the standard deviation for the sampling distribution of sample mean. What is the shape of the sampling distribution? Explain. Calculate ¯¯¯P ( x < 10) P ( x < 19) P ( x < 16) Given a population size of 5000 with standard deviation 25, Calculate the standard error of mean sample for: n = 300 n = 100 XGiven X ~ N (5.55, 1.32). If a sample size of 50 is randomly selected, find the sampling distribution for ¯. (Hint: Give the name of distribution, mean and variance).Then, Calculate: P ( 5.25 ≤ X ≤ 5.90) P (5.45 ≤ X ≤ 5.75) XXX Given ¯ ~ N (5, 16). Find the value of: P ( ¯ > 3) P( -4 < ¯ < 4) 64 units from a population size of 125 is randomly selected with mean 105 and variance 289, Find: Xthe standard error of the sampling distribution above P( -4 < ¯ < 4) The serving time for clerk at the bank counter is normally distributed with mean 8 minutes and standard deviation 2 minutes. If 36 customers is randomly selected: ¯a) Calculate σx b) The probability that the mean of serving time of a clerk at the bank counter is between 7.7 minutes and 8.3 minutes The workers at the walkie-talkie factory received salary at an average of RM3.70 per hour and the standard deviation is RM0.80. If a sample of 100 is randomly selected, find the probability the mean of sample is: at least RM 3.50 per hour between RM 3.20 and R3.60 per hour 1,000 packs of pistachio nut have been sent to one of hyper supermarket in Puchong. The weight of pistachio nut packs is normally distributed with mean 99.3g and standard deviation is 1.8g. If a random sample with 300 packs of pistachio nut is selected, find the probability that the mean of the sample will be between 99.2g and 99.5g. Find the probability that mean of sample 300 packs of pistachio nut is between 99.2g and 99.5g with delivery of 2,000 packs 5,000 packs An average age of 1500 staffs Tebrau Co. Limited is 38 years old with standard deviation 6.2 years old. If the company selects 50 staffs at random, Do we need correction factor in this situation? Justify your answer. Find the probability of average age for the group of this staff is between 35 and 40 years old. A research has been conducted by an independent research committee about the efficiency of wire harness, A12-3 production at the P.Tex Industries Sdn. Bhd. An average number of wire harness that has been produced a day is 60 pieces with standard deviation 10. A random sample of 90 pieces of wire harness is selected. Find mean and standard error for the wire harness that has been produced a day. Find the probability of wire harness that can be produced in a day is between 58 pieces and 62 pieces. A test of string breaking strength that has been produced by Z factory shows that the strength of string is only 60%. A random sample of 200 pieces of string is selected for the test. State the shape of sampling distribution Calculate the probability of string strength is at lest 42% Mr. Jay is a teacher at the Henry Garden School. He has conducted a research about bully case at his school. 61.6% students said that they are ever being a bully victim. A random sample of 200 students is selected at random. Find the proportion of bully victim is between 60% and 66% more than 64% The information given below shows the response of 40 college students for the question, “Do you work during semester break time?” (The answer is Y=Yes or N=No). N N Y N N Y N Y N Y N N Y N Y Y N N N Y N Y N N N N Y N N Y Y N N N Y N N Y N N If the proportion fo population is 0.30, Find the proportion of sampling for the college student who works during semester break. Calculate the standard error for the proportion in (a). A credit officer at the Tiger Bank believes that 25% from the total credit card users will not pay their minimum charge of credit card debt at the end of every month. If a sample 100 credit card user is randomly selected: What is the standard error for the proportion of the customer who does not pay their minimum charge of credit card debt at the end of every month? Find the probability that the proportion of customer in a random sample of 100 do not pay their minimum charge of credit card debt: less than 0.20 more than 0.30 What is the consequence of the incremental in population size toward the probability value on the 6(b)?