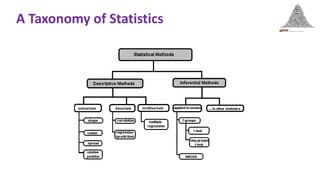
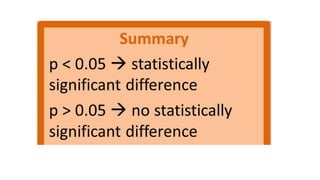
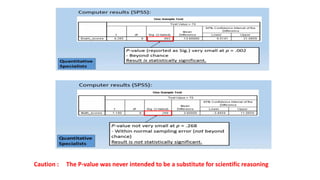
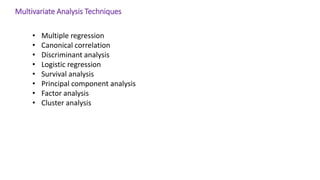
Statistical Methods in Research
Dr Kiran Gaur
Associate Professor & Head
Department of Statistics, Mathematics & Computer Science
SKN Colloge of Agriculture, Jobner
Statistics
Descriptive statistics – Methods of organizing, summarizing, and
presenting data in an informative way
Inferential statistics – The methods used to determine something about a
population on the basis of a sample
Inference is the process of drawing conclusions or making decisions
about a population based on sample results
Types of variables
Variables
Quantitative
Qualitative
Dichotomic Polynomic Discrete Continuous
Gender, marital
status
Brand of Pc, hair
color
Children in family,
Strokes on a golf
hole
Amount of income
tax paid, weight of a
student
Types of Measurement Scale
Nominal Scale
Colour, Region , gender etc.
Ordinal Scale
Size, grades, SEB etc.
Interval Scale
Temperature, certain size measurement etc.
Ratio Scale
Height, weight, income etc.
Frequency distribution
The frequency with which observations are assigned to each category
or point on a measurement scale.
Most basic form of descriptive statistics
May be expressed as a percentage of the total sample found in
each category
The distribution is “read” differently depending upon the
measurement level
Nominal scales are read as discrete measurements at each level
Ordinal measures show tendencies, but categories should not be
compared
Interval and ratio scales allow for comparison among categories
Cross Tabulation
Chart Guide
Commonly Used Graphs in Business Research
A Taxonomy of Statistics
11
Central Tendency
• Statistical measure that determines a single value that accurately describes
the center of the distribution and represents the entire distribution of
scores.
• By identifying the "average score," central tendency allows
researchers to summarize or condense a large set of data into a single
value.
• In addition, it is possible to compare two (or more) sets of data by
simply comparing the average score (central tendency) for one set
versus the average score for another set.
Measures of central tendency
• These measures give us an idea what the ‘typical’ case in a distribution
• Mean-
• The ‘average’ score—sum of all individual scores divided by the number of scores
• Has a number of useful statistical properties
however, can be sensitive to extreme scores (“outliers”)
• many statistics are based on the mean
• Mode - the most frequent score in a distribution
• good for nominal data
• Median - the midpoint or mid score in a distribution.
• 50% cases above/50% cases below
insensitive to extreme cases
Ordinal or ratio
0
20
40
60
80
100
120
140
160
1
q1
min
median
max
q3
Box- Plot Chart
Dispersion
• Some statistics look at how widely scattered over the scale the
individual scores are
• Groups with identical means can be more or less widely dispersed
• To find out how the group is distributed, we need to know how far
from or close to the mean individual scores are
• Like the mean, these statistics are only meaningful for interval or
ratio-level measures
Estimates of Dispersion
• Range
• Distance between the highest and lowest scores in a distribution;
• sensitive to extreme scores;
• Can compensate by calculating inter quartile range (distance between the 25th and 75th
percentile points) which represents the range of scores for the middle half of a
distribution
Variance (S2)
• Average of squared distances of individual points from the mean
• sample variance
• High variance means that most scores are far away from the mean. Low variance
indicates that most scores cluster tightly about the mean.
• The amount that one score differs from the mean is called its deviation score
(deviate)
• The sum of all deviation scores in a sample is called the sum of squares
Estimates of dispersion
Standard Deviation (SD)
A summary statistic of how much scores vary from the mean
Square root of the Variance
• expressed in the original units of measurement
• Represents the average amount of dispersion in a sample
• Used in a number of inferential statistics
Measures the peackedness of a distribution;
Leptokurtic (positive excess kurtosis, i.e. fatter tails),
Mesokurtic,
Platykurtic (negative excess kurtosis, i.e. thinner tails),
Skewness:
Kurtosis:
Measures the skewness of a distribution;
Positive or Negative skewness
Shape of the Distribution
Negatively
Skewed
Mode
Median
Mean
Symmetric
(Not Skewed)
Mean
Median
Mode
Positively
Skewed
Mode
Median
Mean
Normal distribution
• Many characteristics are distributed through the
population in a ‘normal’ manner
• Normal curves have well-defined statistical properties
• Parametric statistics are based on the assumption that the
variables are distributed normally
Most commonly used statistics
• This is the famous “Bell curve” where many cases fall near
the middle of the distribution and few fall very high or
very low
I.Q. Distribution
Data Transformation
• With skewed data, the mean is not a good measure of central
tendency because it is sensitive to extreme scores
• May need to transform skewed data to make distribution appear
more normal or symmetrical
• Must determine the degree & type of skewness prior to
transformation
Correlation and Regression
Correlation describes the strength of a linear relationship between two variables
Linear means “straight line”
Measures-
Scatter Plot
Karl Pearson Correlation Coefficient
Spearman’s Rank Correlation
Regression tells us how to draw the straight line described by the correlation.
It is the technique concerned with predicting some variables by knowing others i.e
the process of predicting variable Y using variable X
Multiple regression analysis
Multiple regression analysis is a straight forward extension of simple regression
analysis which allows more than one independent variable.
Y = a + b1X1 + b2X2 + …bkXk ;
The b’s are called partial regression coefficients
Statistical Inference
Use a random sample to learn something about a
larger population
Statistical inference: Drawing conclusions about the whole
population on the basis of a sample
Precondition for statistical inference: A sample is randomly
selected from the population (probability sample)
Hypotheses
The null hypothesis, denoted H0, is the claim that is initially assumed to be true. The alternative hypothesis,
denoted by Ha, is the assertion that is contrary to H0. Possible conclusions from hypothesis-testing analysis are
reject H0 or fail to reject H0.
Rules for Hypotheses
H0 is always stated as an equality claim involving parameters.
Ha is an inequality claim that contradicts H0. It may be one-sided (using either > or <) or two-sided (using ≠).
Steps for Hypothesis Testing
Draw Marketing Research Conclusion
Formulate H0 and H1
Select Appropriate Test
Choose Level of Significance
Determine Prob
Assoc with Test Stat
Determine Critical
Value of Test Stat
TSCR
Determine if TSCR
falls into (Non)
Rejection Region
Compare with Level
of Significance, 
Reject/Do not Reject H0
Calculate Test Statistic TSCAL
Choice of an Appropriate Test
What size sample do We need?
The answer to this question is influenced by a number of factors,viz
➢The purpose of the study
➢Population size
➢The risk of selecting a “bad” sample
➢The allowable sampling error
➢Most of all whether undertaking a qualitative or quantitative study
Different approaches for study designs , such as cross section, case-control, cohort
design, longitudinal study, diagnostics test study etc.
Sample Size Determination
Criteria
➢ Level of confidence ( Normally 95%)
➢ Margin of Error (Usually 1%, 3% or 5%)
➢ Degree of variability in the attributes being measured (Prevalence)
More homogeneous population → Smaller sample size
More heterogeneous population → Large sample size for desired precision.
Sample size
Quantitative Qualitative
n =
Z2
σ2
𝑒 2
n =
(Z2σ2𝑁)
e2 𝑁 − 1 + Z2σ2
n =
Z2𝑃𝑄
e2
n =
(Z2𝑃𝑄𝑁)
e2 𝑁−1 +Z2𝑃𝑄
Infinite
Population
Finite
Population
Sample Size Table
Online Sample Size Calculator
https://www.surveysystem.com/sscalc.htm
https://www.calculator.net/sample-size-calculator
http://www.raosoft.com/samplesize.html
https://www.stat.ubc.ca/~rollin/stats/ssize/n2.html
P-Value
Definition: P-value is the probability of obtaining a sample “more extreme” than
one observed from the sample data, if the null hypothesis is true
Understanding P value
Interpreting P-value
Caution : The P-value was never intended to be a substitute for scientific reasoning
Multivariate Analysis Techniques
• Multiple regression
• Canonical correlation
• Discriminant analysis
• Logistic regression
• Survival analysis
• Principal component analysis
• Factor analysis
• Cluster analysis
Thank You…
“All the statistics in the world can’t measure the warmth of a smile.” Chris Hart

Statistical Methods in Research

  • 2.
    Statistical Methods inResearch Dr Kiran Gaur Associate Professor & Head Department of Statistics, Mathematics & Computer Science SKN Colloge of Agriculture, Jobner
  • 3.
    Statistics Descriptive statistics –Methods of organizing, summarizing, and presenting data in an informative way Inferential statistics – The methods used to determine something about a population on the basis of a sample Inference is the process of drawing conclusions or making decisions about a population based on sample results
  • 4.
    Types of variables Variables Quantitative Qualitative DichotomicPolynomic Discrete Continuous Gender, marital status Brand of Pc, hair color Children in family, Strokes on a golf hole Amount of income tax paid, weight of a student
  • 5.
    Types of MeasurementScale Nominal Scale Colour, Region , gender etc. Ordinal Scale Size, grades, SEB etc. Interval Scale Temperature, certain size measurement etc. Ratio Scale Height, weight, income etc.
  • 6.
    Frequency distribution The frequencywith which observations are assigned to each category or point on a measurement scale. Most basic form of descriptive statistics May be expressed as a percentage of the total sample found in each category The distribution is “read” differently depending upon the measurement level Nominal scales are read as discrete measurements at each level Ordinal measures show tendencies, but categories should not be compared Interval and ratio scales allow for comparison among categories
  • 7.
  • 8.
  • 9.
    Commonly Used Graphsin Business Research
  • 10.
    A Taxonomy ofStatistics
  • 11.
    11 Central Tendency • Statisticalmeasure that determines a single value that accurately describes the center of the distribution and represents the entire distribution of scores. • By identifying the "average score," central tendency allows researchers to summarize or condense a large set of data into a single value. • In addition, it is possible to compare two (or more) sets of data by simply comparing the average score (central tendency) for one set versus the average score for another set.
  • 12.
    Measures of centraltendency • These measures give us an idea what the ‘typical’ case in a distribution • Mean- • The ‘average’ score—sum of all individual scores divided by the number of scores • Has a number of useful statistical properties however, can be sensitive to extreme scores (“outliers”) • many statistics are based on the mean • Mode - the most frequent score in a distribution • good for nominal data • Median - the midpoint or mid score in a distribution. • 50% cases above/50% cases below insensitive to extreme cases Ordinal or ratio
  • 13.
  • 14.
    Dispersion • Some statisticslook at how widely scattered over the scale the individual scores are • Groups with identical means can be more or less widely dispersed • To find out how the group is distributed, we need to know how far from or close to the mean individual scores are • Like the mean, these statistics are only meaningful for interval or ratio-level measures
  • 15.
    Estimates of Dispersion •Range • Distance between the highest and lowest scores in a distribution; • sensitive to extreme scores; • Can compensate by calculating inter quartile range (distance between the 25th and 75th percentile points) which represents the range of scores for the middle half of a distribution
  • 16.
    Variance (S2) • Averageof squared distances of individual points from the mean • sample variance • High variance means that most scores are far away from the mean. Low variance indicates that most scores cluster tightly about the mean. • The amount that one score differs from the mean is called its deviation score (deviate) • The sum of all deviation scores in a sample is called the sum of squares Estimates of dispersion Standard Deviation (SD) A summary statistic of how much scores vary from the mean Square root of the Variance • expressed in the original units of measurement • Represents the average amount of dispersion in a sample • Used in a number of inferential statistics
  • 17.
    Measures the peackednessof a distribution; Leptokurtic (positive excess kurtosis, i.e. fatter tails), Mesokurtic, Platykurtic (negative excess kurtosis, i.e. thinner tails), Skewness: Kurtosis: Measures the skewness of a distribution; Positive or Negative skewness Shape of the Distribution
  • 18.
  • 19.
    Normal distribution • Manycharacteristics are distributed through the population in a ‘normal’ manner • Normal curves have well-defined statistical properties • Parametric statistics are based on the assumption that the variables are distributed normally Most commonly used statistics • This is the famous “Bell curve” where many cases fall near the middle of the distribution and few fall very high or very low
  • 20.
  • 21.
    Data Transformation • Withskewed data, the mean is not a good measure of central tendency because it is sensitive to extreme scores • May need to transform skewed data to make distribution appear more normal or symmetrical • Must determine the degree & type of skewness prior to transformation
  • 22.
    Correlation and Regression Correlationdescribes the strength of a linear relationship between two variables Linear means “straight line” Measures- Scatter Plot Karl Pearson Correlation Coefficient Spearman’s Rank Correlation
  • 24.
    Regression tells ushow to draw the straight line described by the correlation. It is the technique concerned with predicting some variables by knowing others i.e the process of predicting variable Y using variable X
  • 26.
    Multiple regression analysis Multipleregression analysis is a straight forward extension of simple regression analysis which allows more than one independent variable. Y = a + b1X1 + b2X2 + …bkXk ; The b’s are called partial regression coefficients
  • 27.
    Statistical Inference Use arandom sample to learn something about a larger population Statistical inference: Drawing conclusions about the whole population on the basis of a sample Precondition for statistical inference: A sample is randomly selected from the population (probability sample)
  • 28.
    Hypotheses The null hypothesis,denoted H0, is the claim that is initially assumed to be true. The alternative hypothesis, denoted by Ha, is the assertion that is contrary to H0. Possible conclusions from hypothesis-testing analysis are reject H0 or fail to reject H0. Rules for Hypotheses H0 is always stated as an equality claim involving parameters. Ha is an inequality claim that contradicts H0. It may be one-sided (using either > or <) or two-sided (using ≠).
  • 29.
    Steps for HypothesisTesting Draw Marketing Research Conclusion Formulate H0 and H1 Select Appropriate Test Choose Level of Significance Determine Prob Assoc with Test Stat Determine Critical Value of Test Stat TSCR Determine if TSCR falls into (Non) Rejection Region Compare with Level of Significance,  Reject/Do not Reject H0 Calculate Test Statistic TSCAL
  • 30.
    Choice of anAppropriate Test
  • 32.
    What size sampledo We need? The answer to this question is influenced by a number of factors,viz ➢The purpose of the study ➢Population size ➢The risk of selecting a “bad” sample ➢The allowable sampling error ➢Most of all whether undertaking a qualitative or quantitative study Different approaches for study designs , such as cross section, case-control, cohort design, longitudinal study, diagnostics test study etc.
  • 33.
    Sample Size Determination Criteria ➢Level of confidence ( Normally 95%) ➢ Margin of Error (Usually 1%, 3% or 5%) ➢ Degree of variability in the attributes being measured (Prevalence) More homogeneous population → Smaller sample size More heterogeneous population → Large sample size for desired precision.
  • 34.
    Sample size Quantitative Qualitative n= Z2 σ2 𝑒 2 n = (Z2σ2𝑁) e2 𝑁 − 1 + Z2σ2 n = Z2𝑃𝑄 e2 n = (Z2𝑃𝑄𝑁) e2 𝑁−1 +Z2𝑃𝑄 Infinite Population Finite Population
  • 35.
  • 36.
    Online Sample SizeCalculator https://www.surveysystem.com/sscalc.htm https://www.calculator.net/sample-size-calculator http://www.raosoft.com/samplesize.html https://www.stat.ubc.ca/~rollin/stats/ssize/n2.html
  • 37.
    P-Value Definition: P-value isthe probability of obtaining a sample “more extreme” than one observed from the sample data, if the null hypothesis is true
  • 38.
  • 39.
  • 41.
    Caution : TheP-value was never intended to be a substitute for scientific reasoning
  • 42.
    Multivariate Analysis Techniques •Multiple regression • Canonical correlation • Discriminant analysis • Logistic regression • Survival analysis • Principal component analysis • Factor analysis • Cluster analysis
  • 43.
    Thank You… “All thestatistics in the world can’t measure the warmth of a smile.” Chris Hart