Copyright © 2019, 2015, 2012 Pearson Education, Inc.
A L W A Y S L E A R N I N G Slide 1
WELCOME!
GBMT1003
Business Statistics and Research Methods
Copyright © 2019, 2015, 2012 Pearson Education, Inc.
A L W A Y S L E A R N I N G Slide 2
Sampling Distributions
Chapter 7
Copyright © 2019, 2015, 2012 Pearson Education, Inc.
A L W A Y S L E A R N I N G Slide 3
Objectives
In this chapter, you learn:
 The concept of the sampling distribution.
 To compute probabilities related to the sample mean and the
sample proportion.
 The importance of the Central Limit Theorem.
Copyright © 2019, 2015, 2012 Pearson Education, Inc.
A L W A Y S L E A R N I N G Slide 4
Additional Online Topic
 Sampling from Finite Populations: Section 7.4
Sampling Distribution
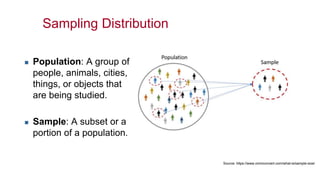
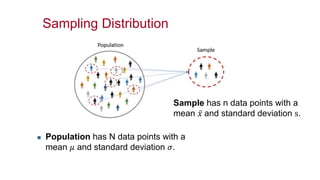
 Population: A group of
people, animals, cities,
things, or objects that
are being studied.
 Sample: A subset or a
portion of a population.
Source: https://www.omniconvert.com/what-is/sample-size/
Sampling Distribution
 Population has N data points with a
mean 𝜇 and standard deviation 𝜎.
Sample has n data points with a
mean 𝑥 and standard deviation s.
Sampling Distribution
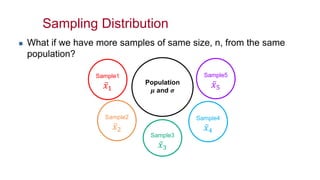
 What if we have more samples of same size, n, from the same
population?
7
Population
𝝁 and 𝝈
Sample5
𝑥5
Sample4
𝑥4
Sample2
𝑥2
Sample1
𝑥1
Sample3
𝑥3
Copyright © 2019, 2015, 2012 Pearson Education, Inc.
A L W A Y S L E A R N I N G Slide 8
Sampling Distribution
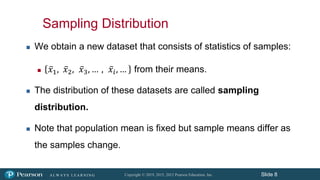
 We obtain a new dataset that consists of statistics of samples:
 𝑥1, 𝑥2, 𝑥3, … , 𝑥𝑖, … from their means.
 The distribution of these datasets are called sampling
distribution.
 Note that population mean is fixed but sample means differ as
the samples change.
Copyright © 2019, 2015, 2012 Pearson Education, Inc.
A L W A Y S L E A R N I N G Slide 9
Sampling Distributions
 A sampling distribution is a distribution of all of the possible values of a
sample statistic for a given sample size selected from a population.
 For example, suppose you sample 50 students from your college
regarding their mean GPA. If you obtained many different samples of
size 50, you would compute a different mean for each sample. We are
interested in the distribution of all potential mean GPAs we might
calculate for samples of 50 students.
Copyright © 2019, 2015, 2012 Pearson Education, Inc.
A L W A Y S L E A R N I N G Slide 10
Developing a Sampling Distribution
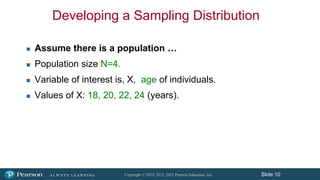
 Assume there is a population …
 Population size N=4.
 Variable of interest is, X, age of individuals.
 Values of X: 18, 20, 22, 24 (years).
Copyright © 2019, 2015, 2012 Pearson Education, Inc.
A L W A Y S L E A R N I N G Slide 11
.3
.2
.1
0
18 20 22 24
A B C D
Uniform Distribution
P(x)
x
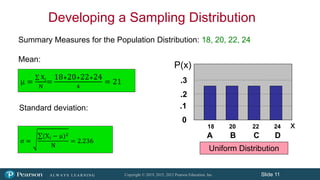
Summary Measures for the Population Distribution: 18, 20, 22, 24
Developing a Sampling Distribution
μ =
Xi
N
=
18+20+22+24
4
= 21
σ =
(Xi − μ)2
N
= 2.236
Mean:
Standard deviation:
Copyright © 2019, 2015, 2012 Pearson Education, Inc.
A L W A Y S L E A R N I N G Slide 12
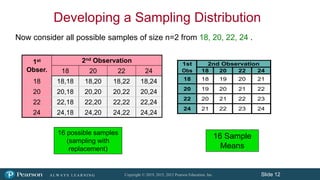
16 possible samples
(sampling with
replacement)
Now consider all possible samples of size n=2 from 18, 20, 22, 24 .
1st 2nd Observation
Obs 18 20 22 24
18 18 19 20 21
20 19 20 21 22
22 20 21 22 23
24 21 22 23 24
Developing a Sampling Distribution
16 Sample
Means
1st
Obser.
2nd Observation
18 20 22 24
18 18,18 18,20 18,22 18,24
20 20,18 20,20 20,22 20,24
22 22,18 22,20 22,22 22,24
24 24,18 24,20 24,22 24,24
Copyright © 2019, 2015, 2012 Pearson Education, Inc.
A L W A Y S L E A R N I N G Slide 13
1st 2nd Observation
Obs 18 20 22 24
18 18 19 20 21
20 19 20 21 22
22 20 21 22 23
24 21 22 23 24
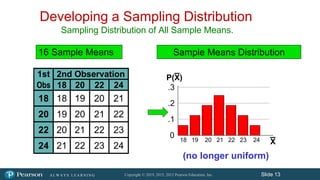
Sampling Distribution of All Sample Means.
18 19 20 21 22 23 24
0
.1
.2
.3
P(X)
X
Sample Means Distribution
16 Sample Means
_
Developing a Sampling Distribution
(no longer uniform)
_
Copyright © 2019, 2015, 2012 Pearson Education, Inc.
A L W A Y S L E A R N I N G Slide 14
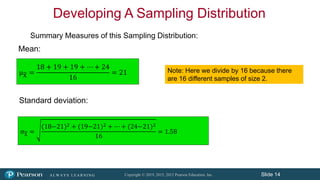
Summary Measures of this Sampling Distribution:
Developing A Sampling Distribution
μX =
18 + 19 + 19 + ⋯ + 24
16
= 21
σX =
(18−21)2 + (19−21)2 + ⋯ + (24−21)2
16
= 1.58
Note: Here we divide by 16 because there
are 16 different samples of size 2.
Mean:
Standard deviation:
Copyright © 2019, 2015, 2012 Pearson Education, Inc.
A L W A Y S L E A R N I N G Slide 15
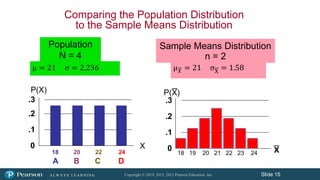
Comparing the Population Distribution
to the Sample Means Distribution
18 19 20 21 22 23 24
0
.1
.2
.3
P(X)
X
18 20 22 24
A B C D
0
.1
.2
.3
Population
N = 4
P(X)
X
_
μ𝑋 = 21 σX = 1.58
μ = 21 σ = 2.236
Sample Means Distribution
n = 2
_
Copyright © 2019, 2015, 2012 Pearson Education, Inc.
A L W A Y S L E A R N I N G Slide 16
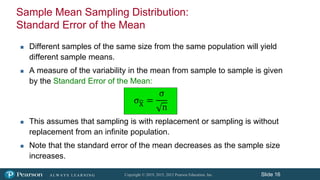
Sample Mean Sampling Distribution:
Standard Error of the Mean
 Different samples of the same size from the same population will yield
different sample means.
 A measure of the variability in the mean from sample to sample is given
by the Standard Error of the Mean:
 This assumes that sampling is with replacement or sampling is without
replacement from an infinite population.
 Note that the standard error of the mean decreases as the sample size
increases.
σX =
σ
n
Copyright © 2019, 2015, 2012 Pearson Education, Inc.
A L W A Y S L E A R N I N G Slide 17
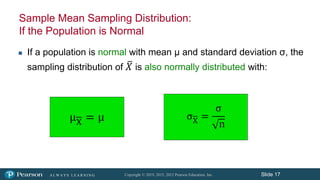
Sample Mean Sampling Distribution:
If the Population is Normal
 If a population is normal with mean μ and standard deviation σ, the
sampling distribution of 𝑋 is also normally distributed with:
μX = μ σX =
σ
n
Copyright © 2019, 2015, 2012 Pearson Education, Inc.
A L W A Y S L E A R N I N G Slide 18
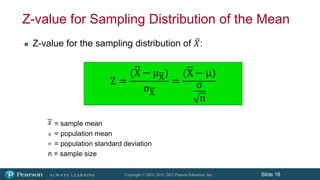
Z-value for Sampling Distribution of the Mean
 Z-value for the sampling distribution of 𝑋:
= sample mean
= population mean
= population standard deviation
n = sample size
𝑋
μ
σ
Z =
(X − μX)
σX
=
(X − μ)
σ
n
Copyright © 2019, 2015, 2012 Pearson Education, Inc.
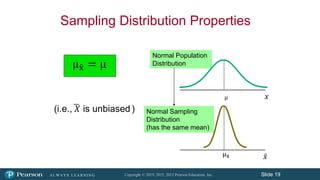
A L W A Y S L E A R N I N G Slide 19
Normal Population
Distribution
Normal Sampling
Distribution
(has the same mean)
Sampling Distribution Properties
(i.e., 𝑋 is unbiased )
𝑥
𝑥
μx = μ
μ
μx
Copyright © 2019, 2015, 2012 Pearson Education, Inc.
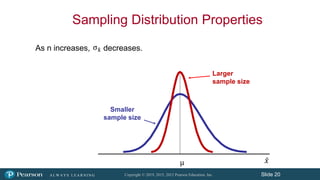
A L W A Y S L E A R N I N G Slide 20
As n increases, decreases.
Sampling Distribution Properties
Larger
sample size
Smaller
sample size
𝑥
σx
μ
Copyright © 2019, 2015, 2012 Pearson Education, Inc.
A L W A Y S L E A R N I N G Slide 21
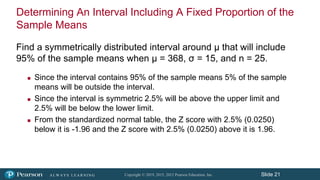
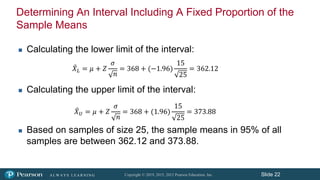
Determining An Interval Including A Fixed Proportion of the
Sample Means
Find a symmetrically distributed interval around µ that will include
95% of the sample means when µ = 368, σ = 15, and n = 25.
 Since the interval contains 95% of the sample means 5% of the sample
means will be outside the interval.
 Since the interval is symmetric 2.5% will be above the upper limit and
2.5% will be below the lower limit.
 From the standardized normal table, the Z score with 2.5% (0.0250)
below it is -1.96 and the Z score with 2.5% (0.0250) above it is 1.96.
Copyright © 2019, 2015, 2012 Pearson Education, Inc.
A L W A Y S L E A R N I N G Slide 22
Determining An Interval Including A Fixed Proportion of the
Sample Means
 Calculating the lower limit of the interval:
 Calculating the upper limit of the interval:
 Based on samples of size 25, the sample means in 95% of all
samples are between 362.12 and 373.88.
𝑋𝐿 = 𝜇 + 𝑍
𝜎
𝑛
= 368 + (−1.96)
15
25
= 362.12
𝑋𝑈 = 𝜇 + 𝑍
𝜎
𝑛
= 368 + (1.96)
15
25
= 373.88
Copyright © 2019, 2015, 2012 Pearson Education, Inc.
A L W A Y S L E A R N I N G Slide 23
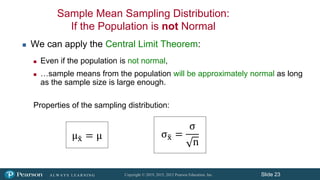
Sample Mean Sampling Distribution:
If the Population is not Normal
 We can apply the Central Limit Theorem:
 Even if the population is not normal,
 …sample means from the population will be approximately normal as long
as the sample size is large enough.
Properties of the sampling distribution:
μx = μ σx =
σ
n
Copyright © 2019, 2015, 2012 Pearson Education, Inc.
A L W A Y S L E A R N I N G Slide 24
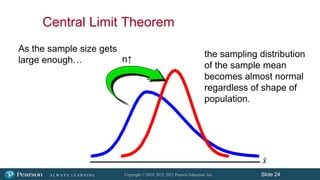
n↑
Central Limit Theorem
As the sample size gets
large enough…
the sampling distribution
of the sample mean
becomes almost normal
regardless of shape of
population.
𝑥
Copyright © 2019, 2015, 2012 Pearson Education, Inc.
A L W A Y S L E A R N I N G Slide 25
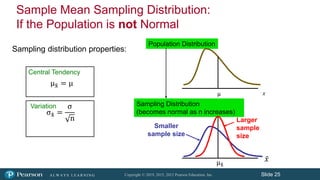
Population Distribution
Sampling Distribution
(becomes normal as n increases)
Central Tendency
Variation
𝑥
𝑥
Larger
sample
size
Smaller
sample size
Sample Mean Sampling Distribution:
If the Population is not Normal
Sampling distribution properties:
μx = μ
σx =
σ
n
μx
μ
Copyright © 2019, 2015, 2012 Pearson Education, Inc.
A L W A Y S L E A R N I N G Slide 26
How Large is Large Enough?
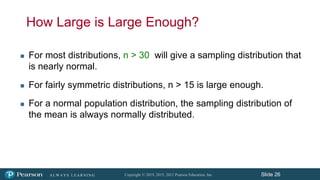
 For most distributions, n > 30 will give a sampling distribution that
is nearly normal.
 For fairly symmetric distributions, n > 15 is large enough.
 For a normal population distribution, the sampling distribution of
the mean is always normally distributed.
Copyright © 2019, 2015, 2012 Pearson Education, Inc.
A L W A Y S L E A R N I N G Slide 27
Example
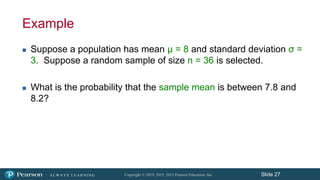
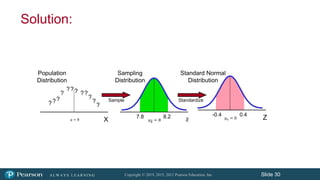
 Suppose a population has mean μ = 8 and standard deviation σ =
3. Suppose a random sample of size n = 36 is selected.
 What is the probability that the sample mean is between 7.8 and
8.2?
Copyright © 2019, 2015, 2012 Pearson Education, Inc.
A L W A Y S L E A R N I N G Slide 28
Solution:
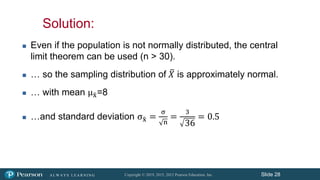
 Even if the population is not normally distributed, the central
limit theorem can be used (n > 30).
 … so the sampling distribution of 𝑋 is approximately normal.
 … with mean μx=8
 …and standard deviation σx =
σ
n
=
3
36
= 0.5
Copyright © 2019, 2015, 2012 Pearson Education, Inc.
A L W A Y S L E A R N I N G Slide 29
Solution:
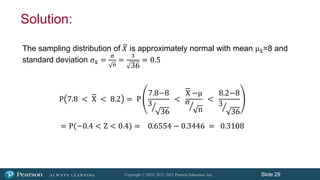
P 7.8 < X < 8.2 = P
7.8−8
3
36
<
X −μ
σ
n
<
8.2−8
3
36
= P(−0.4 < Z < 0.4) = 0.6554 − 0.3446 = 0.3108
The sampling distribution of 𝑋 is approximately normal with mean μx=8 and
standard deviation σx =
σ
n
=
3
36
= 0.5
Copyright © 2019, 2015, 2012 Pearson Education, Inc.
A L W A Y S L E A R N I N G Slide 30
Solution:
Z
7.8 8.2 -0.4 0.4
Sampling
Distribution
Standard Normal
Distribution
Population
Distribution
?
?
?
?
?
?
?
?
?
?
?
?
Sample Standardize
μ = 8 μX = 8 μz = 0
𝑥
X
Copyright © 2019, 2015, 2012 Pearson Education, Inc.
A L W A Y S L E A R N I N G Slide 31
Population Proportions
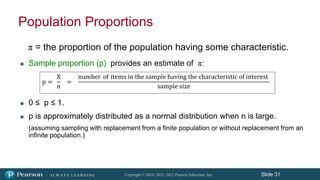
π = the proportion of the population having some characteristic.
 Sample proportion (p) provides an estimate of π:
 0 ≤ p ≤ 1.
 p is approximately distributed as a normal distribution when n is large.
(assuming sampling with replacement from a finite population or without replacement from an
infinite population.)
p =
X
n
=
number of items in the sample having the characteristic of interest
sample size
Copyright © 2019, 2015, 2012 Pearson Education, Inc.
A L W A Y S L E A R N I N G Slide 32
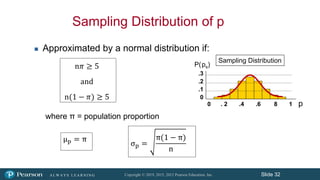
Sampling Distribution of p
 Approximated by a normal distribution if:
where π = population proportion
Sampling Distribution
P(ps)
.3
.2
.1
0
0 . 2 .4 .6 8 1 p
μp = π
σp =
π(1 − π)
n
n𝜋 ≥ 5
and
n(1 − 𝜋) ≥ 5
Copyright © 2019, 2015, 2012 Pearson Education, Inc.
A L W A Y S L E A R N I N G Slide 33
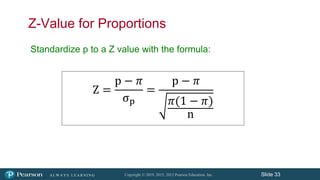
Z-Value for Proportions
Z =
p − 𝜋
σp
=
p − 𝜋
𝜋(1 − 𝜋)
n
Standardize p to a Z value with the formula:
Copyright © 2019, 2015, 2012 Pearson Education, Inc.
A L W A Y S L E A R N I N G Slide 34
Example
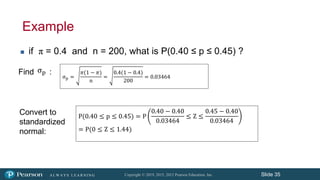
 If the true proportion of voters who support Proposition A is π =
0.4, what is the probability that a sample of size 200 yields a
sample proportion between 0.40 and 0.45?
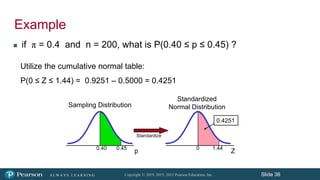
 i.e.: if π = 0.4 and n = 200, what is P(0.40 ≤ p ≤ 0.45) ?
Copyright © 2019, 2015, 2012 Pearson Education, Inc.
A L W A Y S L E A R N I N G Slide 35
Example
 if π = 0.4 and n = 200, what is P(0.40 ≤ p ≤ 0.45) ?
σp =
𝜋(1 − 𝜋)
n
=
0.4(1 − 0.4)
200
= 0.03464
P(0.40 ≤ p ≤ 0.45) = P
0.40 − 0.40
0.03464
≤ Z ≤
0.45 − 0.40
0.03464
= P(0 ≤ Z ≤ 1.44)
Find :
Convert to
standardized
normal:
σp
Copyright © 2019, 2015, 2012 Pearson Education, Inc.
A L W A Y S L E A R N I N G Slide 36
Example
Z
0.45 1.44
0.4251
Standardize
Sampling Distribution
Standardized
Normal Distribution
Utilize the cumulative normal table:
P(0 ≤ Z ≤ 1.44) = 0.9251 – 0.5000 = 0.4251
0.40 0
p
 if π = 0.4 and n = 200, what is P(0.40 ≤ p ≤ 0.45) ?
Copyright © 2019, 2015, 2012 Pearson Education, Inc.
A L W A Y S L E A R N I N G Slide 37
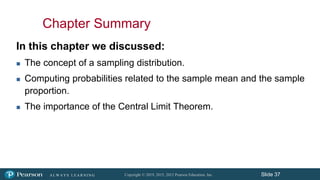
Chapter Summary
In this chapter we discussed:
 The concept of a sampling distribution.
 Computing probabilities related to the sample mean and the sample
proportion.
 The importance of the Central Limit Theorem.
Copyright © 2019, 2015, 2012 Pearson Education, Inc.
A L W A Y S L E A R N I N G Slide 38
Until next week:
• Today’s PPT will be posted on BB.
• Continue to study on your Project.
• F.Tetikoglu@georgianatilac.com
• Please check your BB frequently as I will be posting instructions.
Editor's Notes

  • #6 The image is taken from https://www.omniconvert.com/what-is/sample-size/