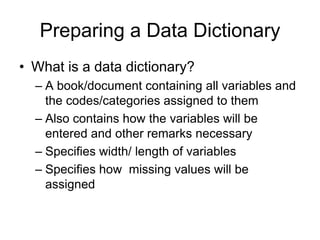
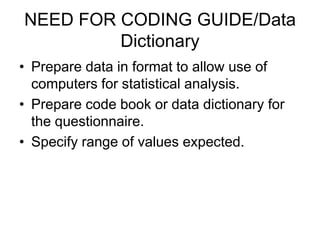
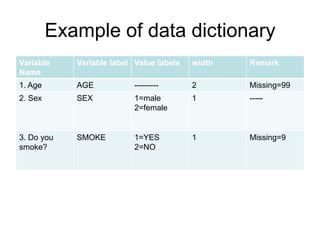
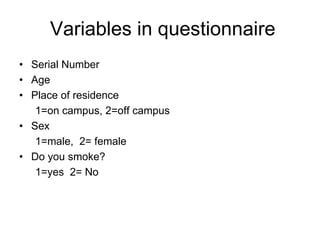
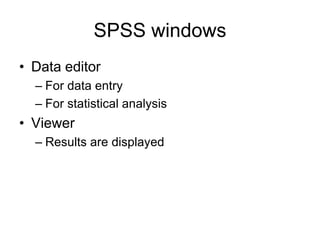
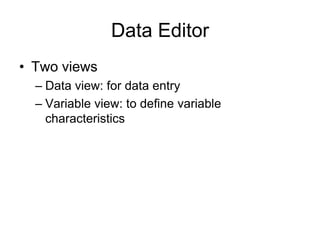
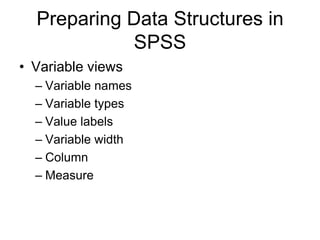
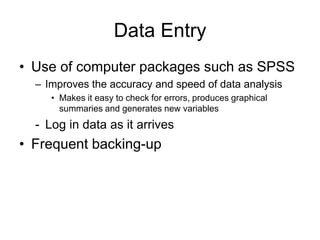
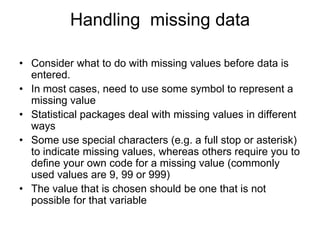
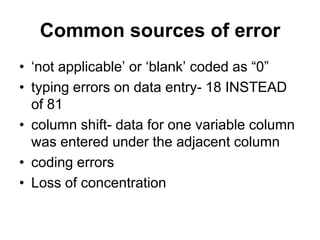
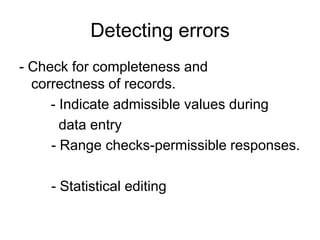
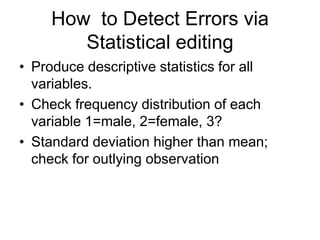
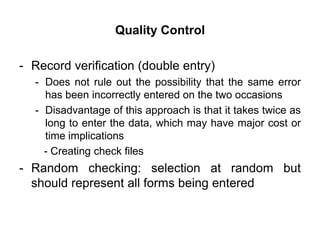
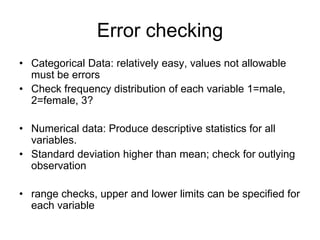
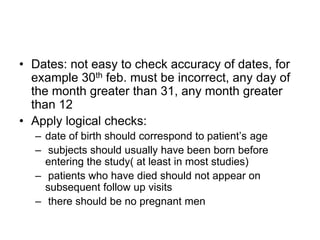
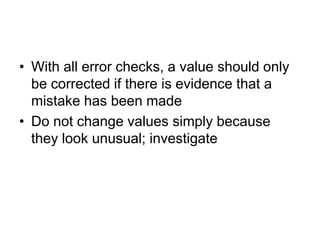
@kaimrc_edu


       1
DATA ENTRY USING IBM SPSS


        Yusuf O.B.
      Biostatistician
       KAIMRC-WR
Lecture Outline
•   What is SPSS
•   Uses of SPSS
•   Preparing to enter data
•   Preparing a data dictionary
•   Data Structures
•   Errors in data
•   Data Cleaning
What is SPSS

Statistical Package for the Social Sciences
Uses of SPSS

•   Data entry
•   Data cleaning and editing
•   Data analysis
•   Data presentation
•   Data Importing and Exporting
•   SPSS Data Library
Preparing a Data Dictionary
• What is a data dictionary?
  – A book/document containing all variables and
    the codes/categories assigned to them
  – Also contains how the variables will be
    entered and other remarks necessary
  – Specifies width/ length of variables
  – Specifies how missing values will be
    assigned
Data coding
• Translation of responses on the
  questionnaires or data collection sheets to
  specific categories for the purpose of
  analysis.
• Assignment of numbers to the various
  levels of the variables.
• Load of work light for pre-coded
  questionnaires
• Important and tedious for open ended
  questions.
• Need to assign numerical codes to
  categorical data before entering
• For example, you may choose to assign
  codes of 1, 2, 3 and 4 to categories of “no
  pain”, „mild pain”, “moderate pain” and
  “severe pain” respectively
• These codes can be put in the
  questionnaire when collecting the data.
• For binary data e.g. yes/no answers, it is
  often convenient to assign codes 1 (e.g.
  for yes) and 0 or 2 (for no).
NEED FOR CODING GUIDE/Data
         Dictionary
• Prepare data in format to allow use of
  computers for statistical analysis.
• Prepare code book or data dictionary for
  the questionnaire.
• Specify range of values expected.
• Unit of measurement should be consistent
  for all observations on a variable. E.g.
  weight should be recorded in kg or in
  pounds , but not both interchangeably
• Time: days? Hours?
  – For example length of hospital stay
Example of data dictionary
Variable    Variable label Value labels   width   Remark
Name
1. Age      AGE            ---------      2       Missing=99
2. Sex      SEX            1=male         1       -----
                           2=female


3. Do you   SMOKE          1=YES          1       Missing=9
smoke?                     2=NO
Example
• Topic: Smoking among medical students
• 200 questionnaires/records
• 6 questions/variables
Variables in questionnaire
• Serial Number
• Age
• Place of residence
   1=on campus, 2=off campus
• Sex
   1=male, 2= female
• Do you smoke?
   1=yes 2= No
• At what age did you start to
  smoke? -------
Exercise

– Complete the data dictionary above
SPSS windows
• Data editor
  – For data entry
  – For statistical analysis
• Viewer
  – Results are displayed
Data Editor
• Two views
  – Data view: for data entry
  – Variable view: to define variable
    characteristics
Preparing Data Structures in
            SPSS
• Variable views
  – Variable names
  – Variable types
  – Value labels
  – Variable width
  – Column
  – Measure
Data Entry
• Use of computer packages such as SPSS
  – Improves the accuracy and speed of data analysis
     • Makes it easy to check for errors, produces graphical
       summaries and generates new variables
  - Log in data as it arrives
• Frequent backing-up
• Problems with dates and times:
  – dates and times should be entered in a
    consistent manner, e.g. as day/month/year or
    month/day/year but not interchangeably.
  – It is important to find out what format the
    statistical package can read
Handling missing data

• Consider what to do with missing values before data is
  entered.
• In most cases, need to use some symbol to represent a
  missing value
• Statistical packages deal with missing values in different
  ways
• Some use special characters (e.g. a full stop or asterisk)
  to indicate missing values, whereas others require you to
  define your own code for a missing value (commonly
  used values are 9, 99 or 999)
• The value that is chosen should be one that is not
  possible for that variable
• For example when entering a categorical
  variable with four categories (coded 1,2,3,
  and 4), you may choose the value 9 to
  represent missing values.
• However, if the variable is age of a child,
  then a different code should be chosen.
• If a large proportion of data is missing, then the results
  are likely to be unreliable

• Reasons why data are missing should always be
  investigated: how much is missing and why?

• If missing data tend to cluster around a particular
  variable, or in a particular sub group of individuals, then
  it ,may indicate that the variable is not applicable or has
  not been measured for that group of individuals
• Then the group of individuals should be
  excluded from any analysis on that
  variable
• Or it may be that the data is simply sitting
  on a piece of paper in someone‟s drawer
  and are yet to be entered!
Errors in data
• In any study, there is always the potential
  for errors to occur in a data set, either at
  the outset when taking the measurements,
  or when collecting, and entering data onto
  a computer

• It is hard to eliminate all of these errors

• But one can reduce the number of typing
  errors by checking the data carefully once
  they have been entered.
Common sources of error
• „not applicable‟ or „blank‟ coded as “0”
• typing errors on data entry- 18 INSTEAD
  of 81
• column shift- data for one variable column
  was entered under the adjacent column
• coding errors
• Loss of concentration
Data cleaning
Two-step process-
• detection and
• correction of errors
.
Detecting errors
- Check for completeness and
  correctness of records.
     - Indicate admissible values during
       data entry
     - Range checks-permissible responses.

    - Statistical editing
How to Detect Errors via
        Statistical editing
• Produce descriptive statistics for all
  variables.
• Check frequency distribution of each
  variable 1=male, 2=female, 3?
• Standard deviation higher than mean;
  check for outlying observation
Quality Control

- Record verification (double entry)
  - Does not rule out the possibility that the same error
    has been incorrectly entered on the two occasions
  - Disadvantage of this approach is that it takes twice as
    long to enter the data, which may have major cost or
    time implications
    - Creating check files
- Random checking: selection at random but
  should represent all forms being entered
Error checking
• Categorical Data: relatively easy, values not allowable
  must be errors
• Check frequency distribution of each variable 1=male,
  2=female, 3?

• Numerical data: Produce descriptive statistics for all
  variables.
• Standard deviation higher than mean; check for outlying
  observation

• range checks, upper and lower limits can be specified for
  each variable
• Dates: not easy to check accuracy of dates, for
  example 30th feb. must be incorrect, any day of
  the month greater than 31, any month greater
  than 12
• Apply logical checks:
  – date of birth should correspond to patient‟s age
  – subjects should usually have been born before
    entering the study( at least in most studies)
  – patients who have died should not appear on
    subsequent follow up visits
  – there should be no pregnant men
• With all error checks, a value should only
  be corrected if there is evidence that a
  mistake has been made
• Do not change values simply because
  they look unusual; investigate
Summary
• Experience comes with practice
• Input influences output

RSS 2012 Data Entry SPSS

  • 1.
  • 2.
    DATA ENTRY USINGIBM SPSS Yusuf O.B. Biostatistician KAIMRC-WR
  • 3.
    Lecture Outline • What is SPSS • Uses of SPSS • Preparing to enter data • Preparing a data dictionary • Data Structures • Errors in data • Data Cleaning
  • 4.
    What is SPSS StatisticalPackage for the Social Sciences
  • 5.
    Uses of SPSS • Data entry • Data cleaning and editing • Data analysis • Data presentation • Data Importing and Exporting • SPSS Data Library
  • 6.
    Preparing a DataDictionary • What is a data dictionary? – A book/document containing all variables and the codes/categories assigned to them – Also contains how the variables will be entered and other remarks necessary – Specifies width/ length of variables – Specifies how missing values will be assigned
  • 7.
    Data coding • Translationof responses on the questionnaires or data collection sheets to specific categories for the purpose of analysis. • Assignment of numbers to the various levels of the variables. • Load of work light for pre-coded questionnaires
  • 8.
    • Important andtedious for open ended questions.
  • 9.
    • Need toassign numerical codes to categorical data before entering • For example, you may choose to assign codes of 1, 2, 3 and 4 to categories of “no pain”, „mild pain”, “moderate pain” and “severe pain” respectively
  • 10.
    • These codescan be put in the questionnaire when collecting the data. • For binary data e.g. yes/no answers, it is often convenient to assign codes 1 (e.g. for yes) and 0 or 2 (for no).
  • 11.
    NEED FOR CODINGGUIDE/Data Dictionary • Prepare data in format to allow use of computers for statistical analysis. • Prepare code book or data dictionary for the questionnaire. • Specify range of values expected.
  • 12.
    • Unit ofmeasurement should be consistent for all observations on a variable. E.g. weight should be recorded in kg or in pounds , but not both interchangeably • Time: days? Hours? – For example length of hospital stay
  • 13.
    Example of datadictionary Variable Variable label Value labels width Remark Name 1. Age AGE --------- 2 Missing=99 2. Sex SEX 1=male 1 ----- 2=female 3. Do you SMOKE 1=YES 1 Missing=9 smoke? 2=NO
  • 14.
    Example • Topic: Smokingamong medical students • 200 questionnaires/records • 6 questions/variables
  • 15.
    Variables in questionnaire •Serial Number • Age • Place of residence 1=on campus, 2=off campus • Sex 1=male, 2= female • Do you smoke? 1=yes 2= No
  • 16.
    • At whatage did you start to smoke? -------
  • 17.
    Exercise – Complete thedata dictionary above
  • 18.
    SPSS windows • Dataeditor – For data entry – For statistical analysis • Viewer – Results are displayed
  • 19.
    Data Editor • Twoviews – Data view: for data entry – Variable view: to define variable characteristics
  • 20.
    Preparing Data Structuresin SPSS • Variable views – Variable names – Variable types – Value labels – Variable width – Column – Measure
  • 21.
    Data Entry • Useof computer packages such as SPSS – Improves the accuracy and speed of data analysis • Makes it easy to check for errors, produces graphical summaries and generates new variables - Log in data as it arrives • Frequent backing-up
  • 22.
    • Problems withdates and times: – dates and times should be entered in a consistent manner, e.g. as day/month/year or month/day/year but not interchangeably. – It is important to find out what format the statistical package can read
  • 23.
    Handling missing data •Consider what to do with missing values before data is entered. • In most cases, need to use some symbol to represent a missing value • Statistical packages deal with missing values in different ways • Some use special characters (e.g. a full stop or asterisk) to indicate missing values, whereas others require you to define your own code for a missing value (commonly used values are 9, 99 or 999) • The value that is chosen should be one that is not possible for that variable
  • 24.
    • For examplewhen entering a categorical variable with four categories (coded 1,2,3, and 4), you may choose the value 9 to represent missing values. • However, if the variable is age of a child, then a different code should be chosen.
  • 25.
    • If alarge proportion of data is missing, then the results are likely to be unreliable • Reasons why data are missing should always be investigated: how much is missing and why? • If missing data tend to cluster around a particular variable, or in a particular sub group of individuals, then it ,may indicate that the variable is not applicable or has not been measured for that group of individuals
  • 26.
    • Then thegroup of individuals should be excluded from any analysis on that variable • Or it may be that the data is simply sitting on a piece of paper in someone‟s drawer and are yet to be entered!
  • 27.
    Errors in data •In any study, there is always the potential for errors to occur in a data set, either at the outset when taking the measurements, or when collecting, and entering data onto a computer • It is hard to eliminate all of these errors • But one can reduce the number of typing errors by checking the data carefully once they have been entered.
  • 28.
    Common sources oferror • „not applicable‟ or „blank‟ coded as “0” • typing errors on data entry- 18 INSTEAD of 81 • column shift- data for one variable column was entered under the adjacent column • coding errors • Loss of concentration
  • 29.
    Data cleaning Two-step process- •detection and • correction of errors .
  • 30.
    Detecting errors - Checkfor completeness and correctness of records. - Indicate admissible values during data entry - Range checks-permissible responses. - Statistical editing
  • 31.
    How to DetectErrors via Statistical editing • Produce descriptive statistics for all variables. • Check frequency distribution of each variable 1=male, 2=female, 3? • Standard deviation higher than mean; check for outlying observation
  • 32.
    Quality Control - Recordverification (double entry) - Does not rule out the possibility that the same error has been incorrectly entered on the two occasions - Disadvantage of this approach is that it takes twice as long to enter the data, which may have major cost or time implications - Creating check files - Random checking: selection at random but should represent all forms being entered
  • 33.
    Error checking • CategoricalData: relatively easy, values not allowable must be errors • Check frequency distribution of each variable 1=male, 2=female, 3? • Numerical data: Produce descriptive statistics for all variables. • Standard deviation higher than mean; check for outlying observation • range checks, upper and lower limits can be specified for each variable
  • 34.
    • Dates: noteasy to check accuracy of dates, for example 30th feb. must be incorrect, any day of the month greater than 31, any month greater than 12 • Apply logical checks: – date of birth should correspond to patient‟s age – subjects should usually have been born before entering the study( at least in most studies) – patients who have died should not appear on subsequent follow up visits – there should be no pregnant men
  • 35.
    • With allerror checks, a value should only be corrected if there is evidence that a mistake has been made • Do not change values simply because they look unusual; investigate
  • 36.
    Summary • Experience comeswith practice • Input influences output