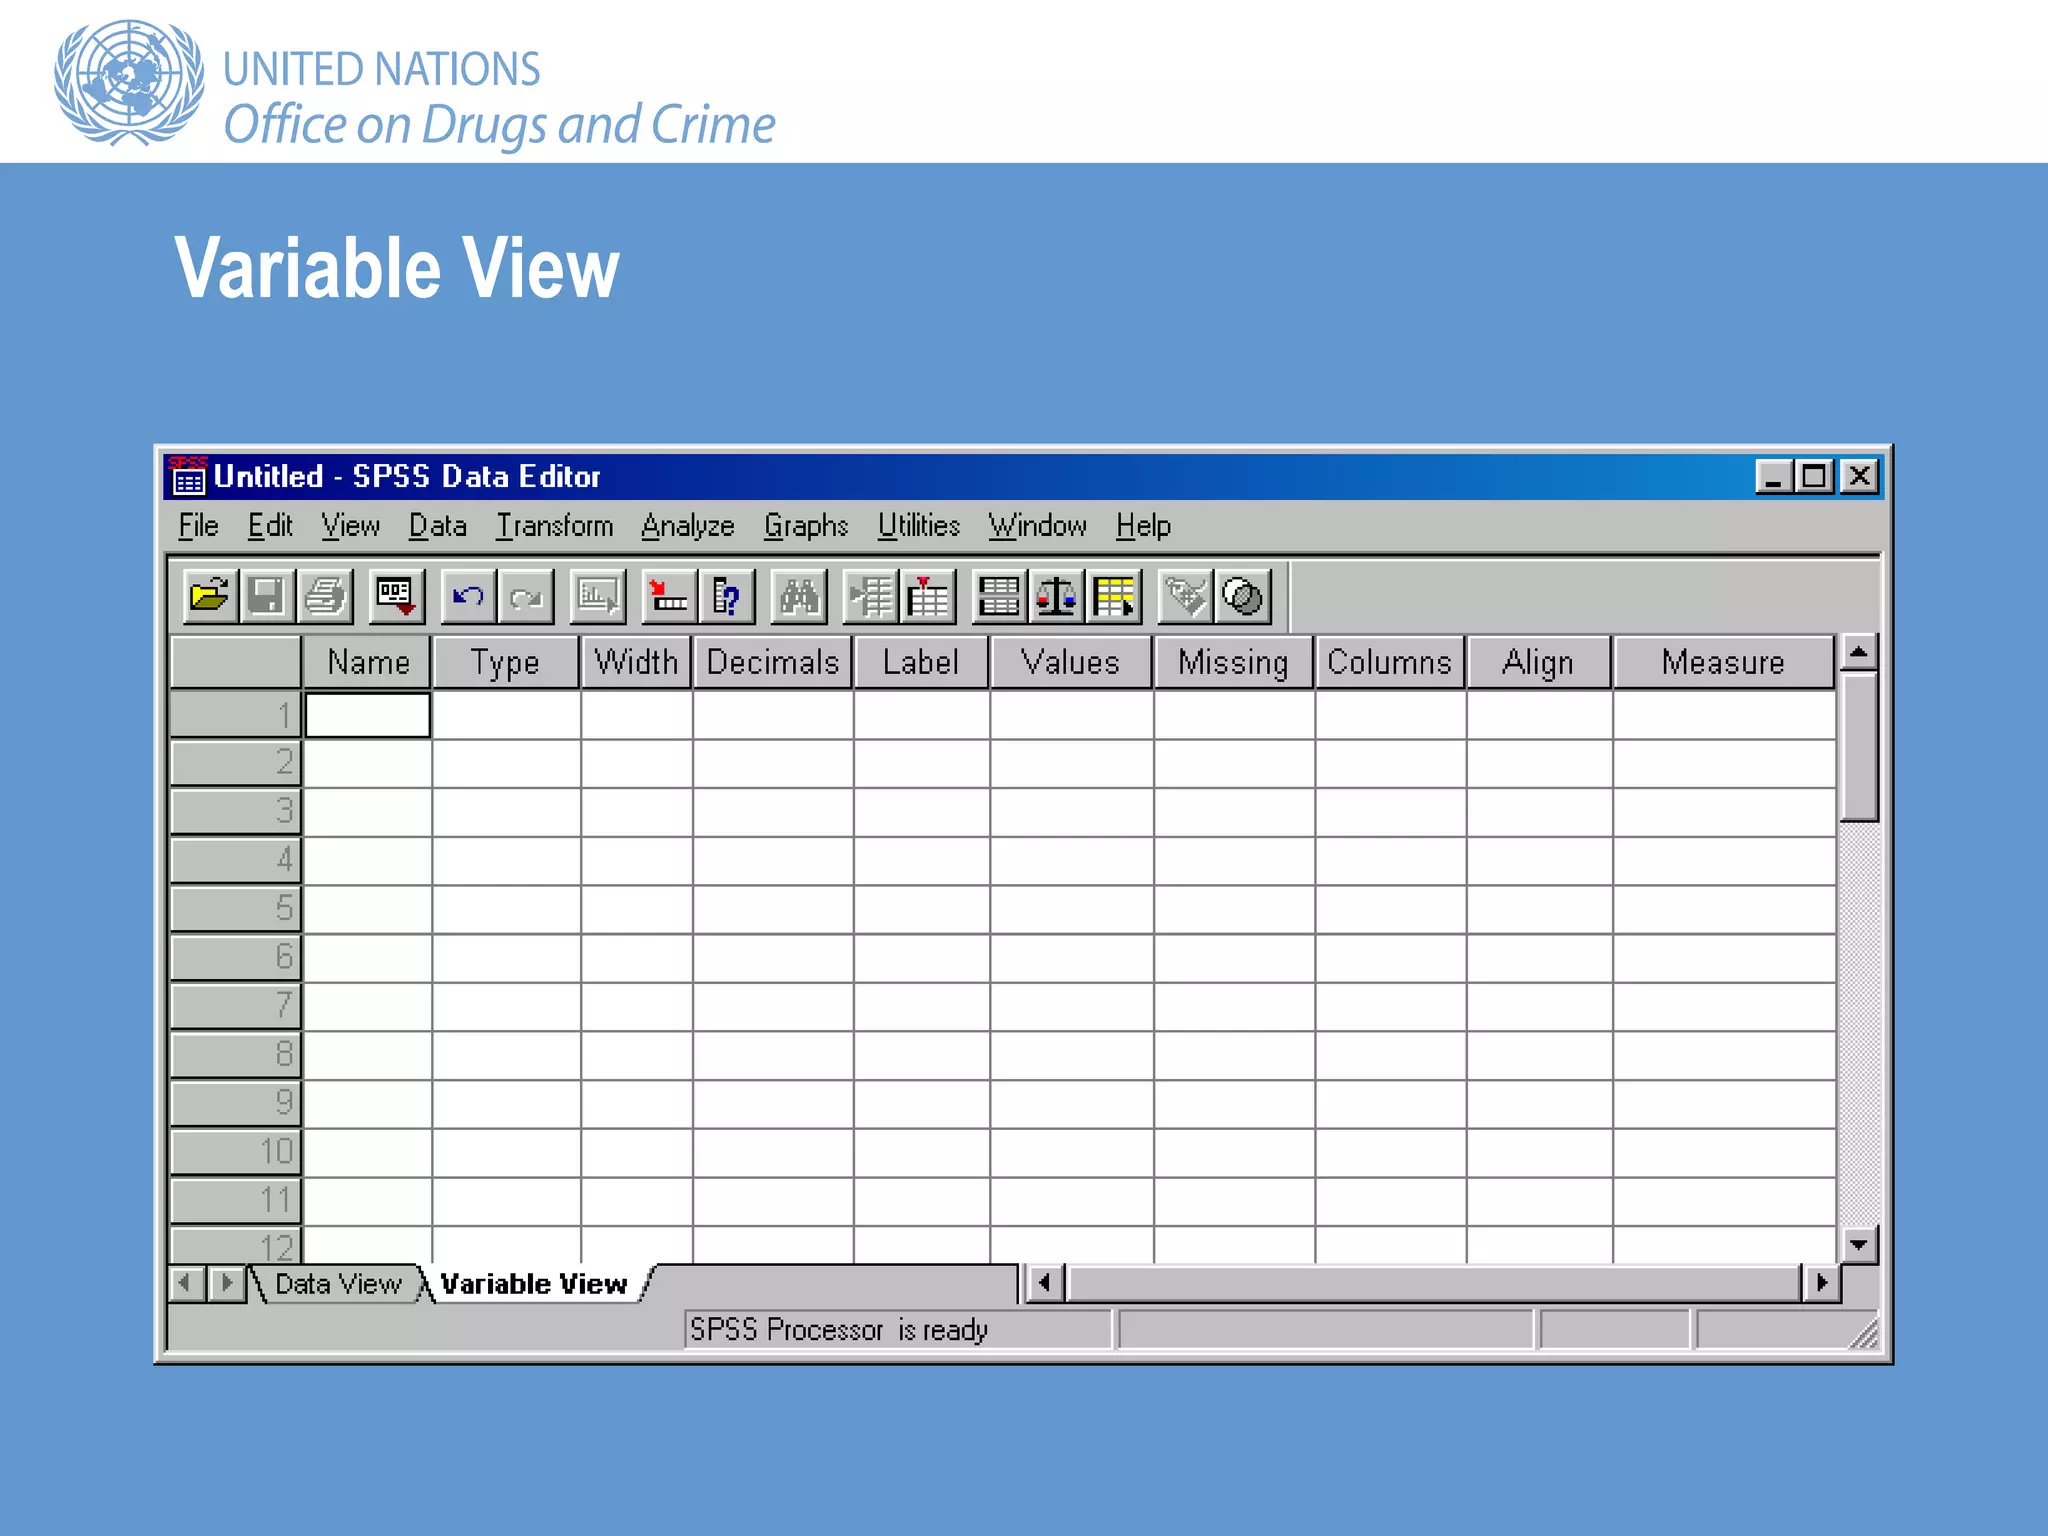
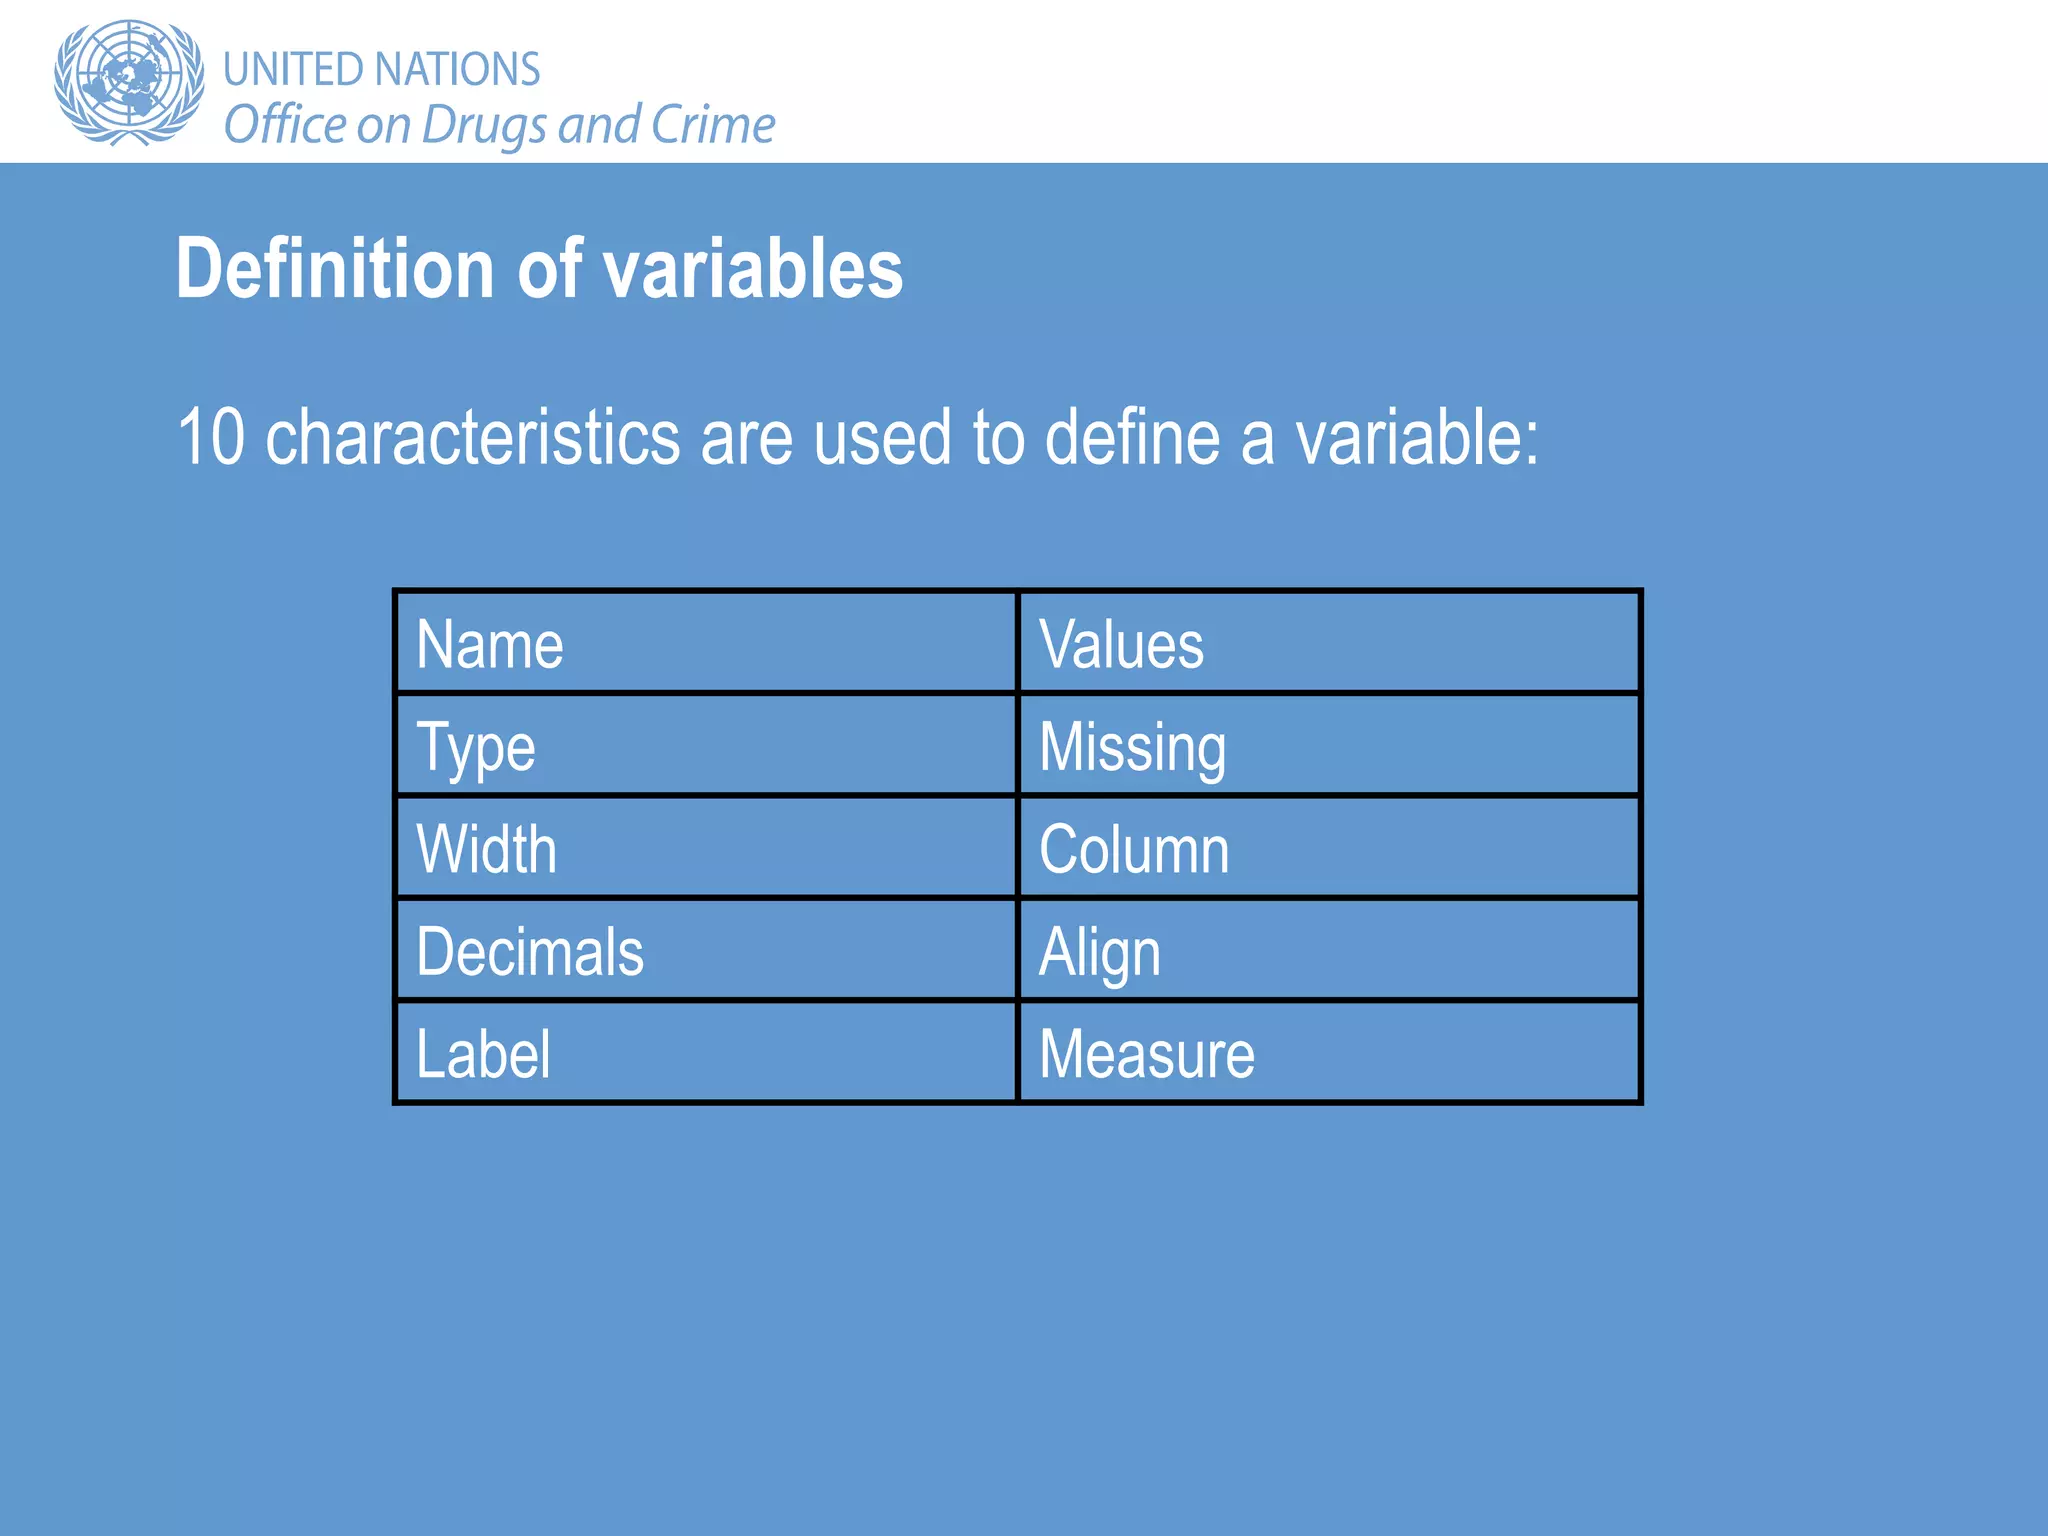
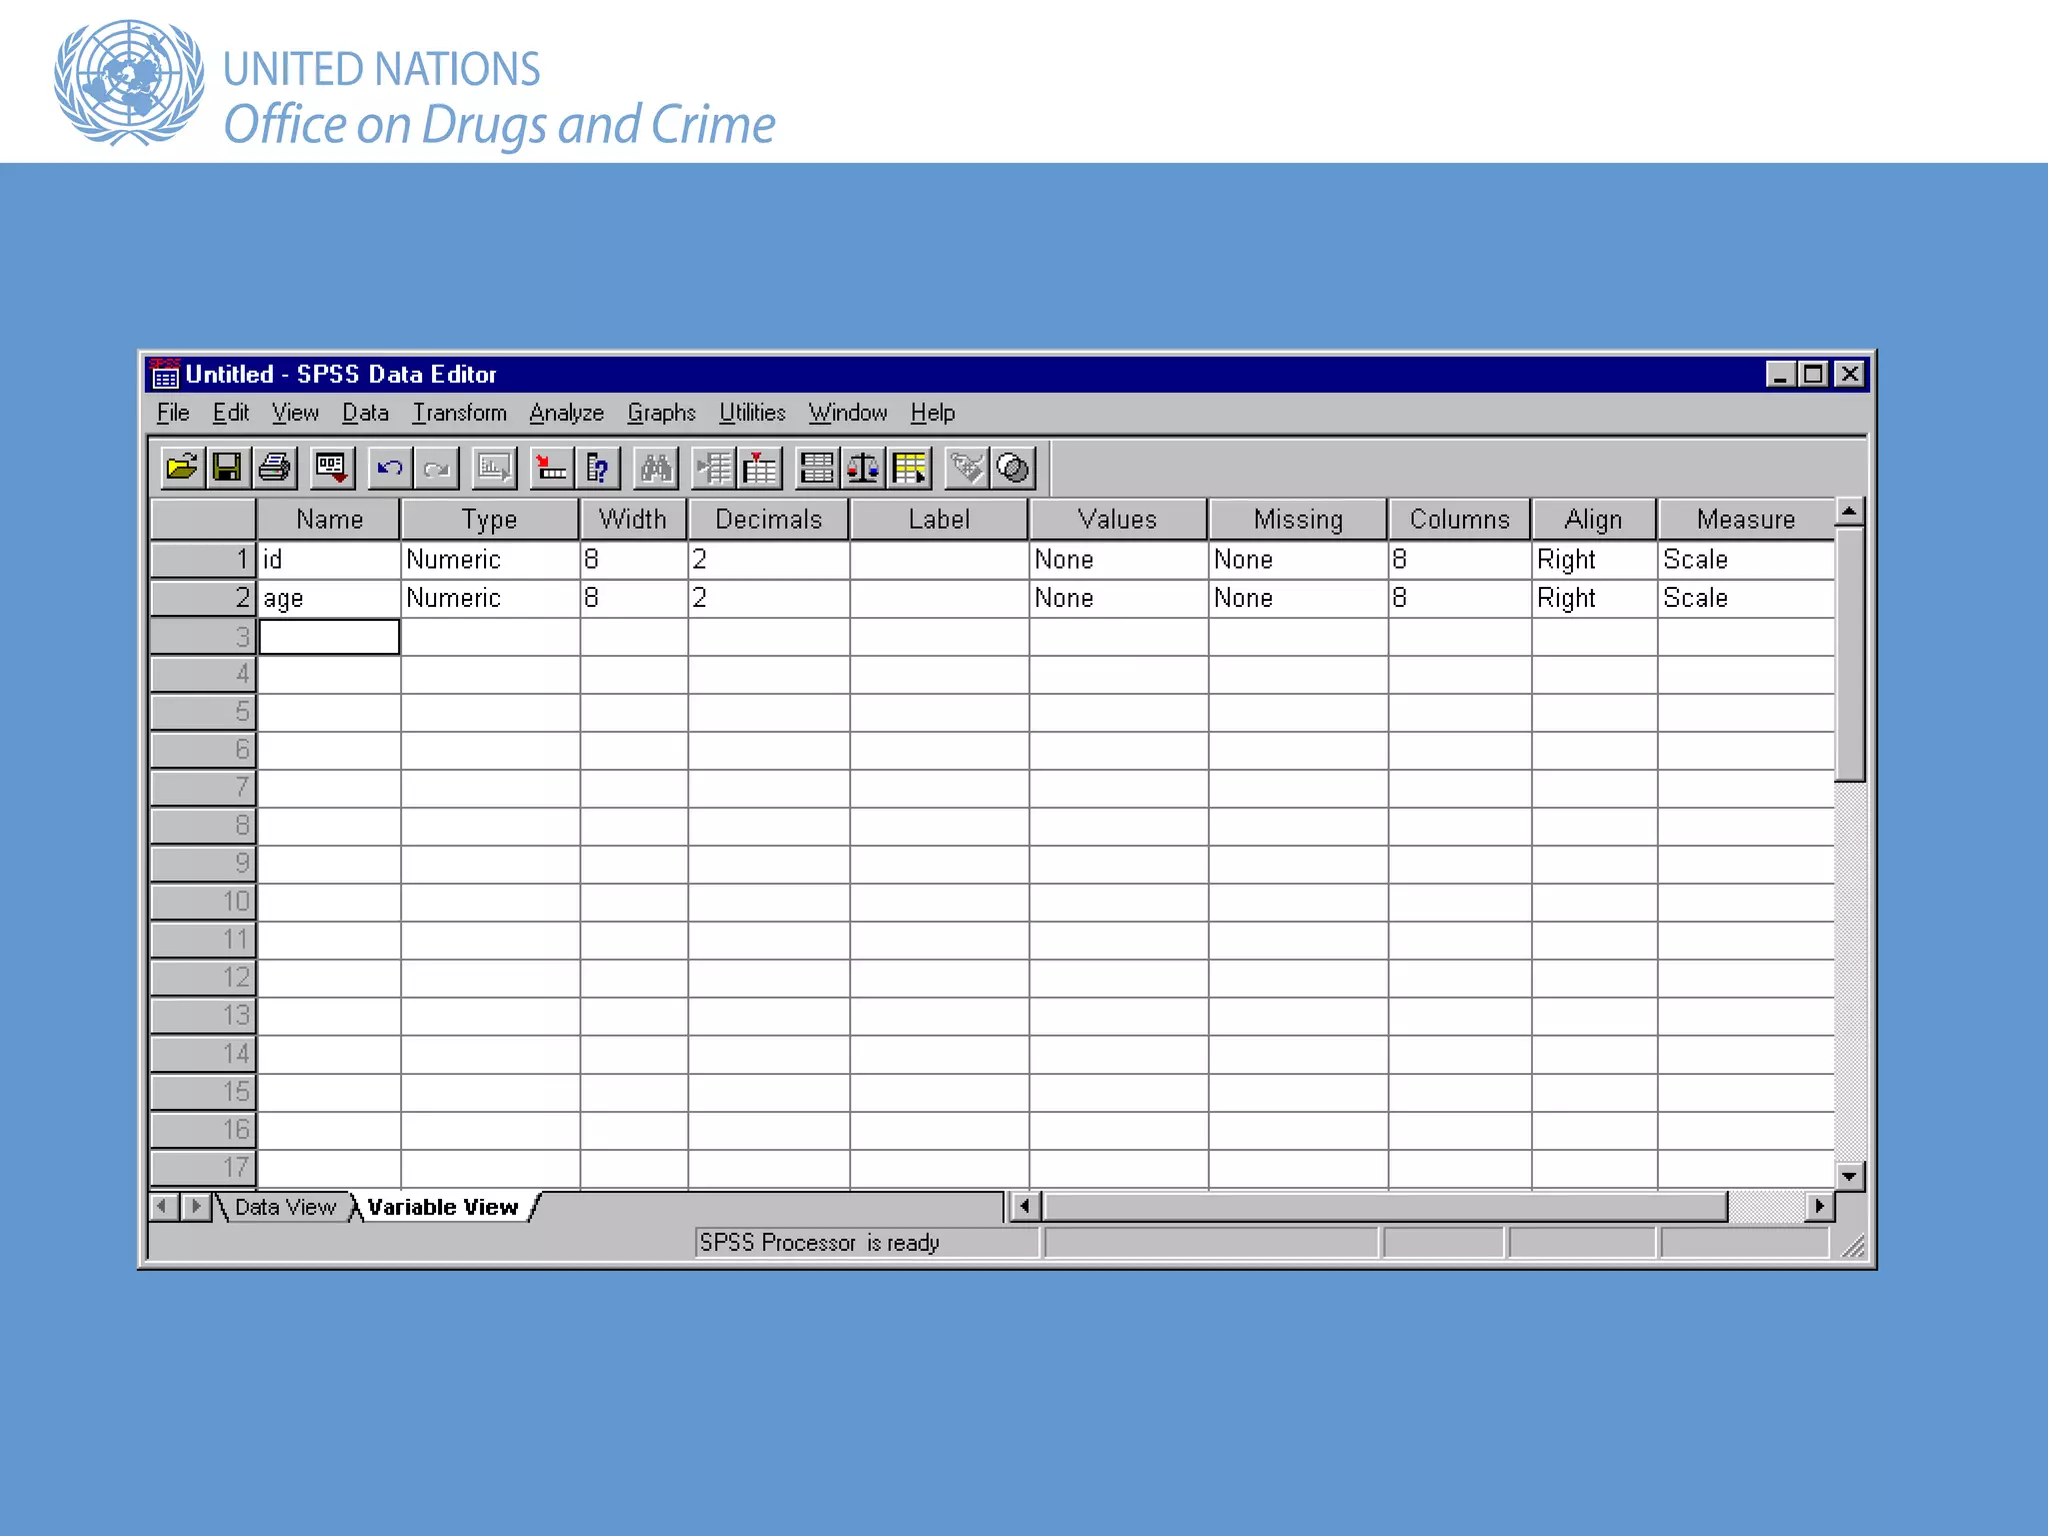
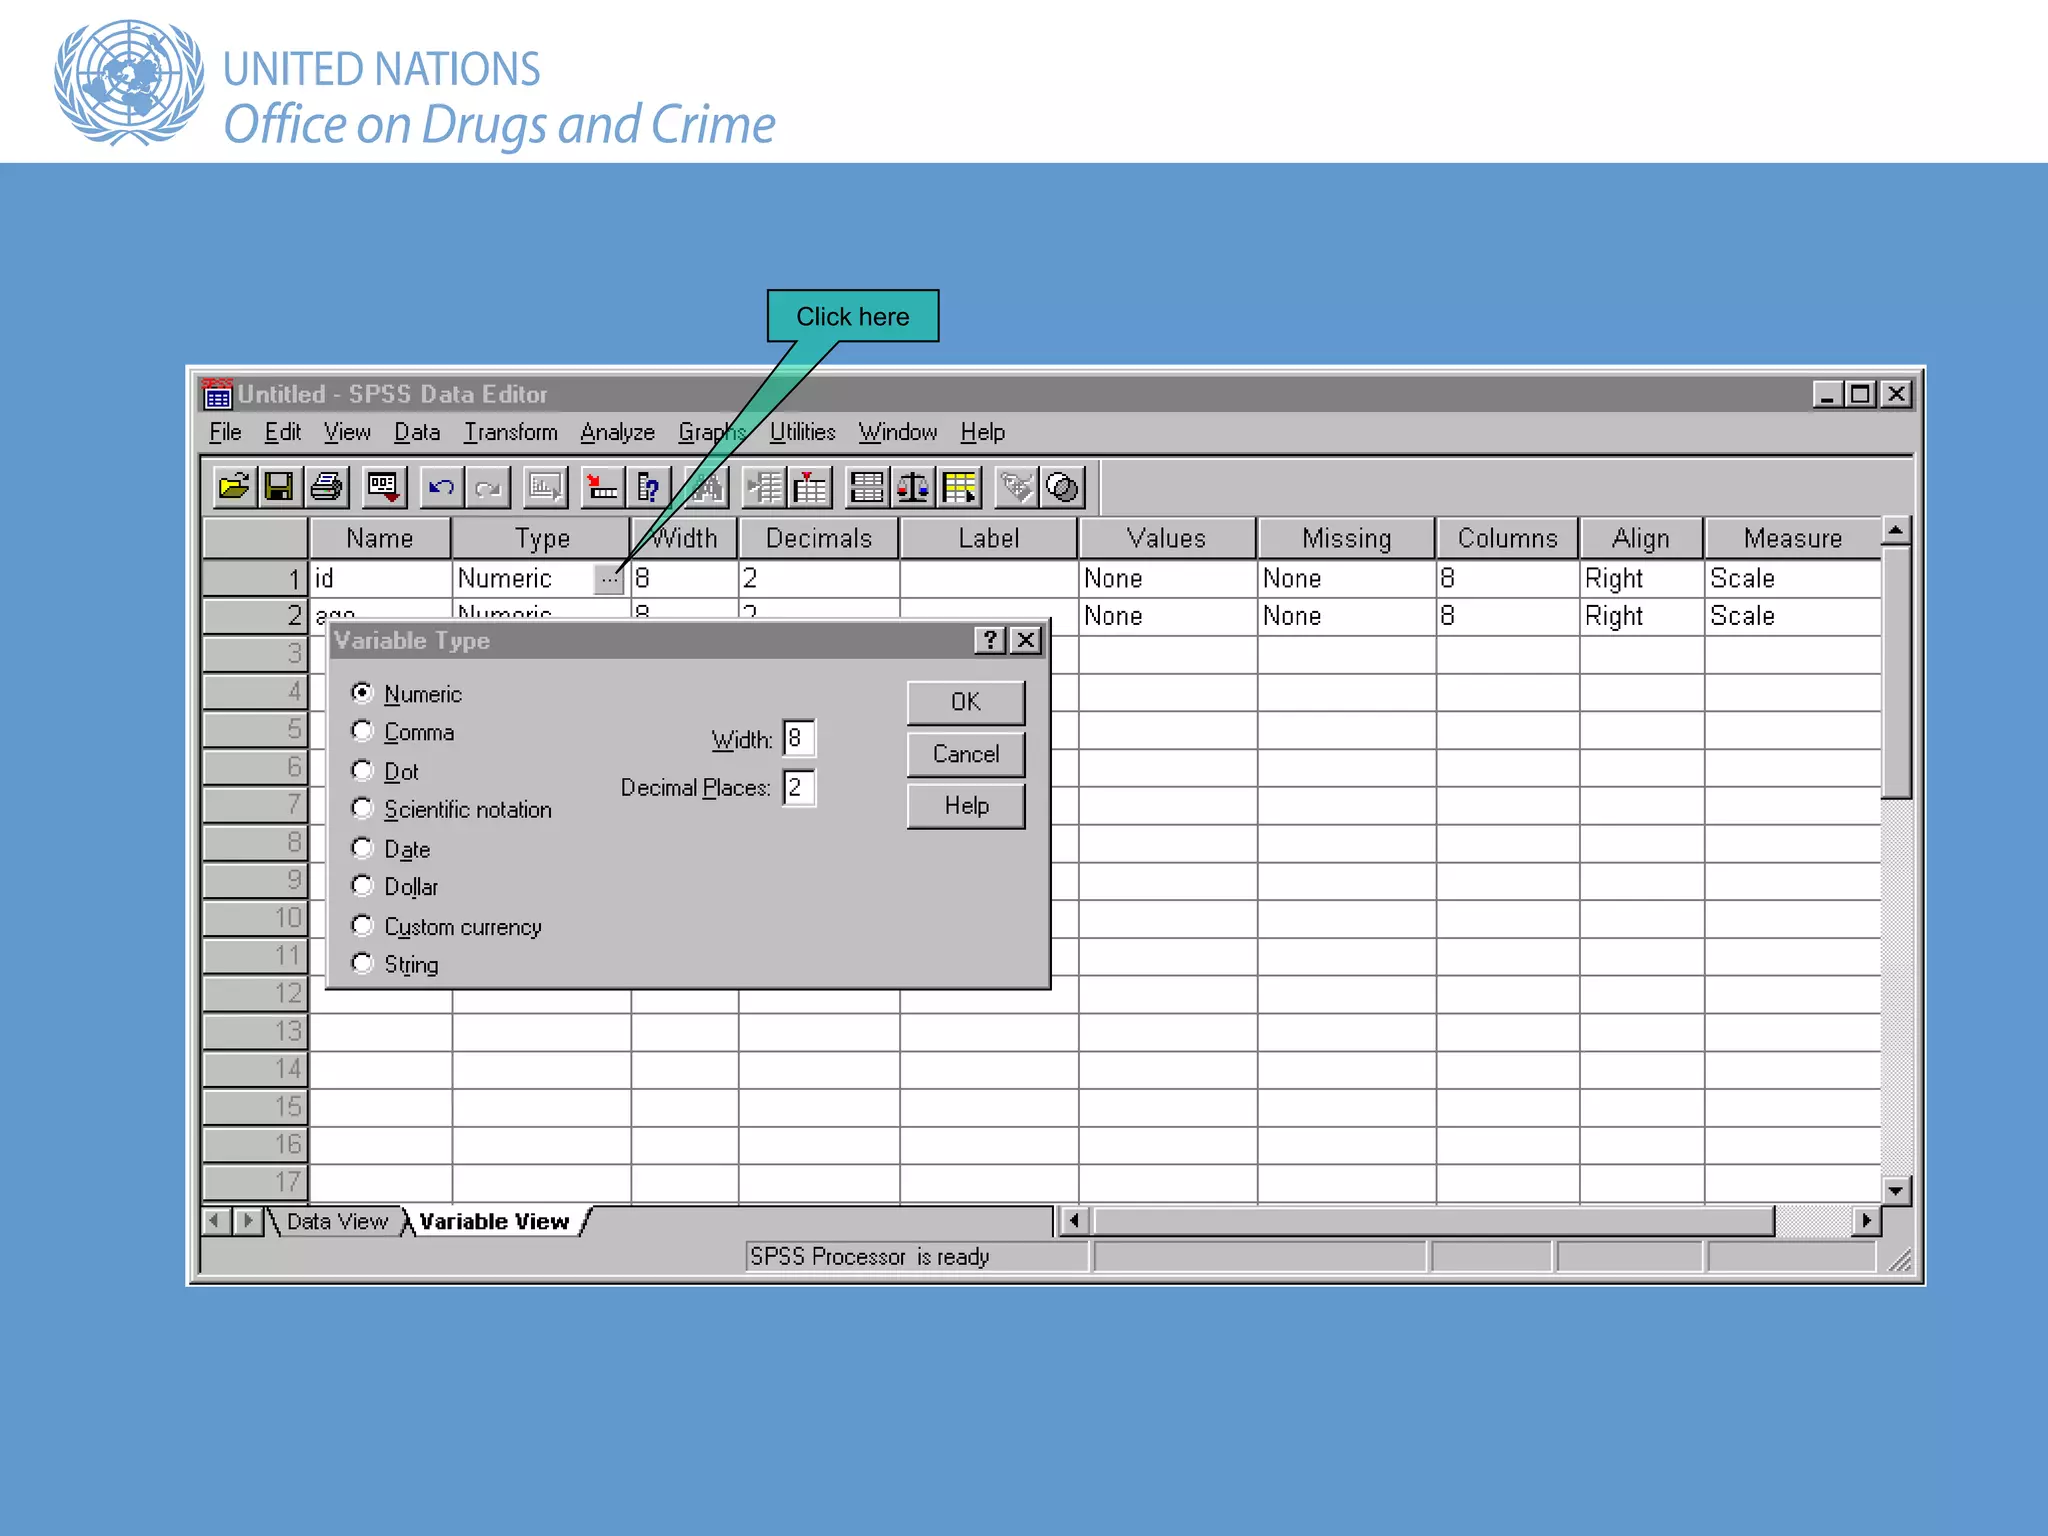
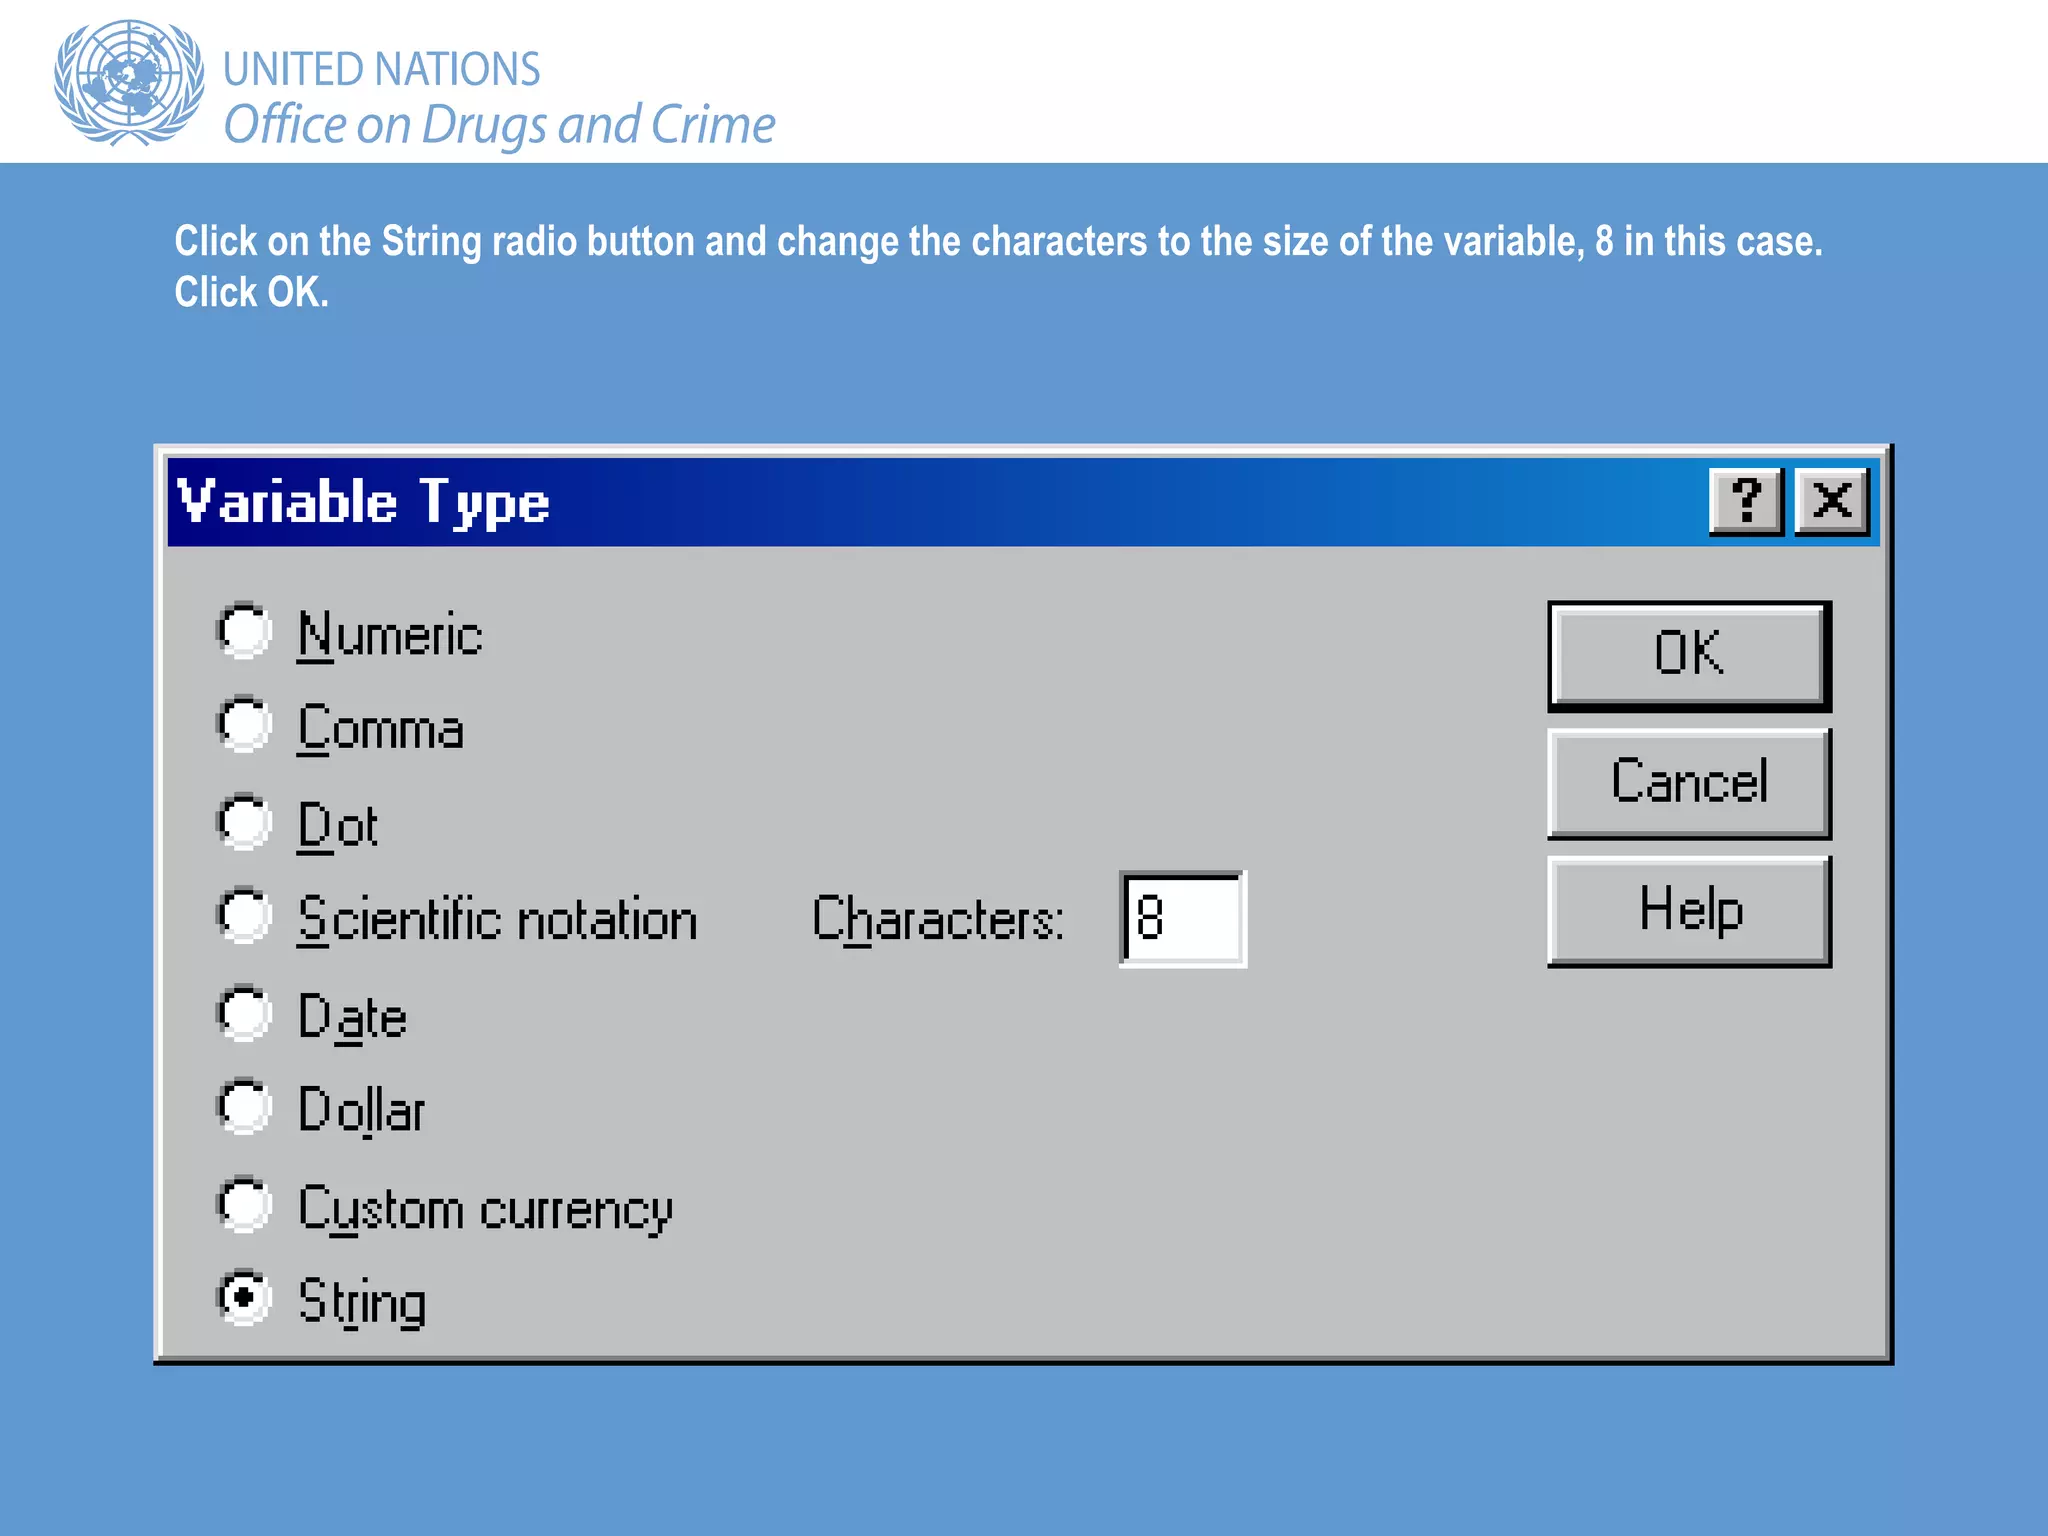
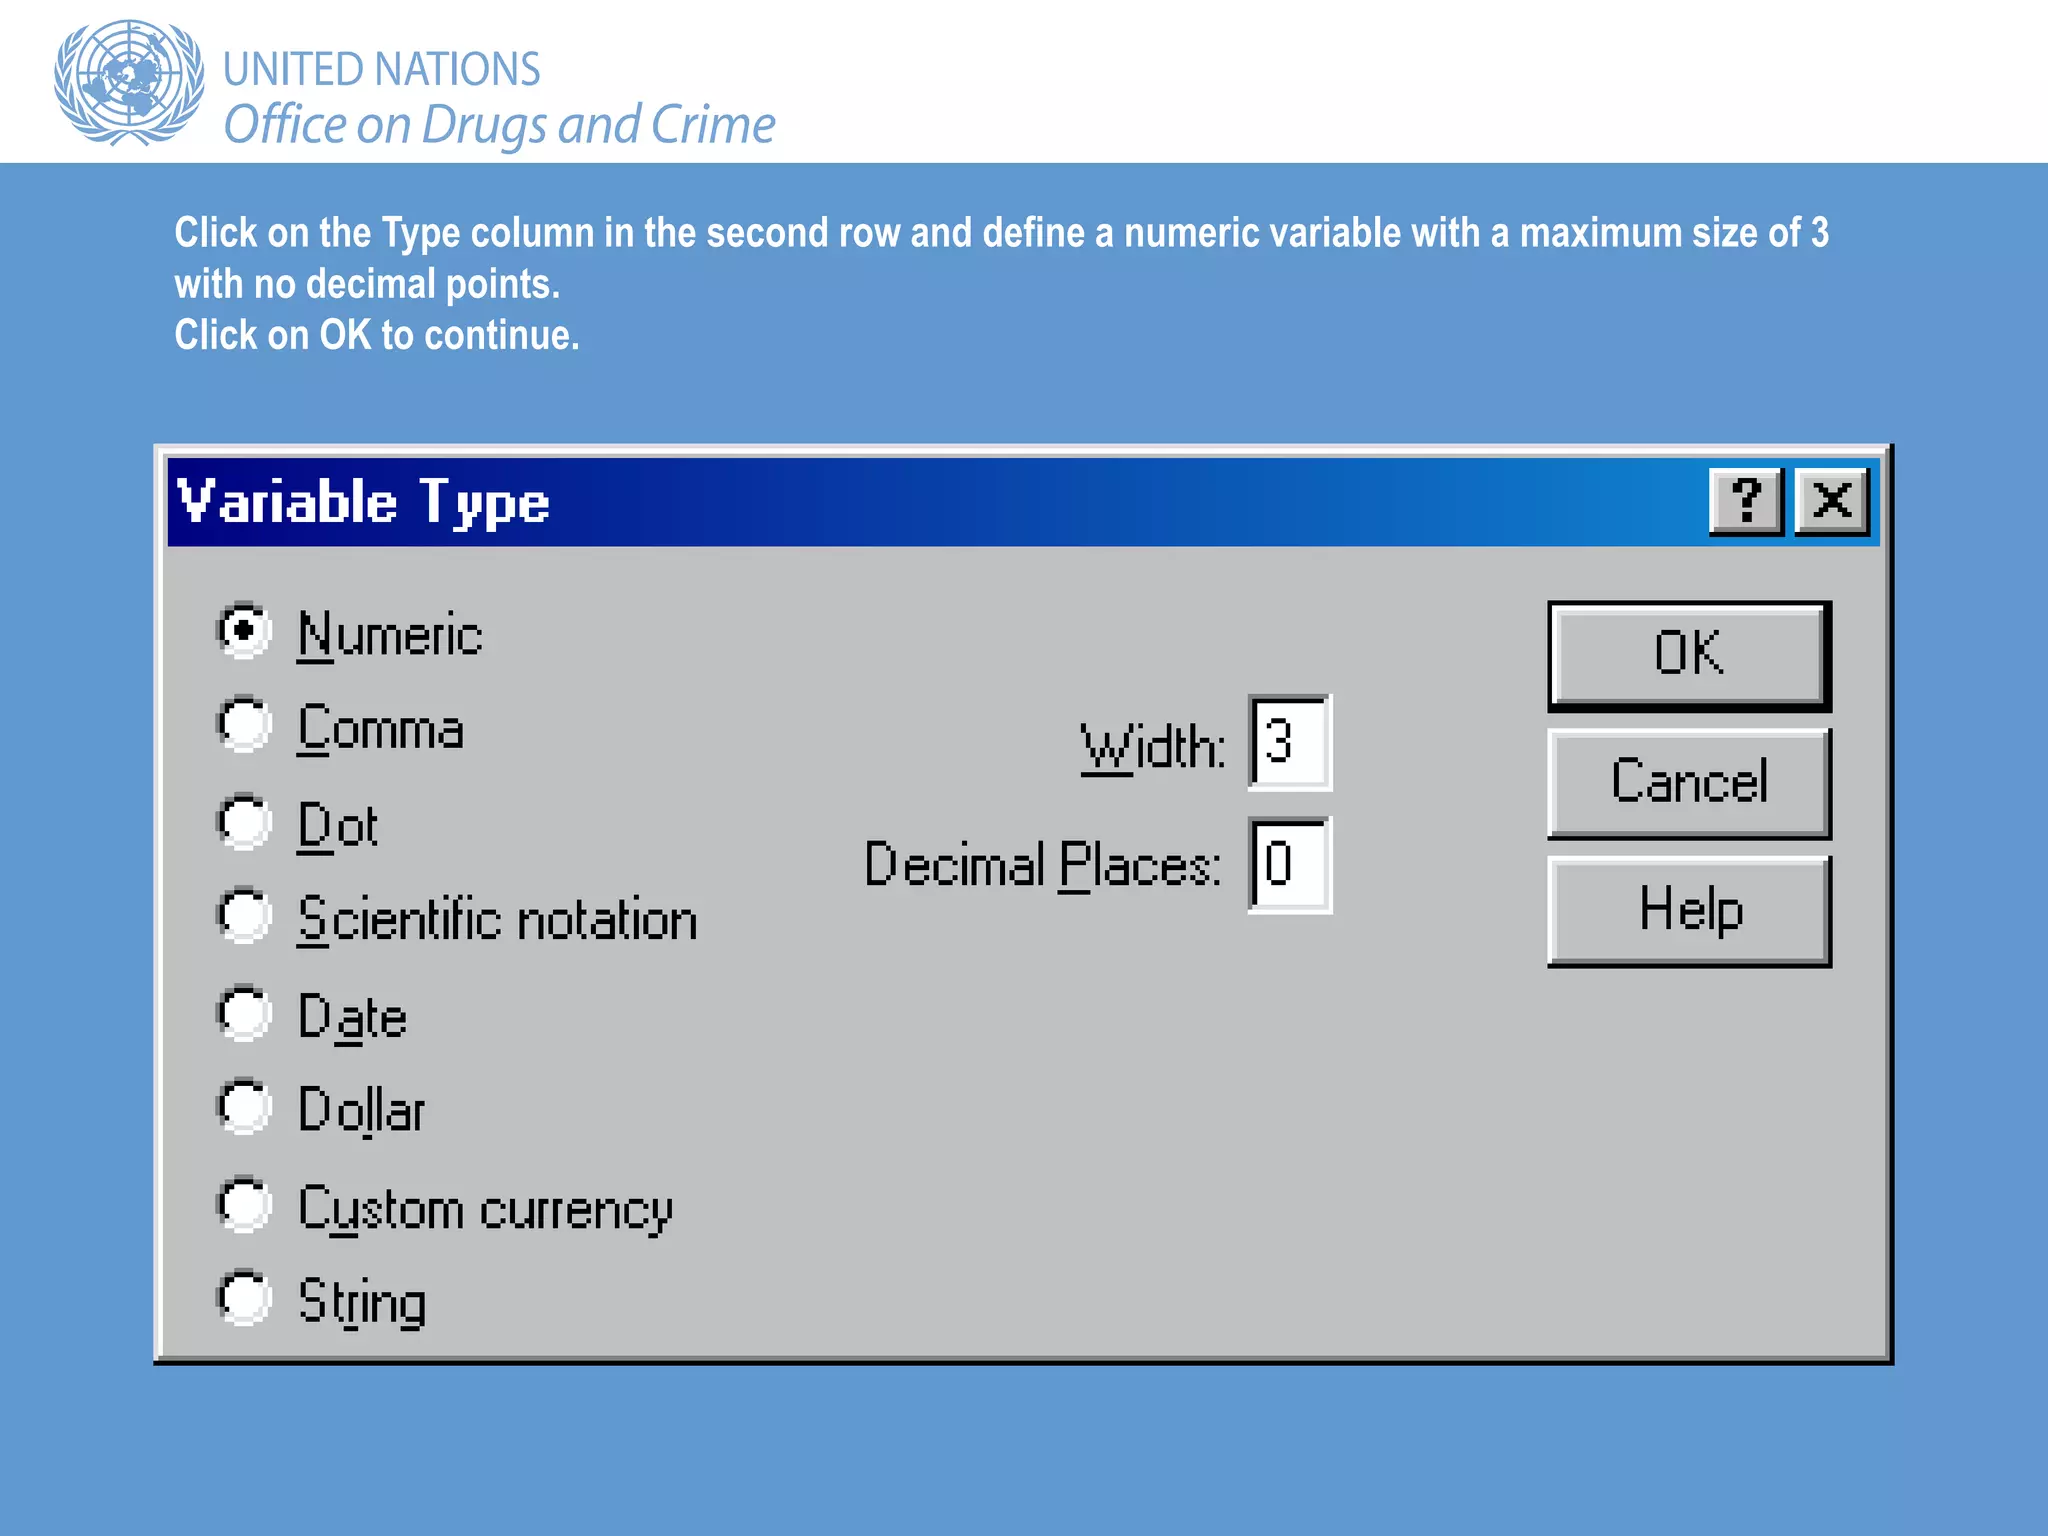
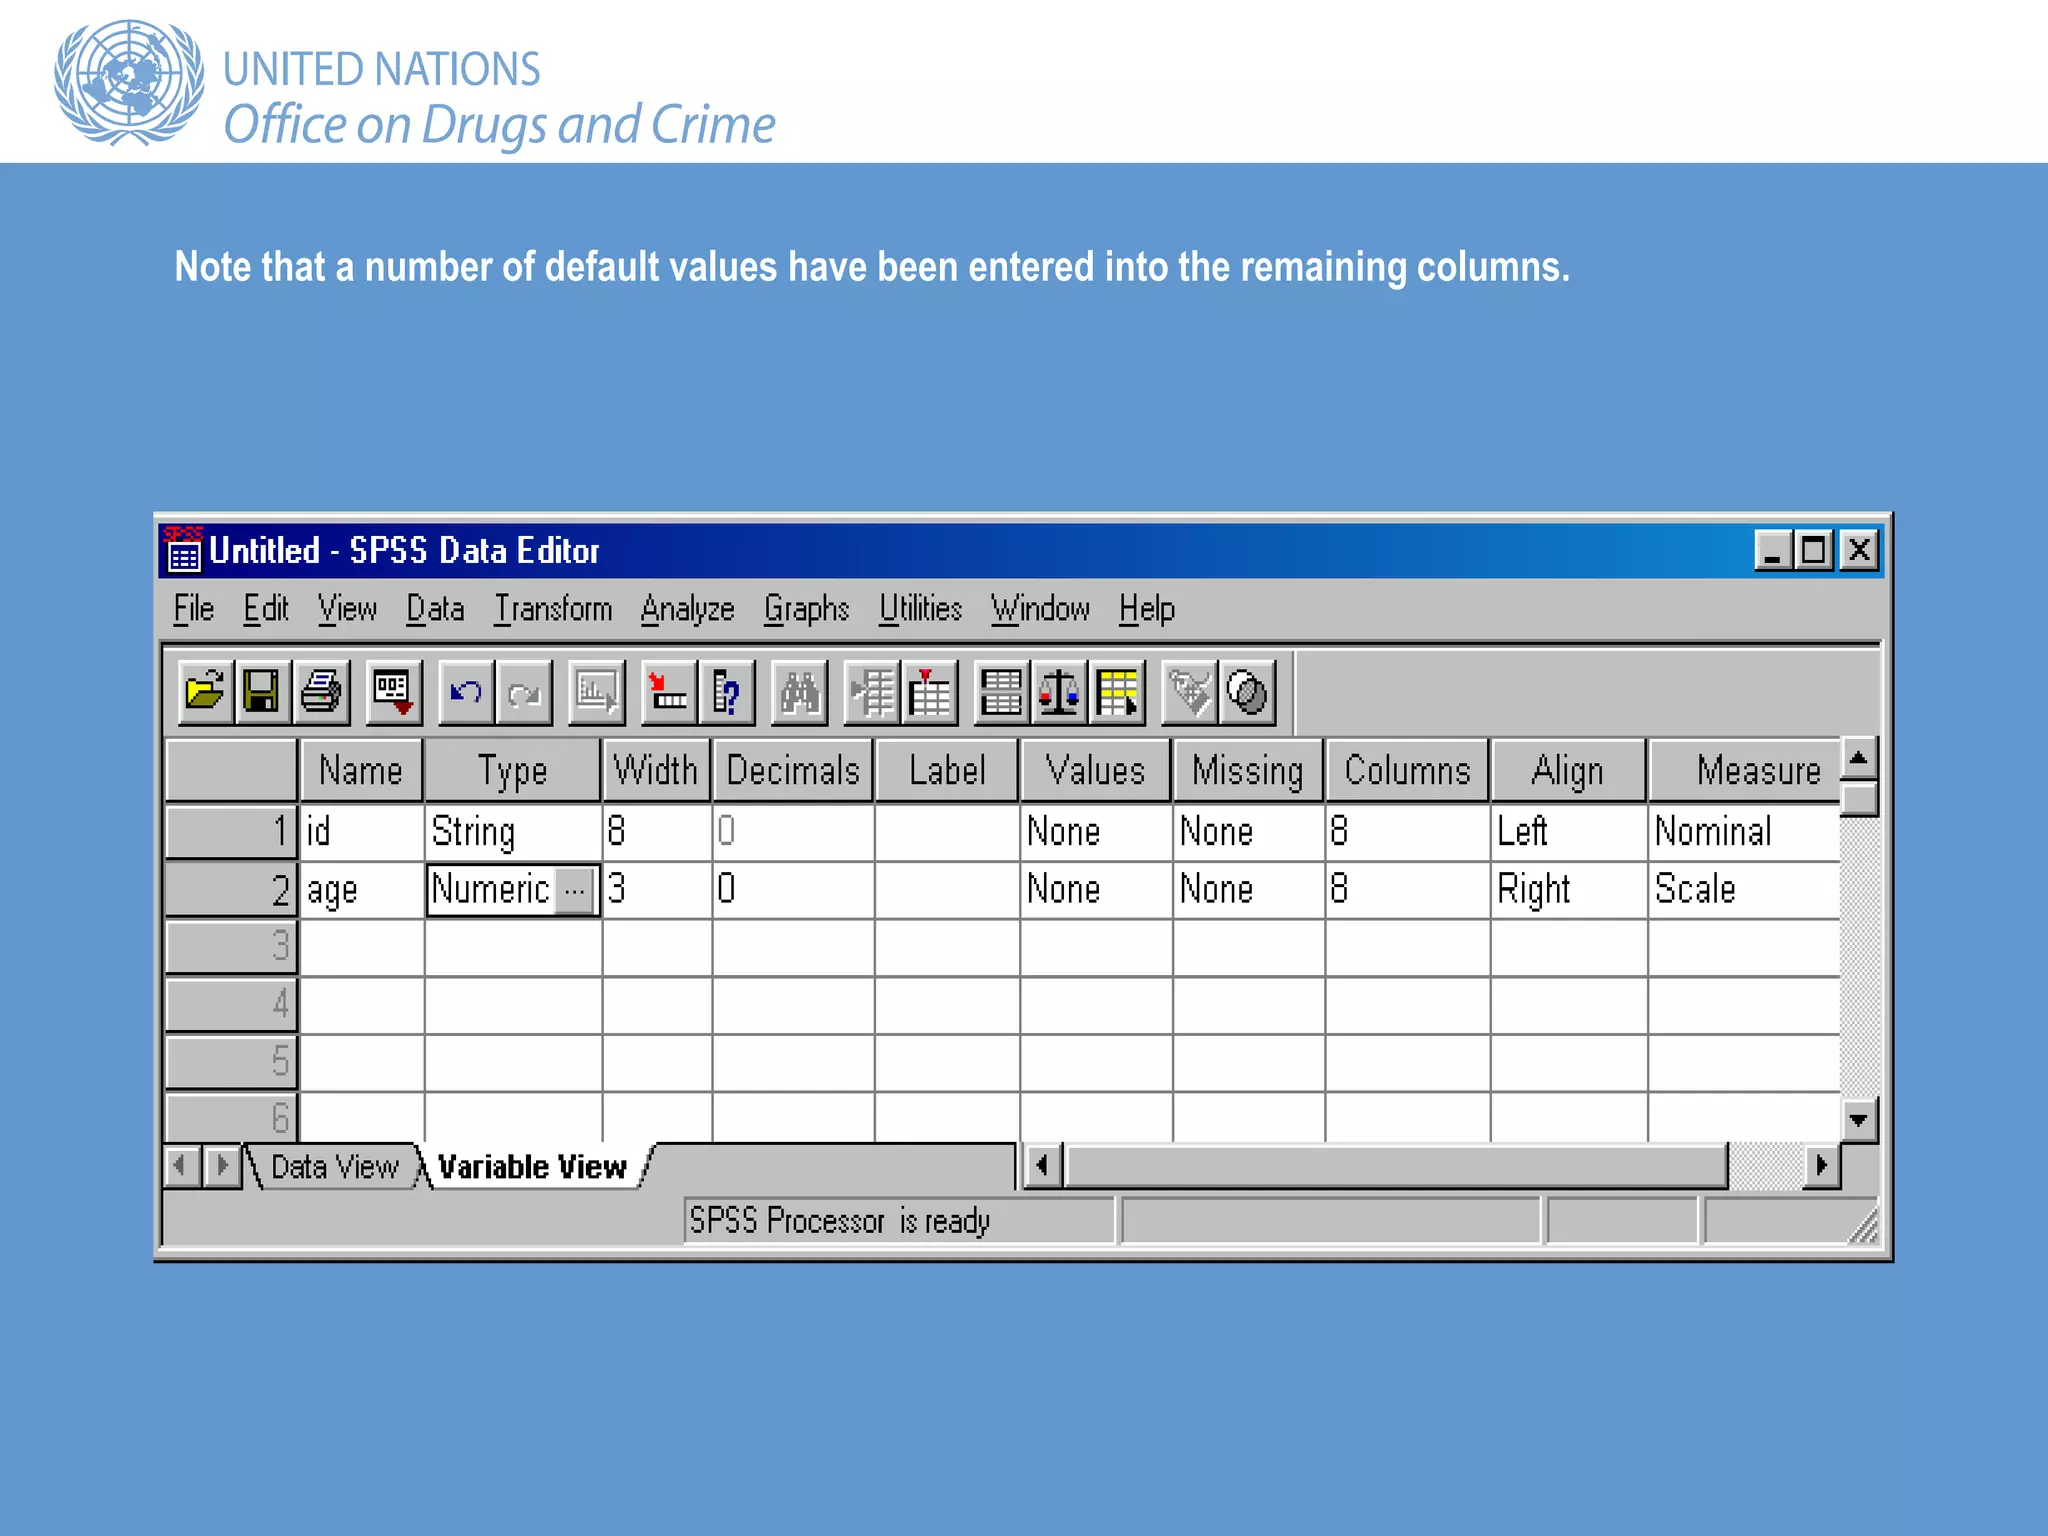
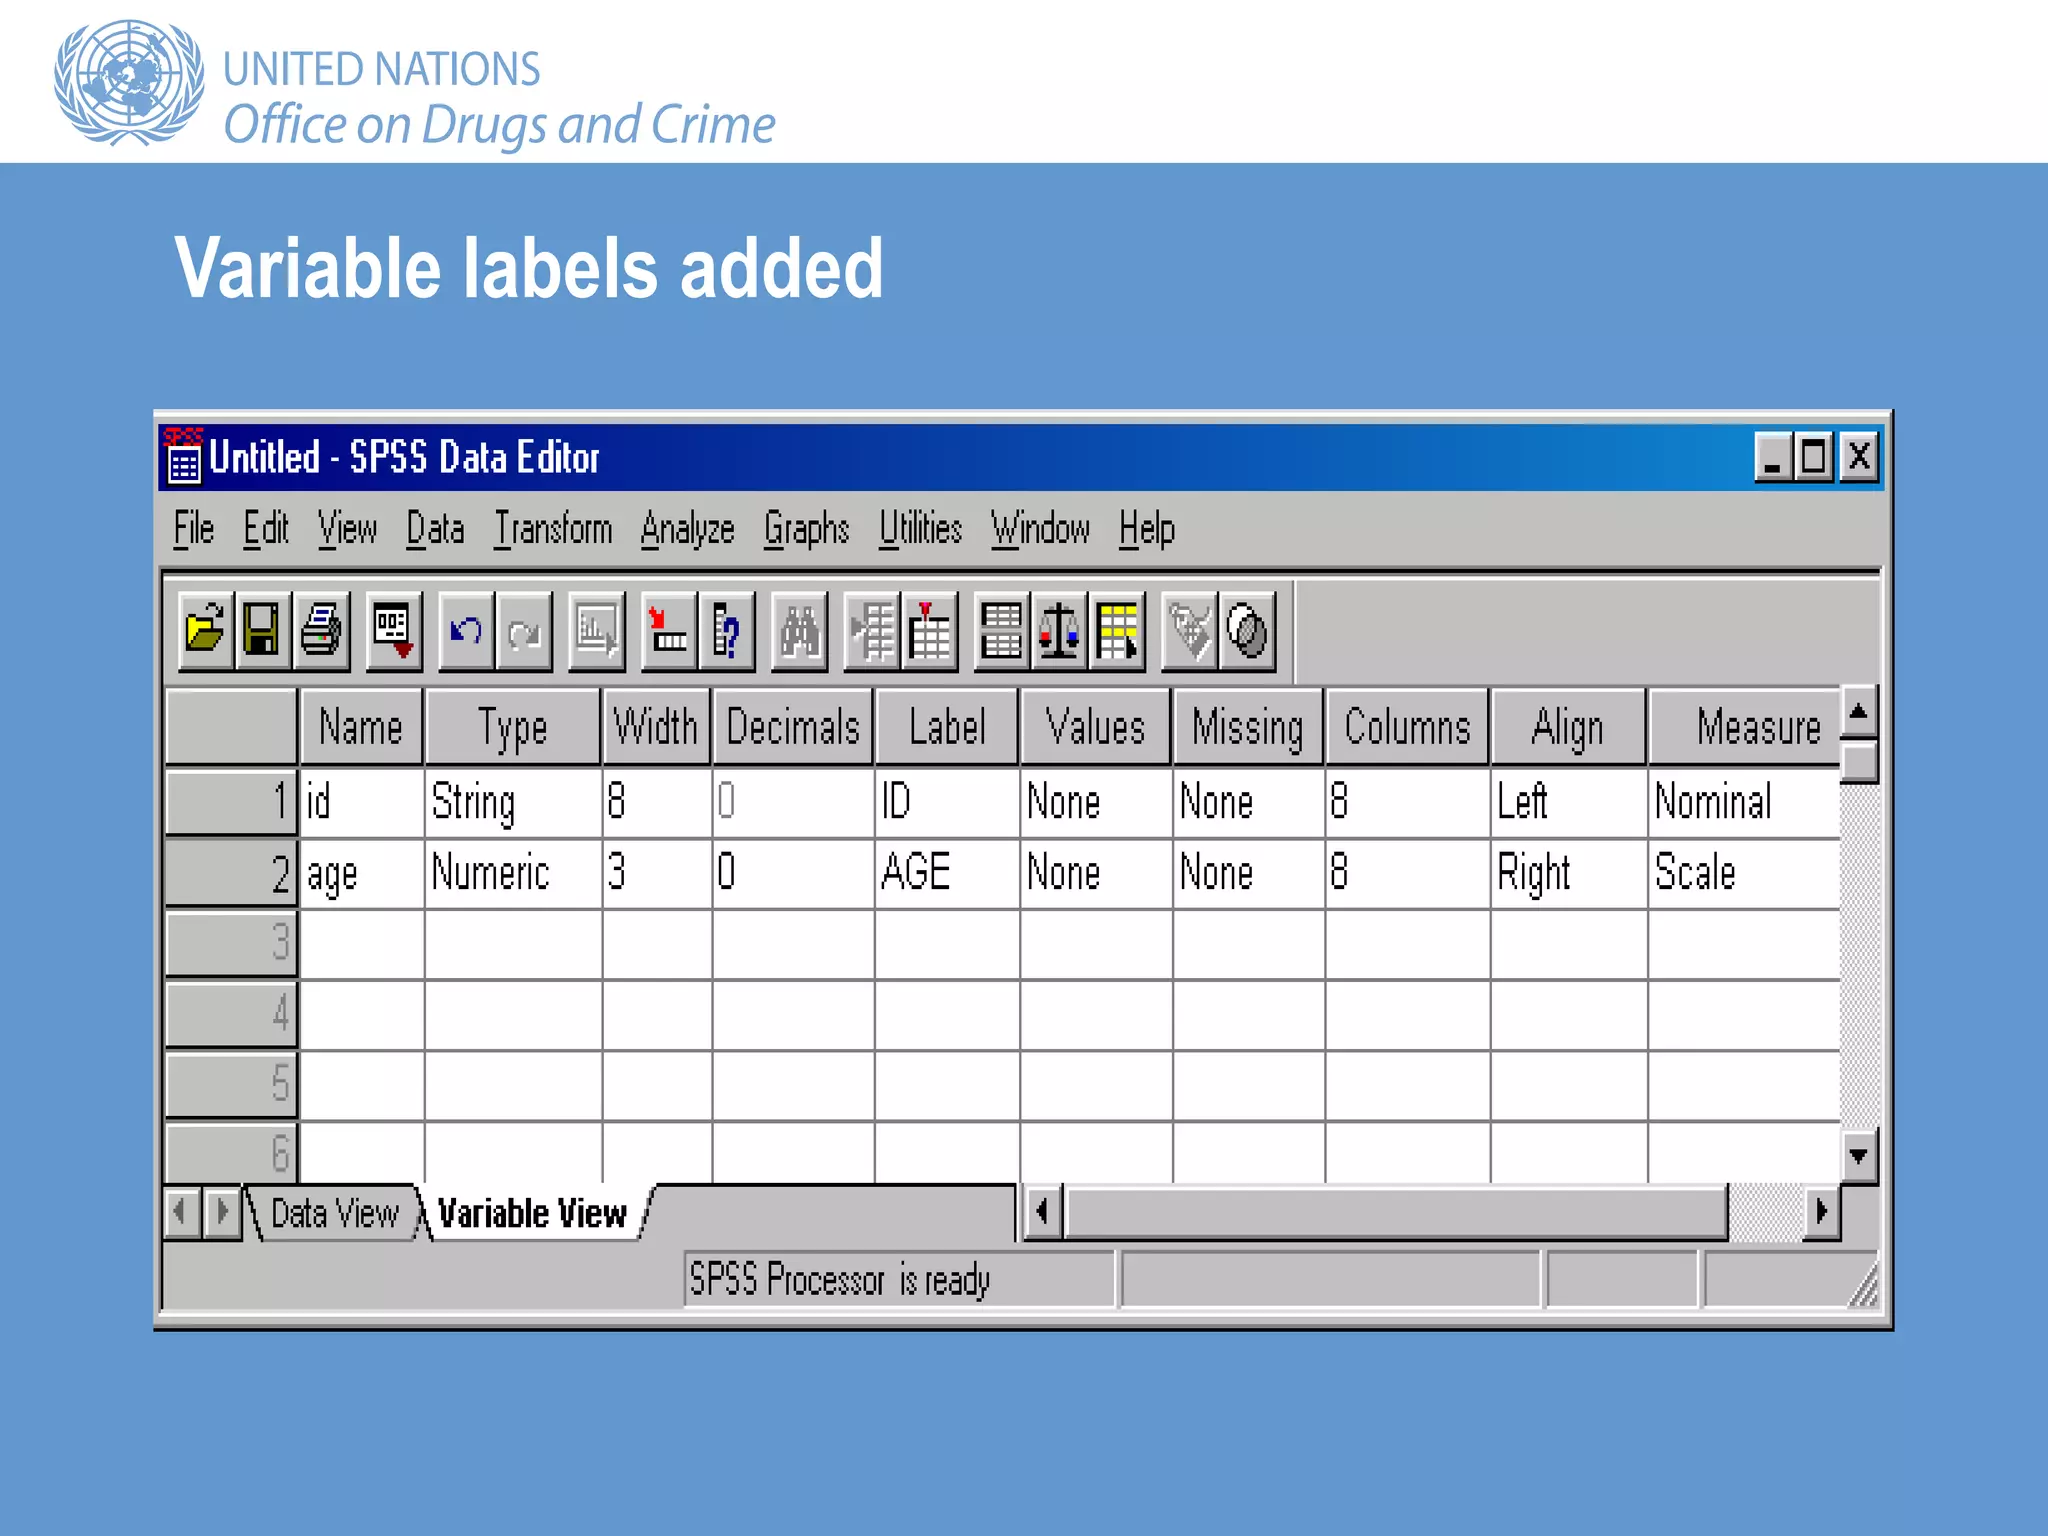
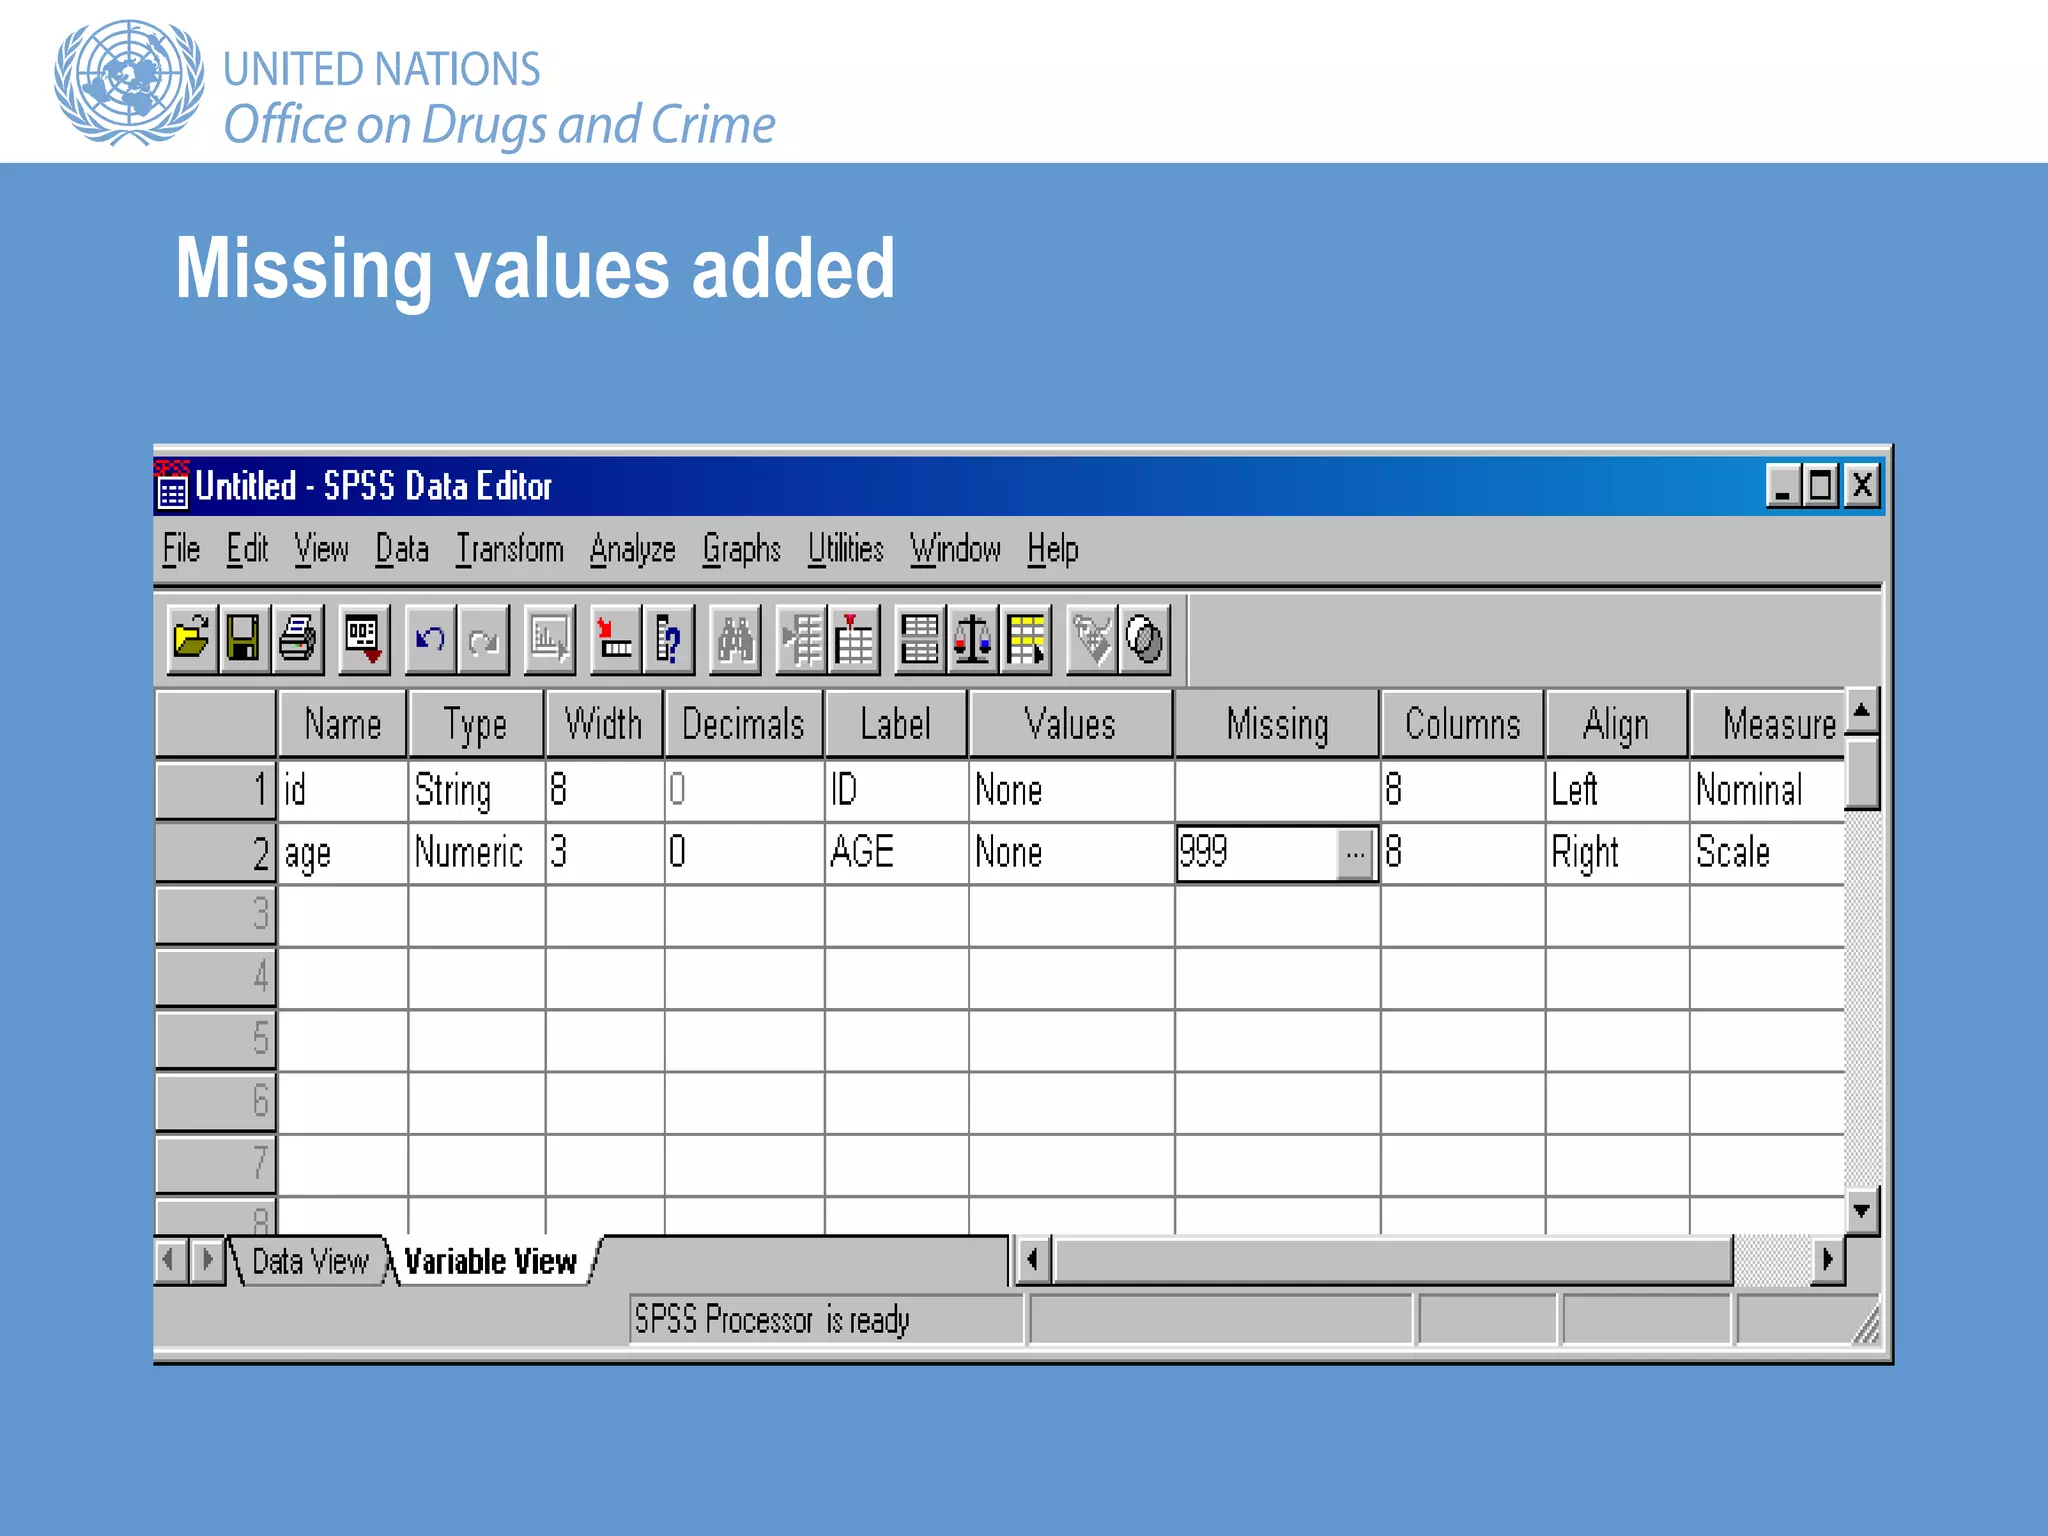
SPSS data entry
Training session 3
GAP Toolkit 5
Training in basic drug abuse data management
and analysis
Objectives
• To describe opening and closing SPSS
• To introduce the look and structure of SPSS
• To introduce the data entry windows: Data View and
Variable View
• To outline the components necessary to define a
variable
• To introduce the SPSS online tutorial
Uses for SPSS
• Data management
• Data analysis
Data management
• Defining variables
• Coding values
• Entering and editing data
• Creating new variables
• Recoding variables
• Selecting cases
Data analysis
• Univariate statistics
• Bivariate statistics
• Multivariate statistics
Opening SPSS
• Double click the SPSS icon on the desktop
OR
• Start/Programs/SPSS for Windows/SPSS**
• The following introductory screen should appear:
The Data View window
View tabs
Status bar/boxes
Cell edit field
Cell information
Data View
• Rows represent cases or observations, that is, the
objects on which data have been collected:
– For example, rows represent the contents of a single
treatment data collection form, the information on an
individual
• Columns represent variables or characteristics of the
object of interest:
– For example, each column contains the answers to the
questions on the treatment data collection form: age, gender,
primary drug of use, etc.
Data Editor
• Data Editor comprises two screens:
– Data View: the previous screen
– Variable View: used to define the variables
• To move between the two:
– Use the View tab at the bottom of the screen
OR
– Ctrl + T
OR
– View/Variables from the Data View window
– View/Data from the Variable View window
Variable View
• Define your variables in Variable View
• Enter the data, the values of the variables, in Data View
The data entry process
Definition of variables
10 characteristics are used to define a variable:
Name Values
Type Missing
Width Column
Decimals Align
Label Measure
Name
• Each variable must have a unique name of not more
than 8 characters and starting with a letter
• Try to give meaningful variable names:
– Describing the characteristic: for example, age
– Linking to the questionnaire: for example, A1Q3
• Keep the names consistent across files
Type
• Internal formats:
– Numeric
– String (alphanumeric)
– Date
• Output formats:
– Comma
– Dot
– Scientific notation
– Dollar
– Custom currency
Numeric
• Numeric variables:
– Numeric measurements
– Codes
• Definition of the size of the variable
String (alphanumeric)
• String variables contain words or characters; strings can
include numbers but, taken here as characters,
mathematical operations cannot be applied to them
• The maximum size of a string variable is 255 characters
Date
• The input format for date variables must be defined,
such as DD/MM/YYYY, MM/DD/YYYY or MM/DD/YY
• Computers store dates as numbers from a base date; in
SPSS, dates are stored as the number of seconds from
14 October 1582
Example
• Create two variables:
– ID: the unique identifier, which will be alphanumeric with a
maximum of 8 characters
– Age: the age of the respondent measured in years, a
discrete variable ranging between 10 and 100
Click here
Click on the String radio button and change the characters to the size of the variable, 8 in this case.
Click OK.
Click on the Type column in the second row and define a numeric variable with a maximum size of 3
with no decimal points.
Click on OK to continue.
Note that a number of default values have been entered into the remaining columns.
Labels
• Descriptors for the variables
• Maximum 255 characters
• Used in the output
Variable labels added
Values
• Value labels are descriptors of the categories of a
variable
• Coding
Missing
• Defines missing values
• The values are excluded from some analysis
• Options:
– Up to 3 discrete missing values
– A range of missing values plus one discrete missing value
Click in the Missing Values column to obtain the dialogue box below. Enter the value 999 for Age.
Missing values added
Columns and Align
• Columns sets the amount of space reserved to display
the contents of the variable in Data View; generally the
default value is adequate
• Align sets whether the contents of the variable appear
on the left, centre or right of the cell in Data View
• Numeric variables are right-hand justified by default and
string variables left-hand justified by default; the
defaults are generally adequate
Measure
• Levels of measurement:
– Nominal
– Ordinal
– Interval
– Ratio
• In SPSS, interval and ratio are designated together as
Scale
• The default for string variables is Nominal
• The default for numeric variables is Scale
Returning to Data View, the first two column headings will reflect the two variables created: ID and
Age. Here the first six observations have been entered.
Exercise: define the necessary variables and enter the following data
Saving the file
• The file must always be saved in order to save the work
that has been done to date:
– File/Save
– Move to the target directory
– Enter a file name
– Save
Summary
• Data Editor
– Data View
– Variable View
• File/Save
• Variable definition
– Name
– Type
– Width
– Decimals
– Label
– Values
– Missing
– Columns
– Align
– Measure

trs-3.ppt

  • 1.
    SPSS data entry Trainingsession 3 GAP Toolkit 5 Training in basic drug abuse data management and analysis
  • 2.
    Objectives • To describeopening and closing SPSS • To introduce the look and structure of SPSS • To introduce the data entry windows: Data View and Variable View • To outline the components necessary to define a variable • To introduce the SPSS online tutorial
  • 3.
    Uses for SPSS •Data management • Data analysis
  • 4.
    Data management • Definingvariables • Coding values • Entering and editing data • Creating new variables • Recoding variables • Selecting cases
  • 5.
    Data analysis • Univariatestatistics • Bivariate statistics • Multivariate statistics
  • 6.
    Opening SPSS • Doubleclick the SPSS icon on the desktop OR • Start/Programs/SPSS for Windows/SPSS** • The following introductory screen should appear:
  • 8.
    The Data Viewwindow View tabs Status bar/boxes Cell edit field Cell information
  • 9.
    Data View • Rowsrepresent cases or observations, that is, the objects on which data have been collected: – For example, rows represent the contents of a single treatment data collection form, the information on an individual • Columns represent variables or characteristics of the object of interest: – For example, each column contains the answers to the questions on the treatment data collection form: age, gender, primary drug of use, etc.
  • 10.
    Data Editor • DataEditor comprises two screens: – Data View: the previous screen – Variable View: used to define the variables • To move between the two: – Use the View tab at the bottom of the screen OR – Ctrl + T OR – View/Variables from the Data View window – View/Data from the Variable View window
  • 11.
  • 12.
    • Define yourvariables in Variable View • Enter the data, the values of the variables, in Data View The data entry process
  • 13.
    Definition of variables 10characteristics are used to define a variable: Name Values Type Missing Width Column Decimals Align Label Measure
  • 14.
    Name • Each variablemust have a unique name of not more than 8 characters and starting with a letter • Try to give meaningful variable names: – Describing the characteristic: for example, age – Linking to the questionnaire: for example, A1Q3 • Keep the names consistent across files
  • 15.
    Type • Internal formats: –Numeric – String (alphanumeric) – Date • Output formats: – Comma – Dot – Scientific notation – Dollar – Custom currency
  • 16.
    Numeric • Numeric variables: –Numeric measurements – Codes • Definition of the size of the variable
  • 17.
    String (alphanumeric) • Stringvariables contain words or characters; strings can include numbers but, taken here as characters, mathematical operations cannot be applied to them • The maximum size of a string variable is 255 characters
  • 18.
    Date • The inputformat for date variables must be defined, such as DD/MM/YYYY, MM/DD/YYYY or MM/DD/YY • Computers store dates as numbers from a base date; in SPSS, dates are stored as the number of seconds from 14 October 1582
  • 19.
    Example • Create twovariables: – ID: the unique identifier, which will be alphanumeric with a maximum of 8 characters – Age: the age of the respondent measured in years, a discrete variable ranging between 10 and 100
  • 21.
  • 22.
    Click on theString radio button and change the characters to the size of the variable, 8 in this case. Click OK.
  • 23.
    Click on theType column in the second row and define a numeric variable with a maximum size of 3 with no decimal points. Click on OK to continue.
  • 24.
    Note that anumber of default values have been entered into the remaining columns.
  • 25.
    Labels • Descriptors forthe variables • Maximum 255 characters • Used in the output
  • 26.
  • 27.
    Values • Value labelsare descriptors of the categories of a variable • Coding
  • 28.
    Missing • Defines missingvalues • The values are excluded from some analysis • Options: – Up to 3 discrete missing values – A range of missing values plus one discrete missing value
  • 29.
    Click in theMissing Values column to obtain the dialogue box below. Enter the value 999 for Age.
  • 30.
  • 31.
    Columns and Align •Columns sets the amount of space reserved to display the contents of the variable in Data View; generally the default value is adequate • Align sets whether the contents of the variable appear on the left, centre or right of the cell in Data View • Numeric variables are right-hand justified by default and string variables left-hand justified by default; the defaults are generally adequate
  • 32.
    Measure • Levels ofmeasurement: – Nominal – Ordinal – Interval – Ratio • In SPSS, interval and ratio are designated together as Scale • The default for string variables is Nominal • The default for numeric variables is Scale
  • 33.
    Returning to DataView, the first two column headings will reflect the two variables created: ID and Age. Here the first six observations have been entered.
  • 34.
    Exercise: define thenecessary variables and enter the following data
  • 35.
    Saving the file •The file must always be saved in order to save the work that has been done to date: – File/Save – Move to the target directory – Enter a file name – Save
  • 37.
    Summary • Data Editor –Data View – Variable View • File/Save • Variable definition – Name – Type – Width – Decimals – Label – Values – Missing – Columns – Align – Measure