Downloaded 101 times
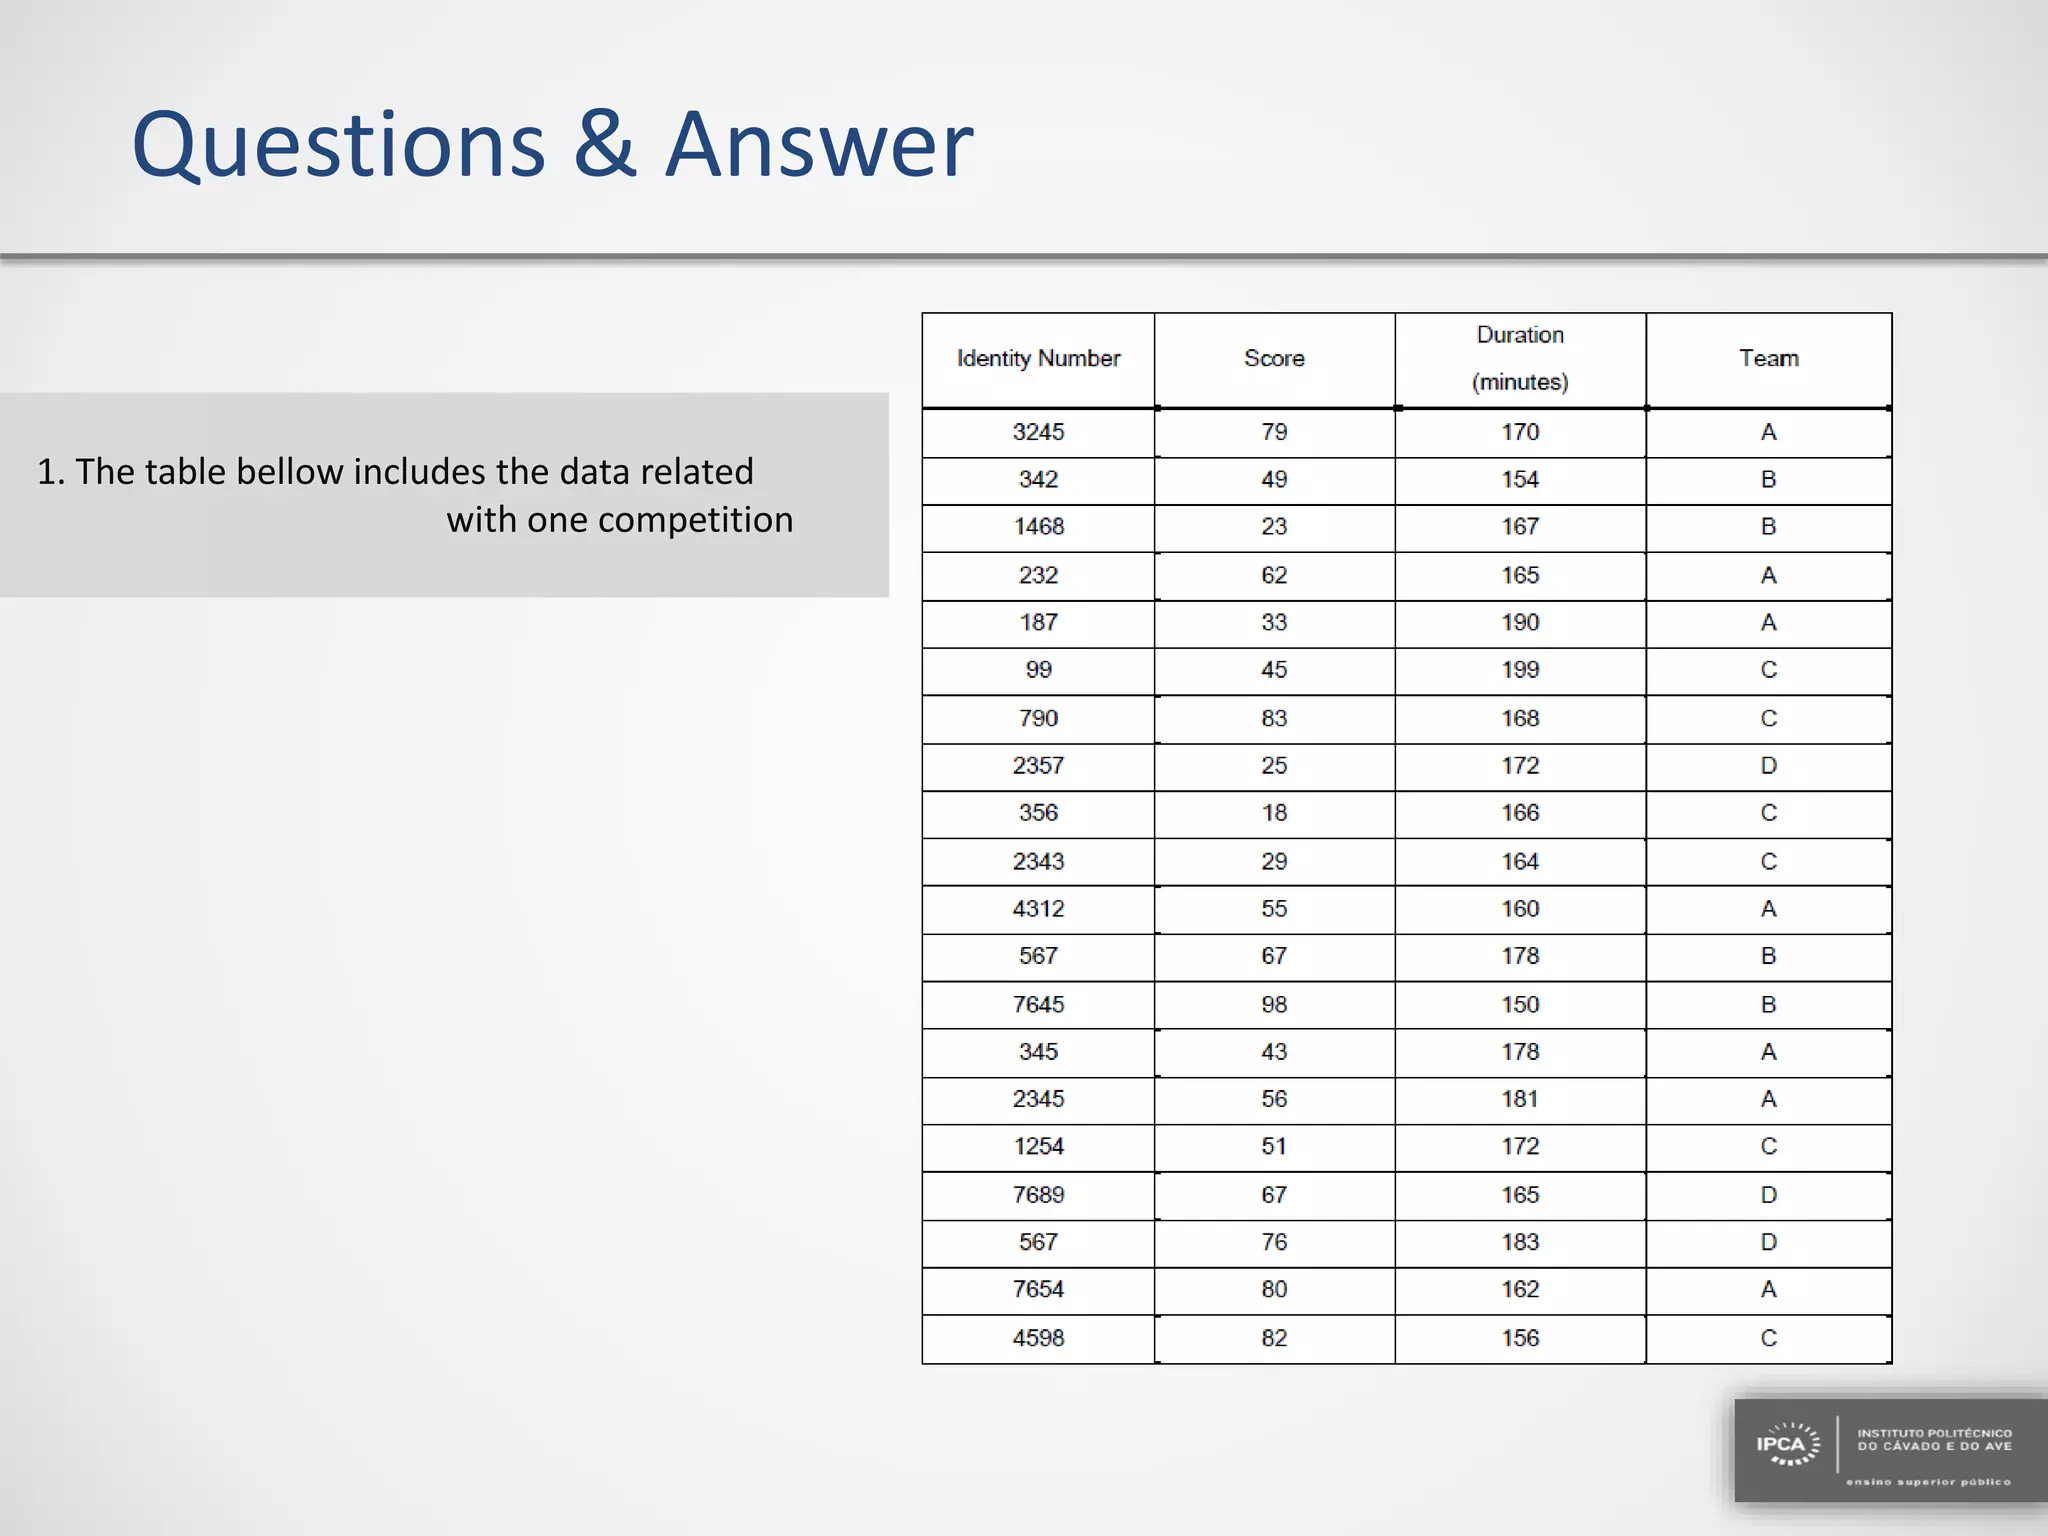
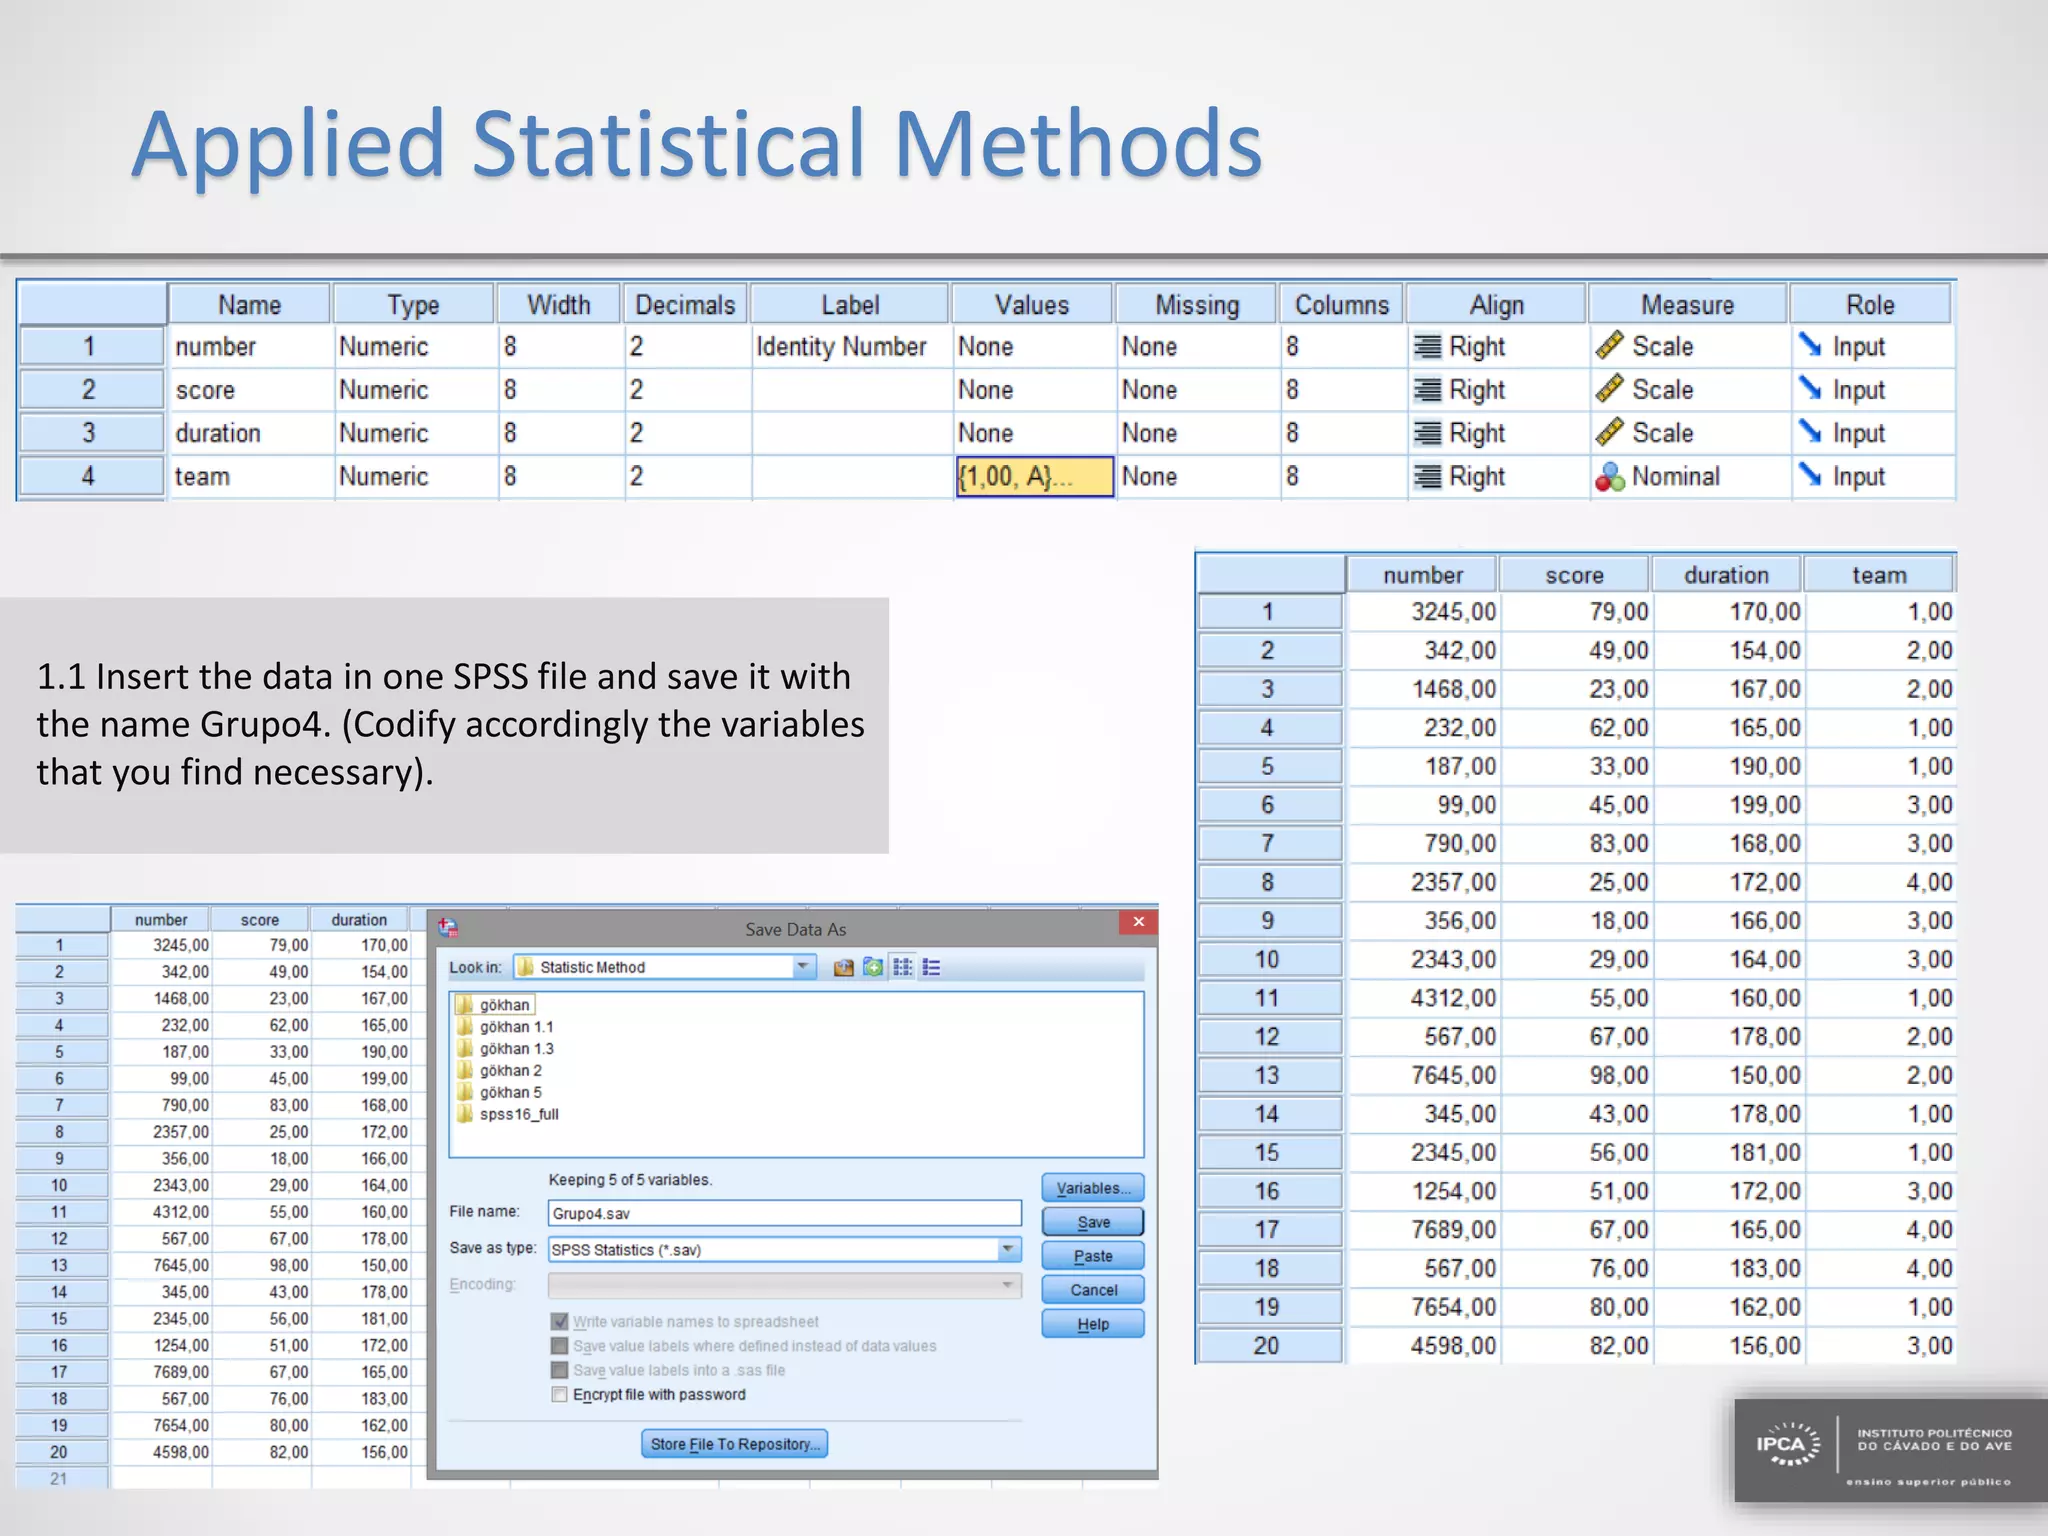
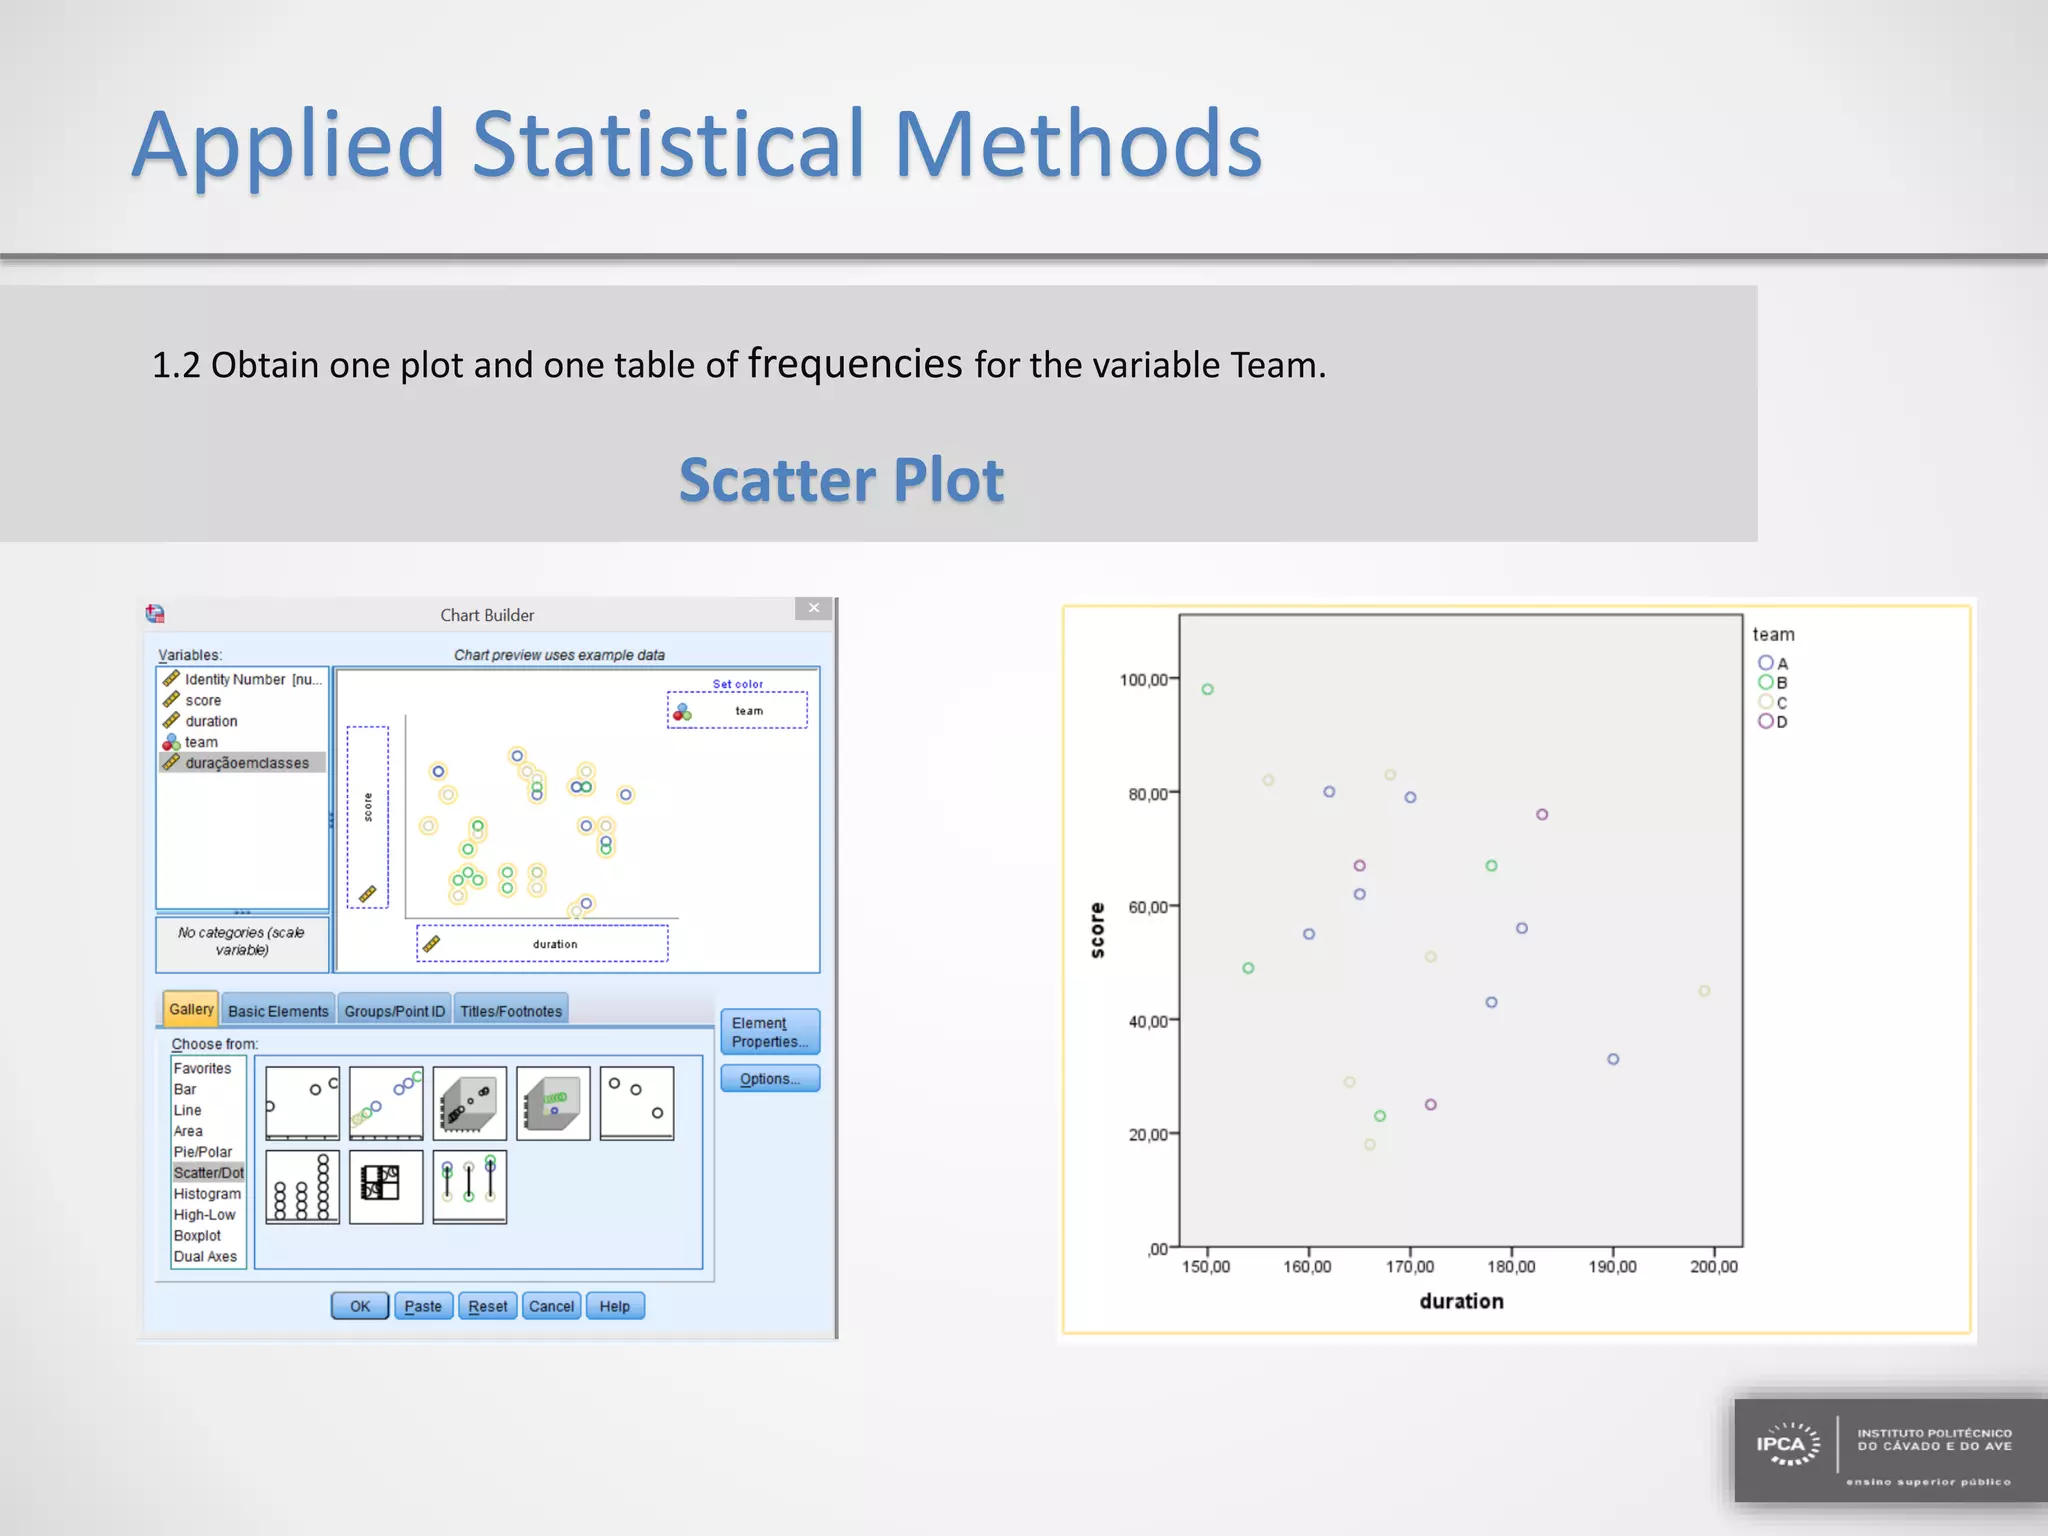
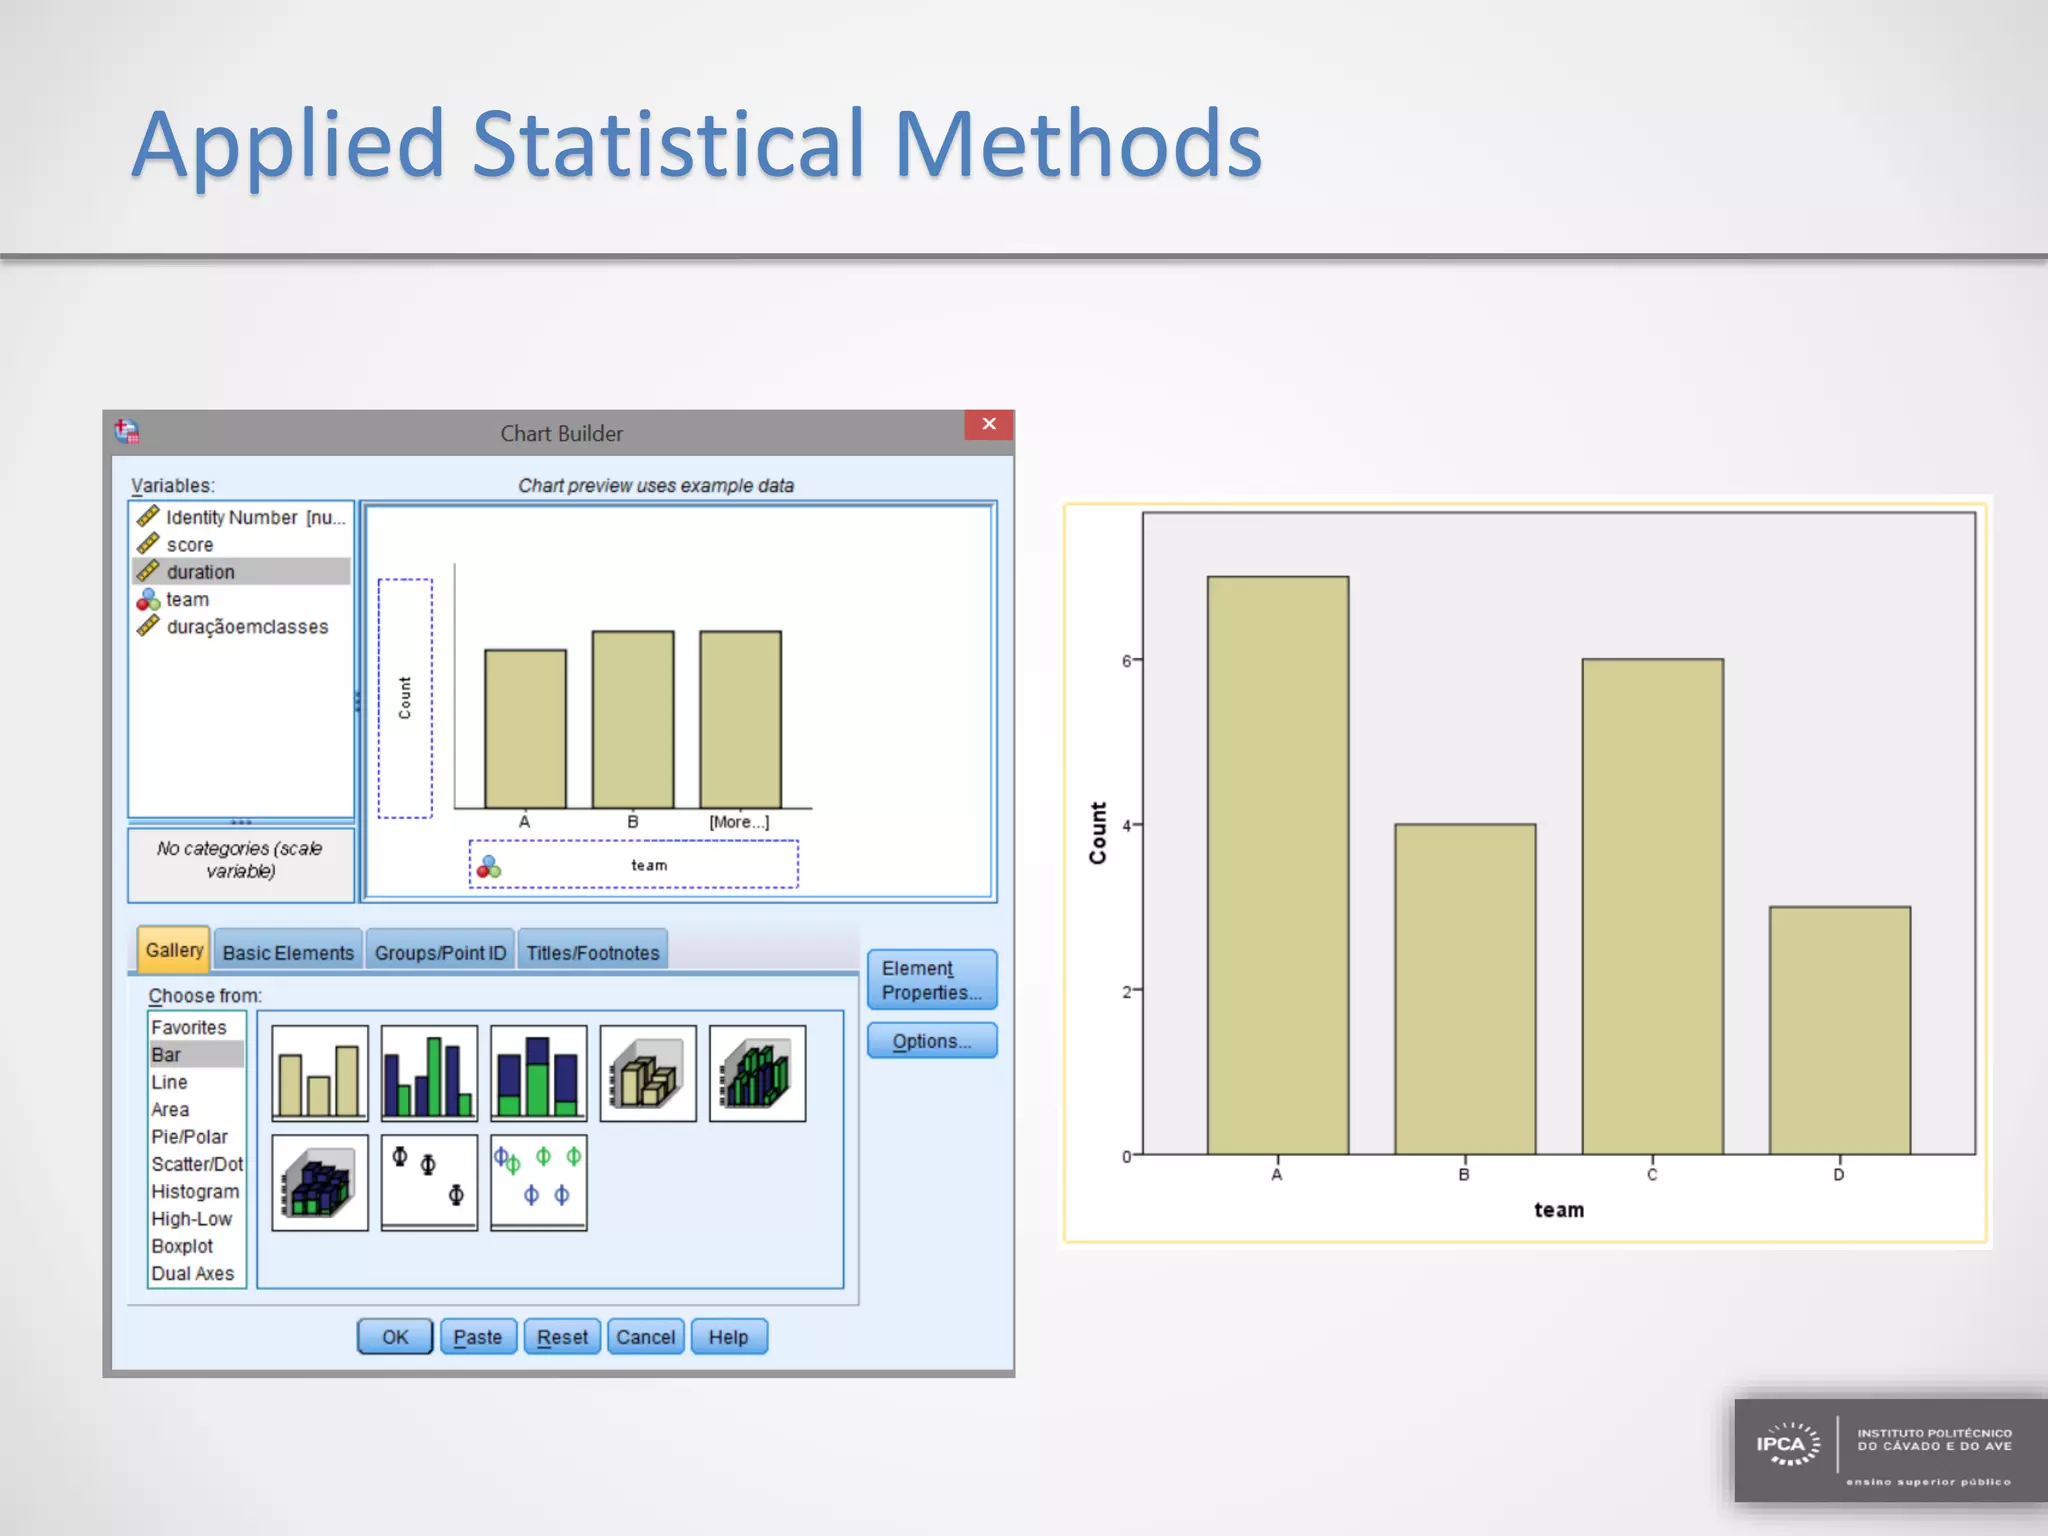
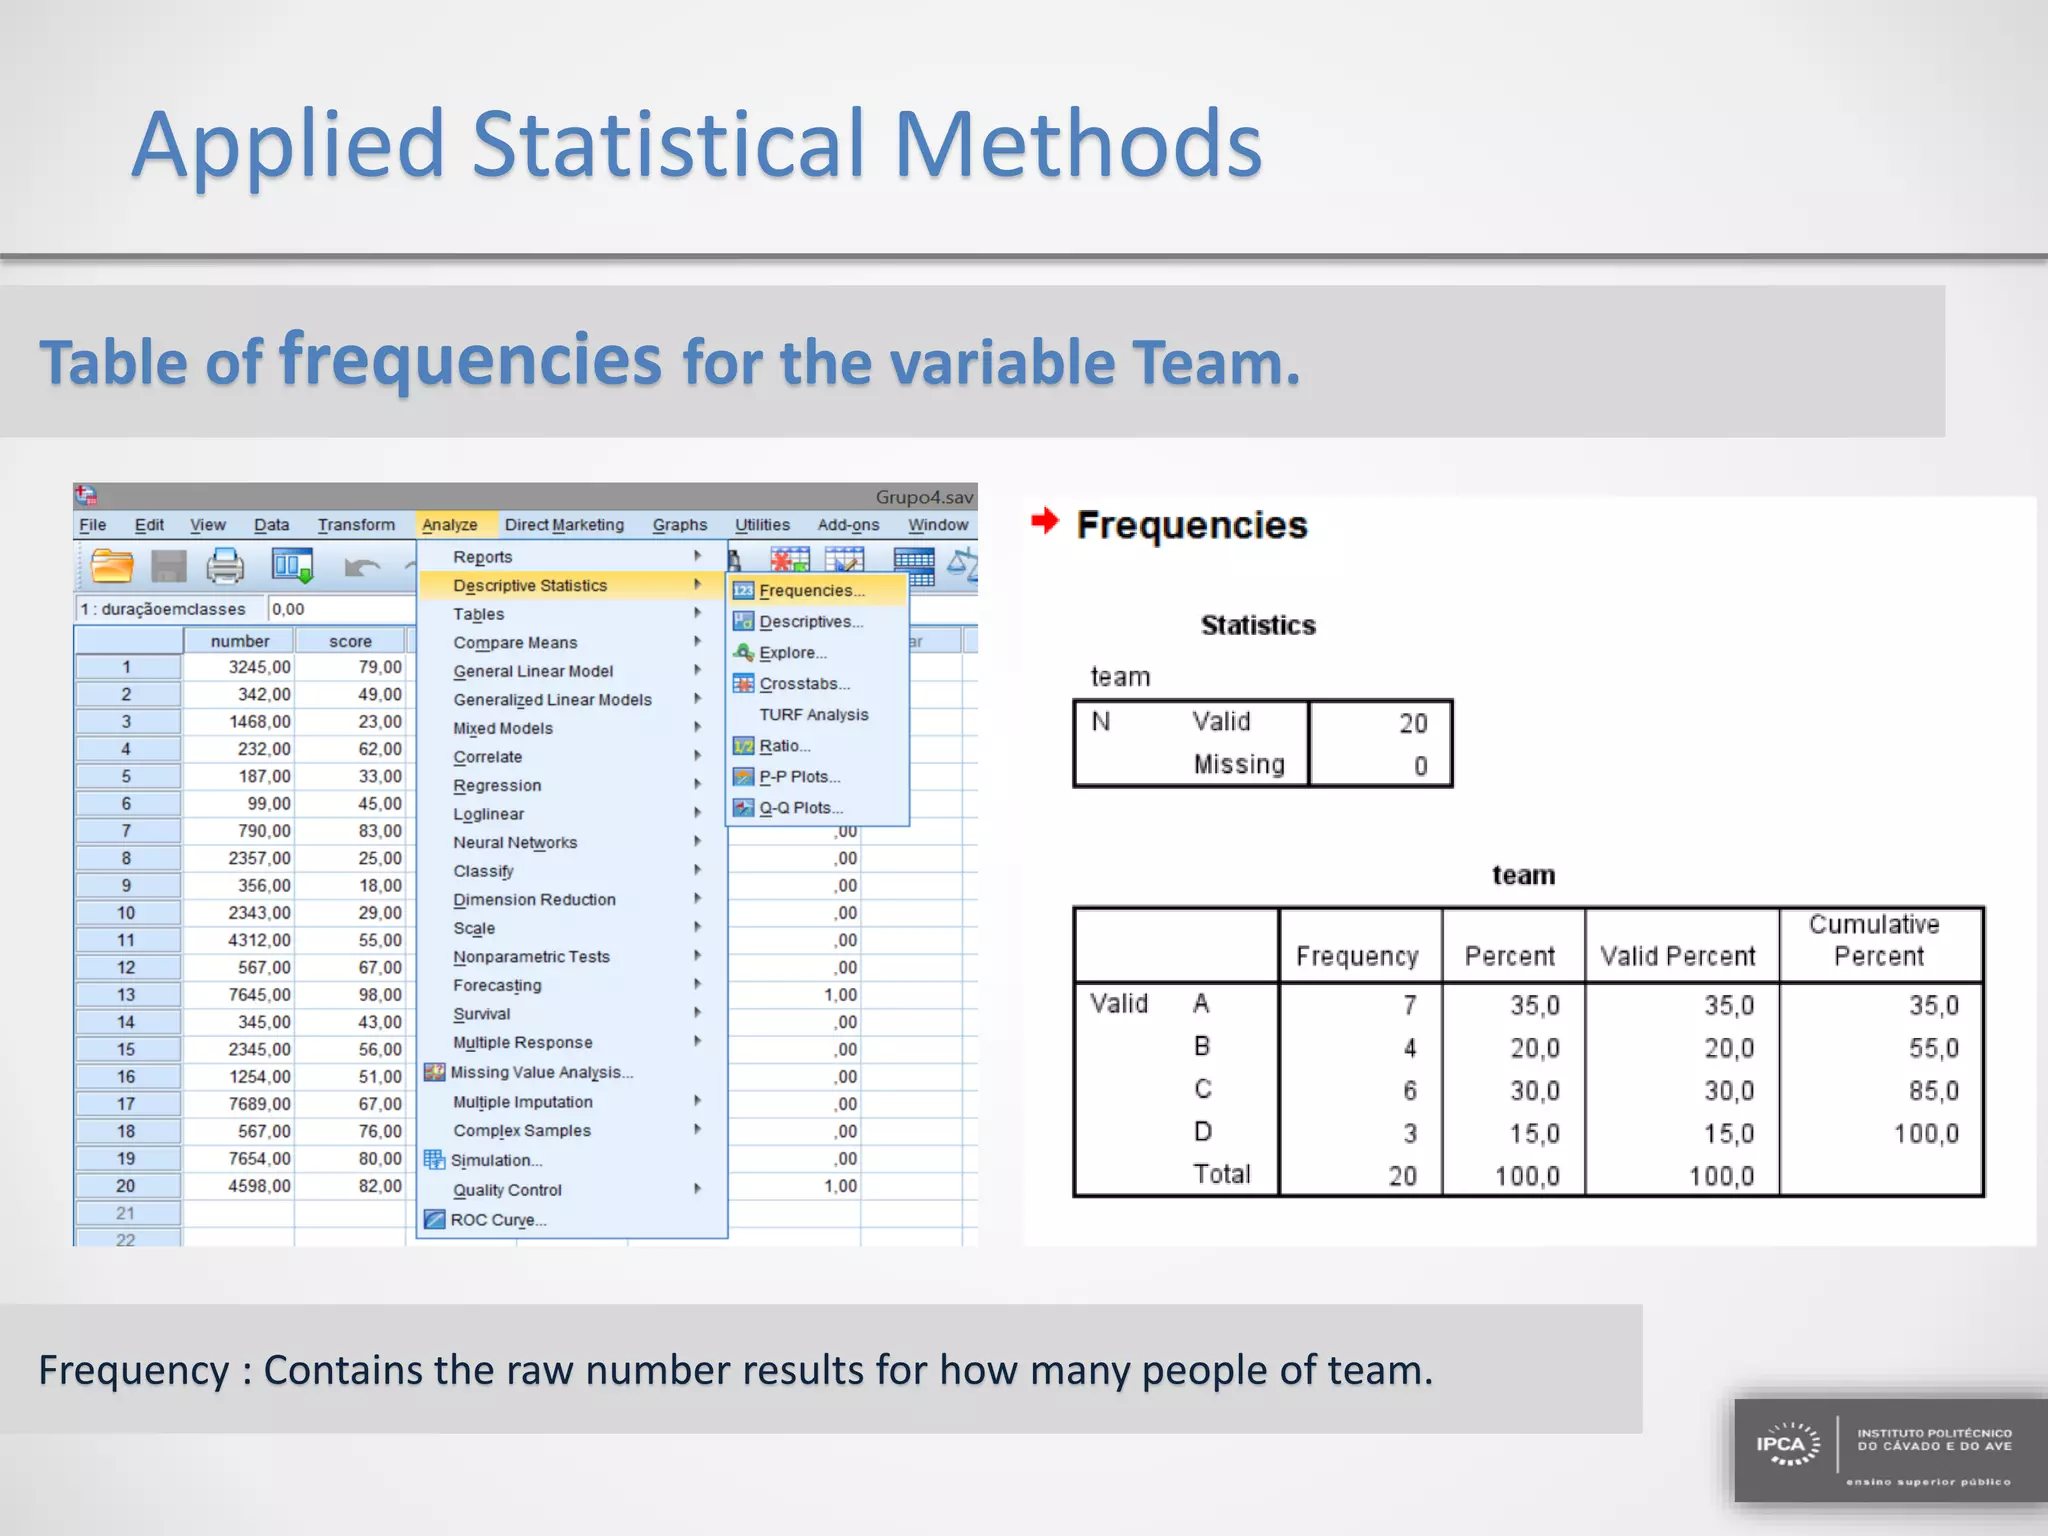
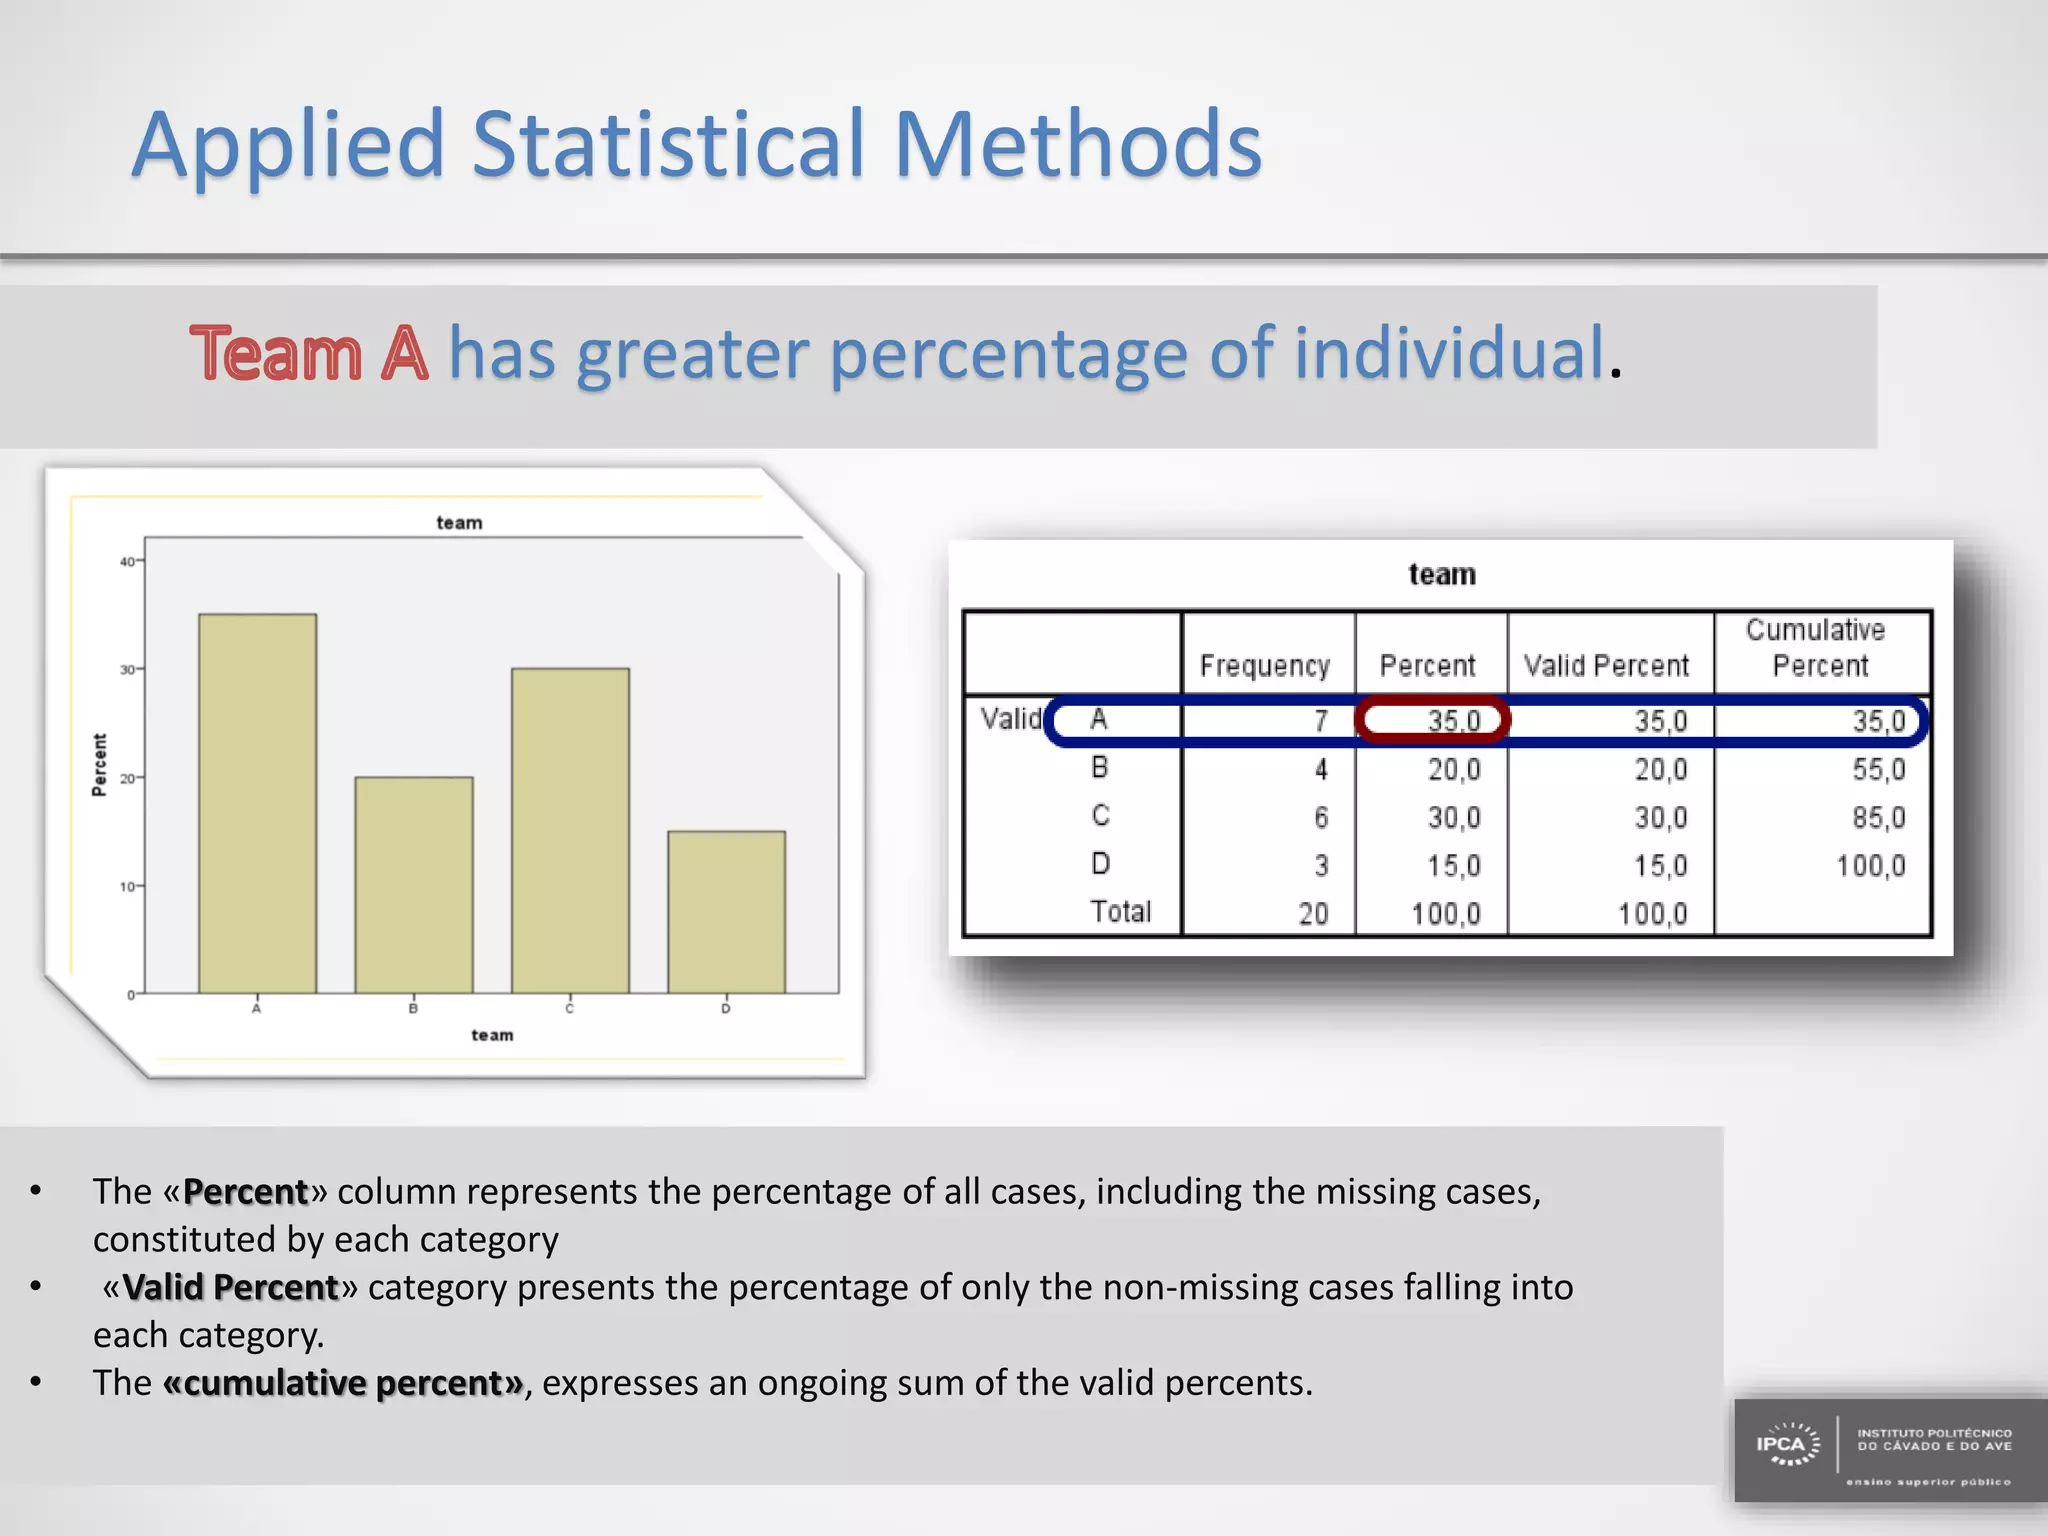
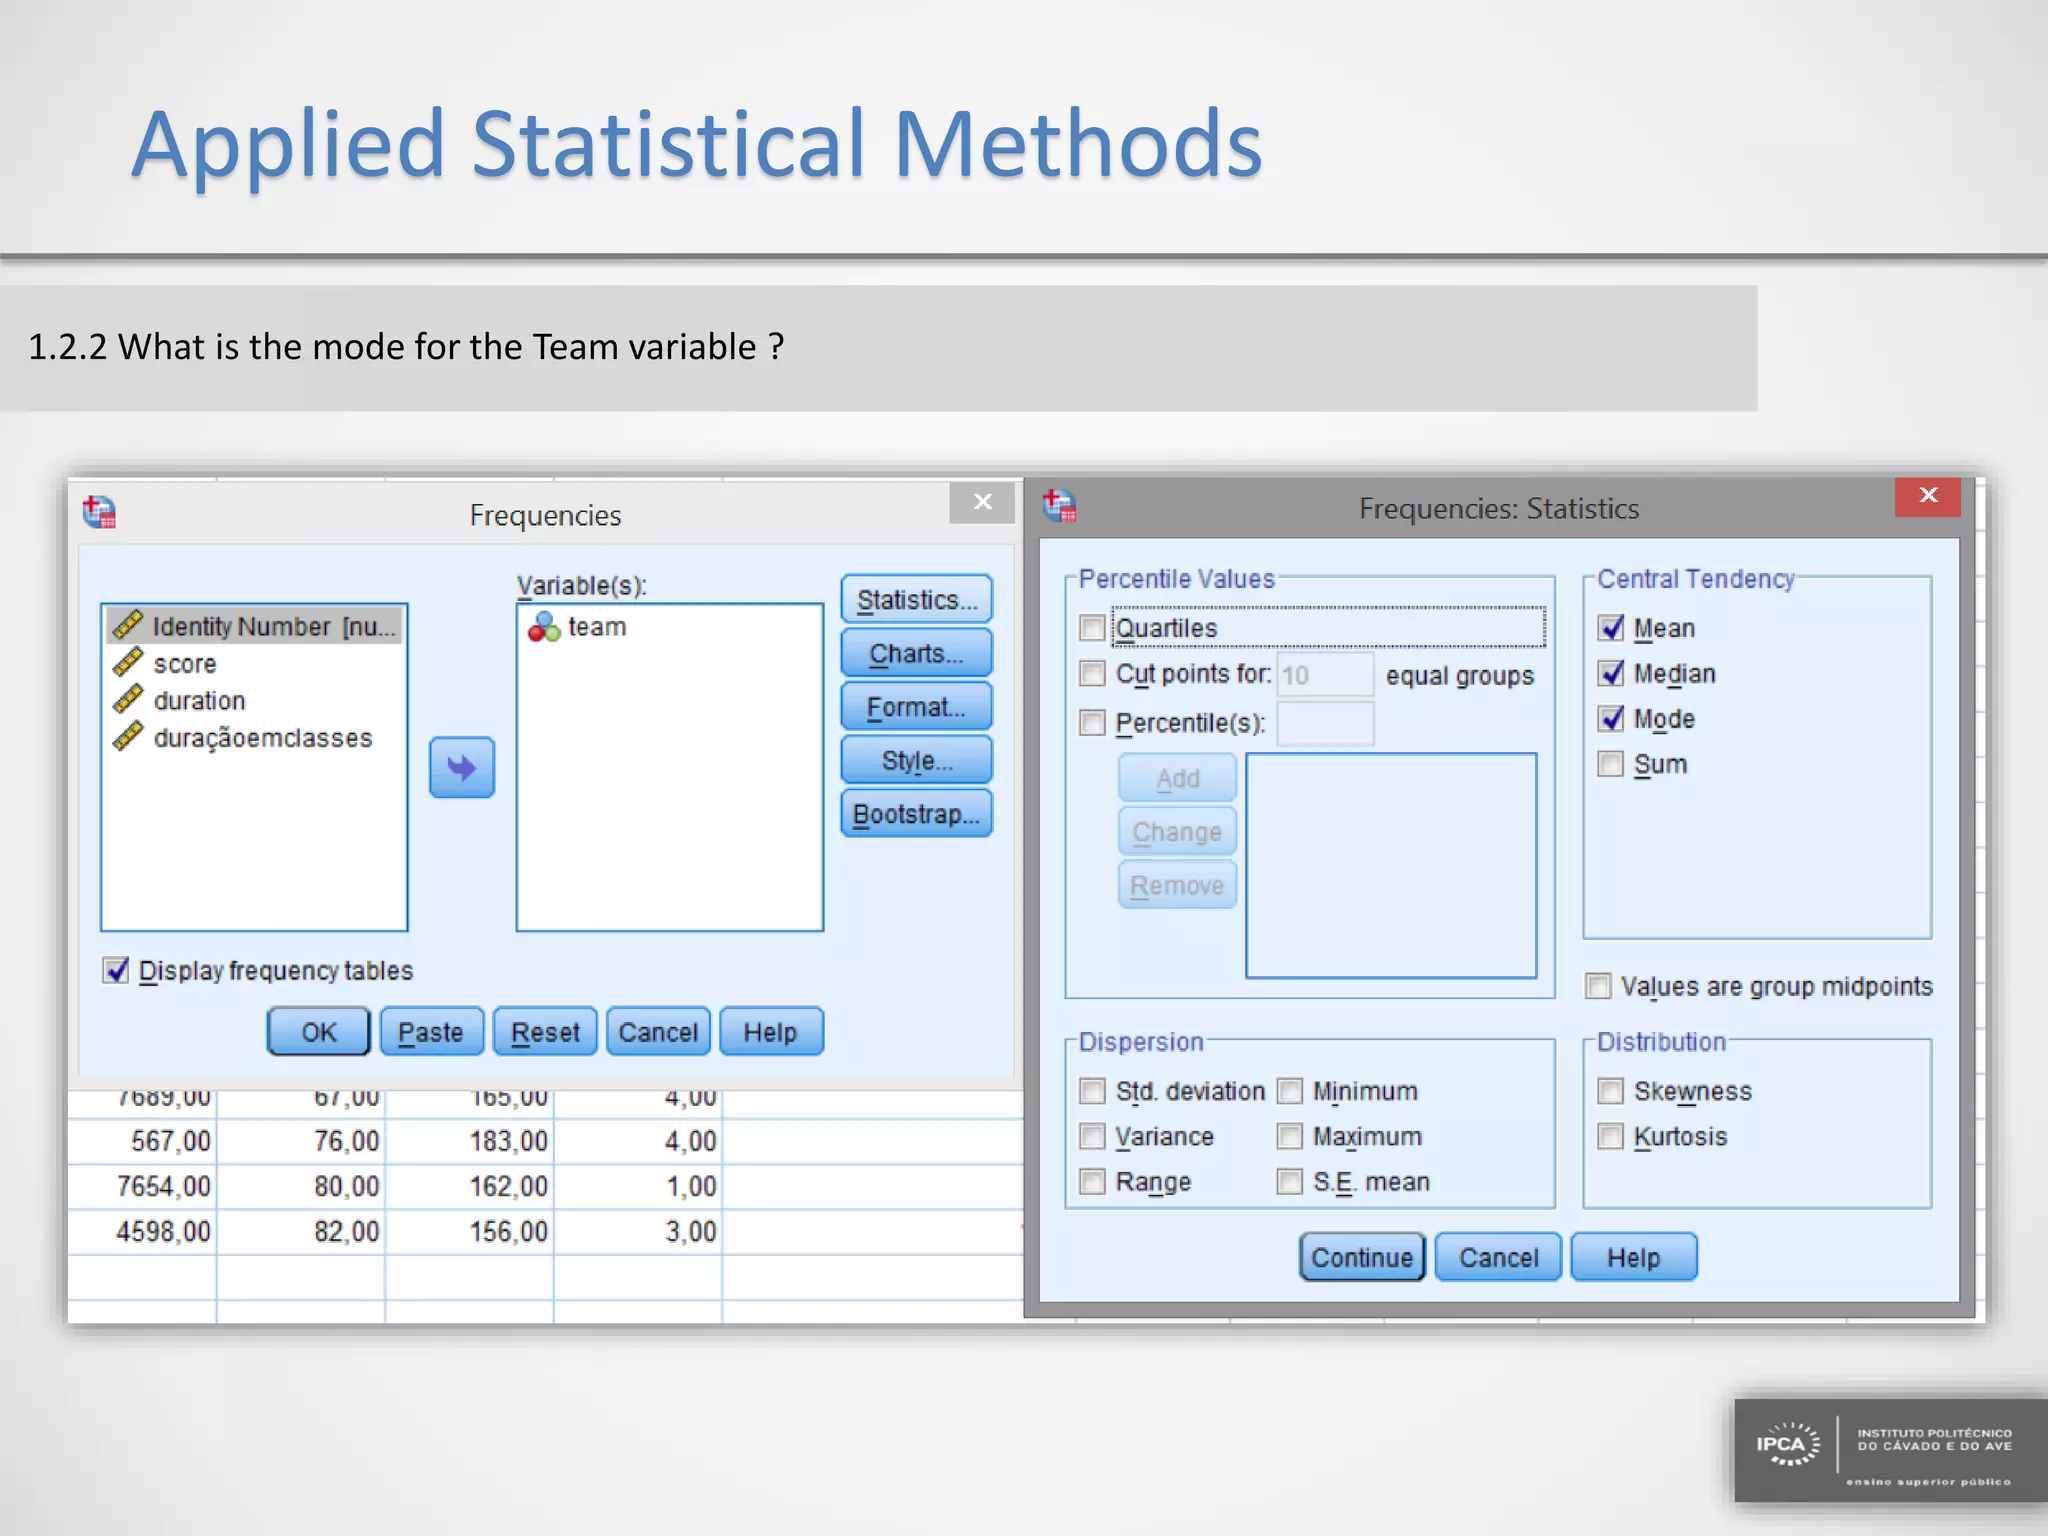
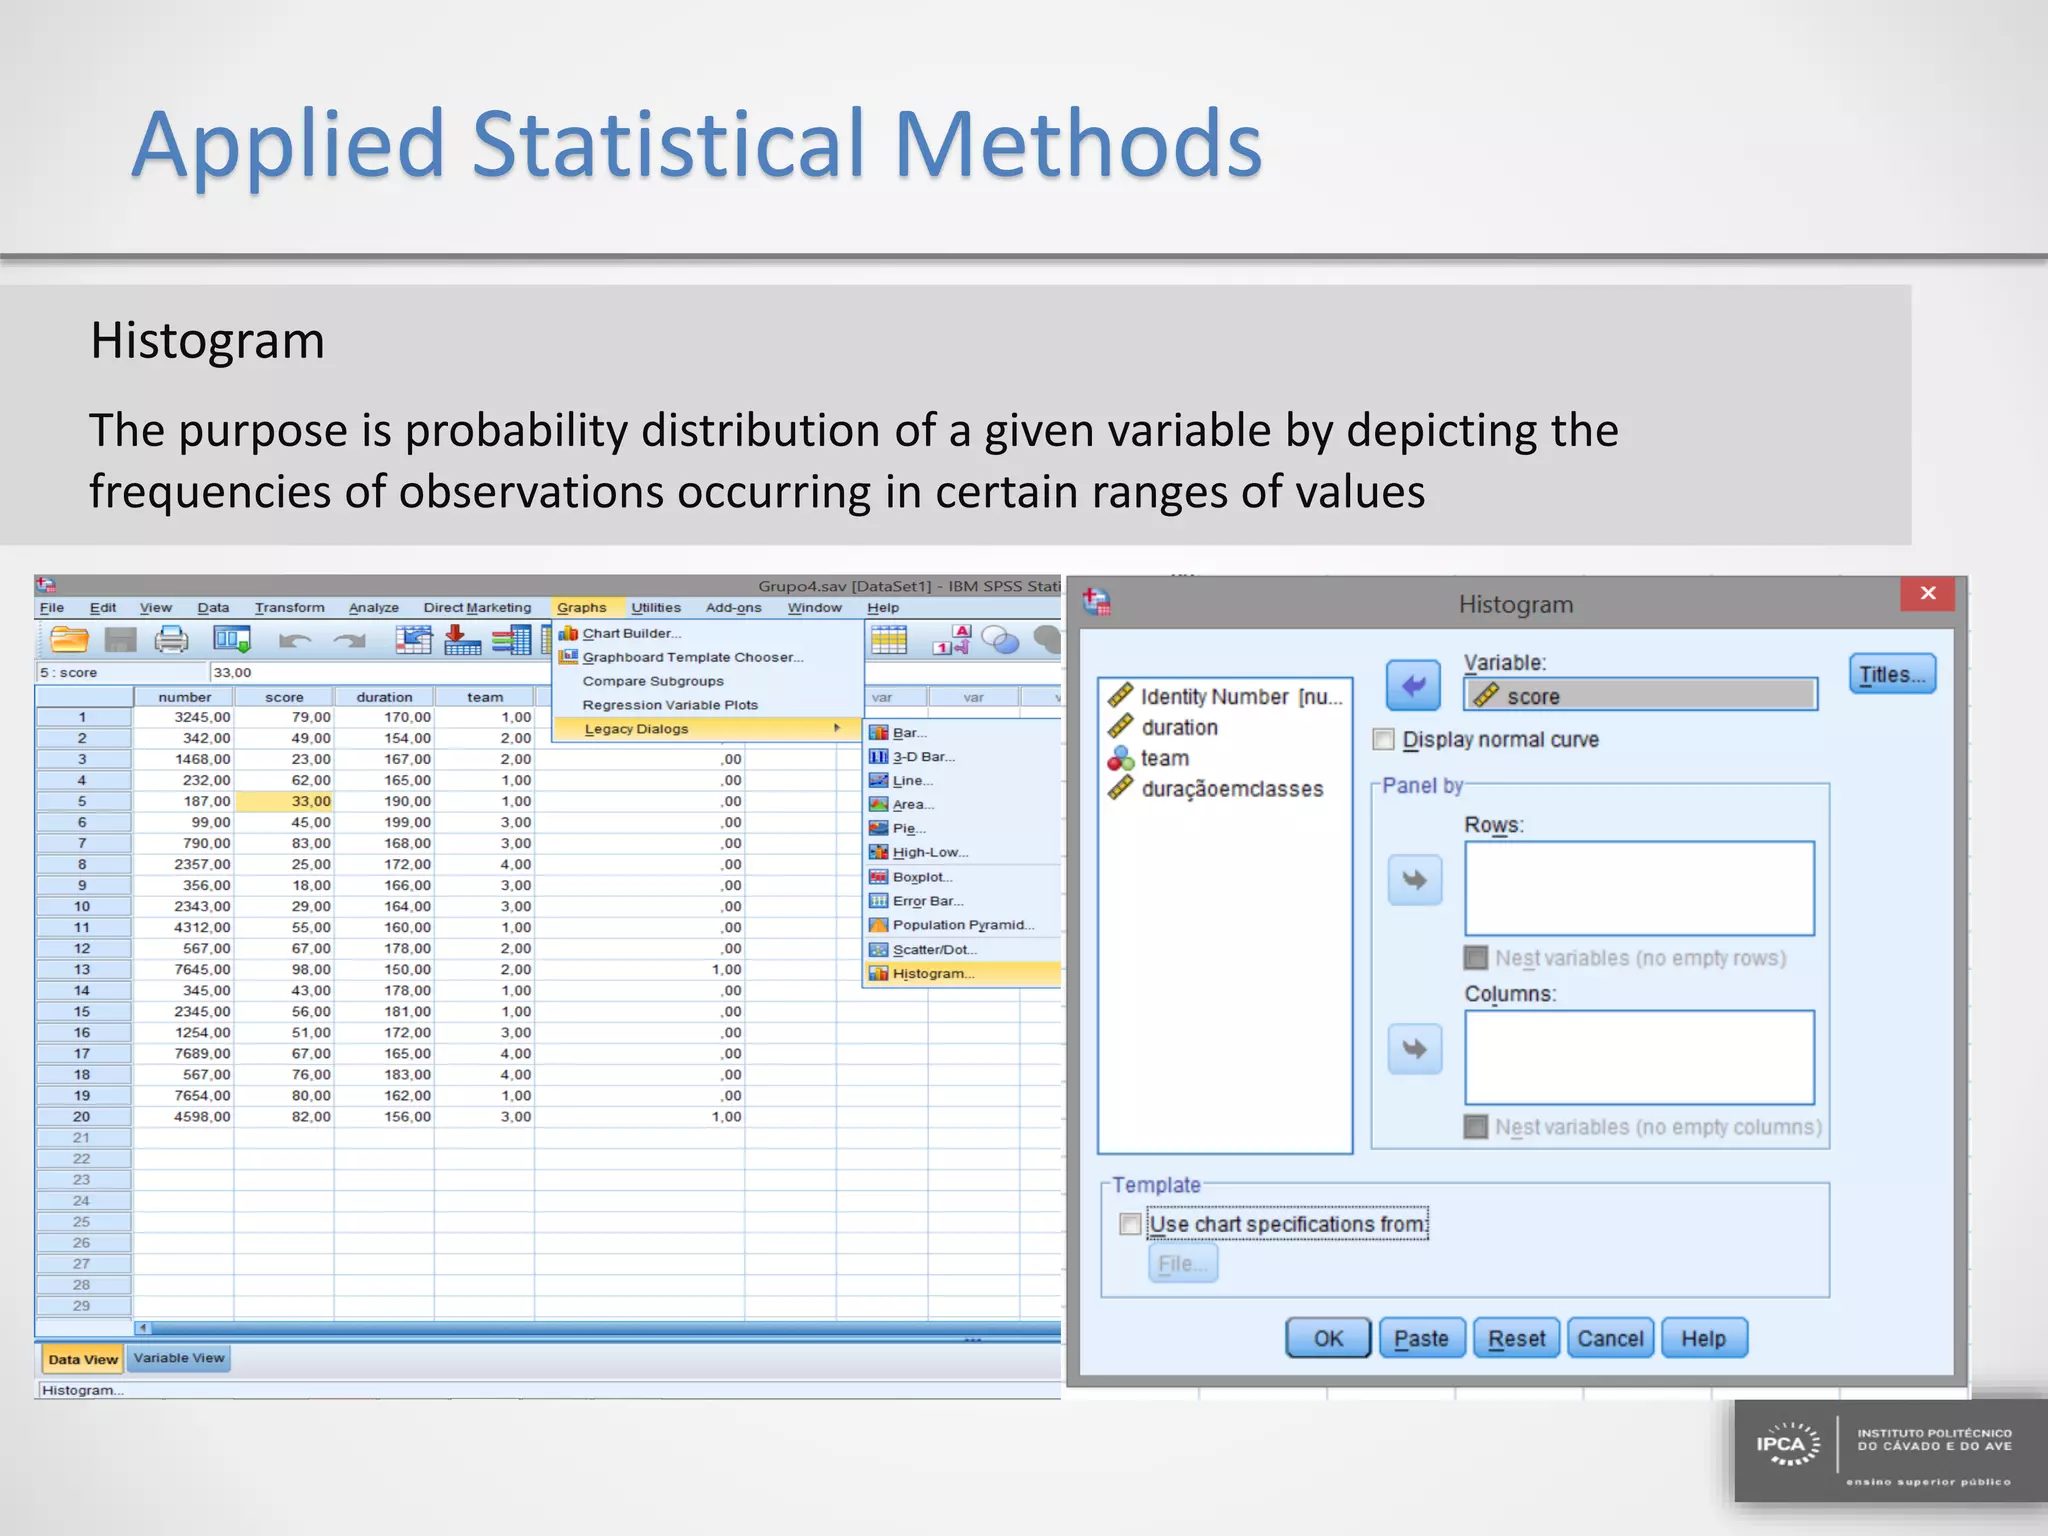
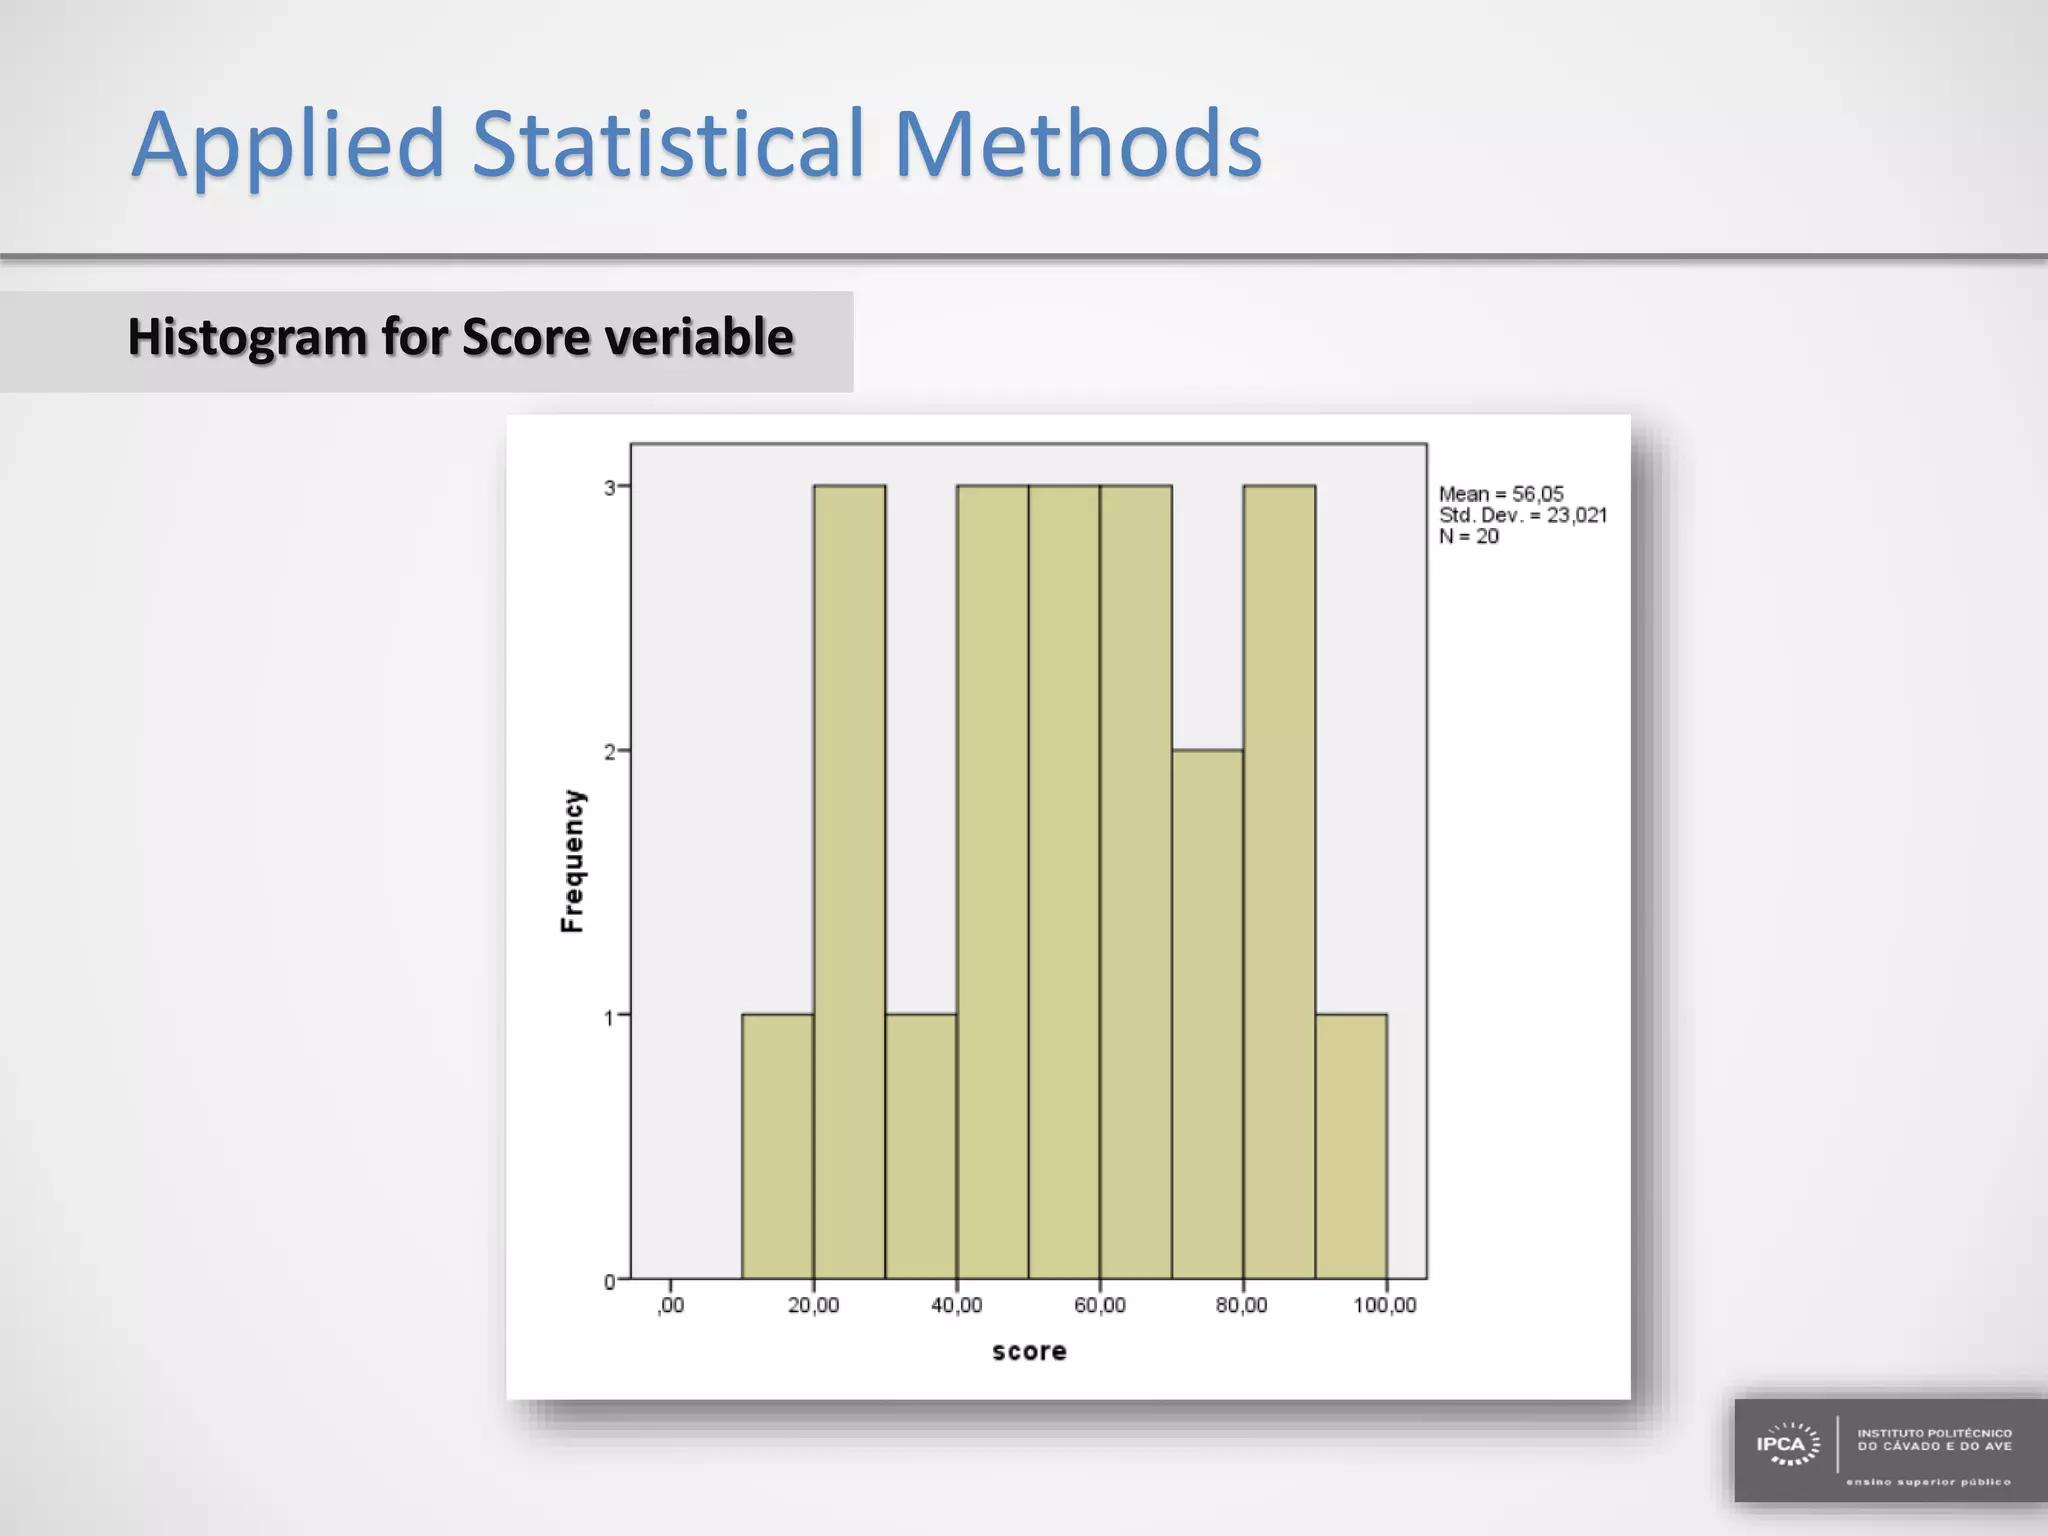
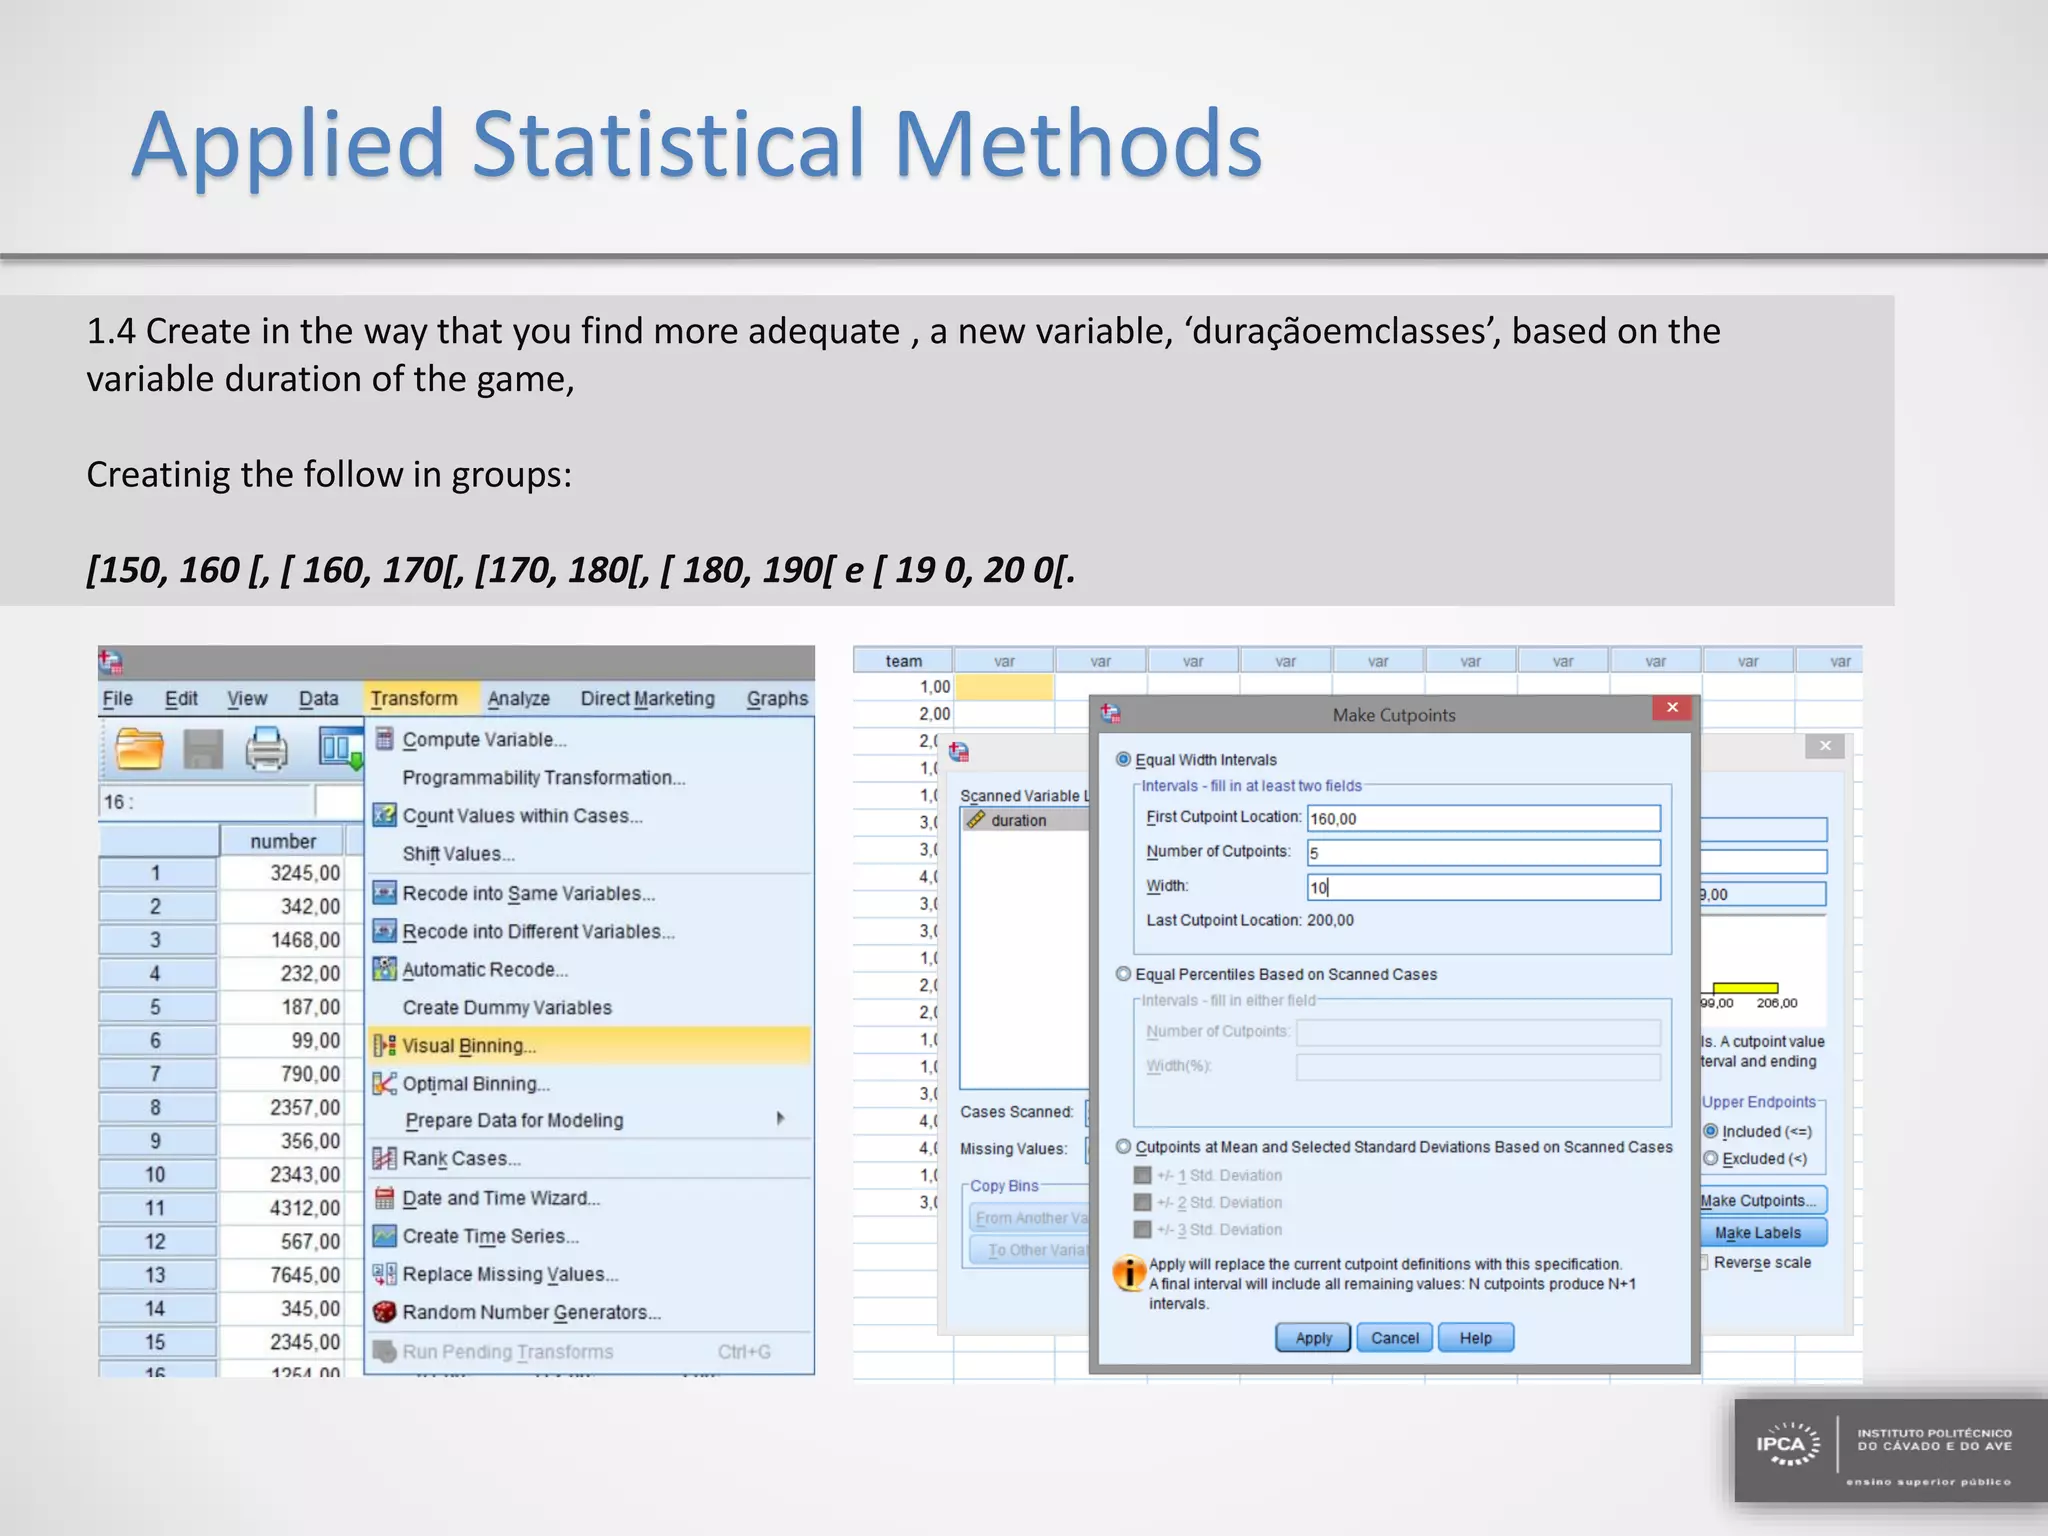
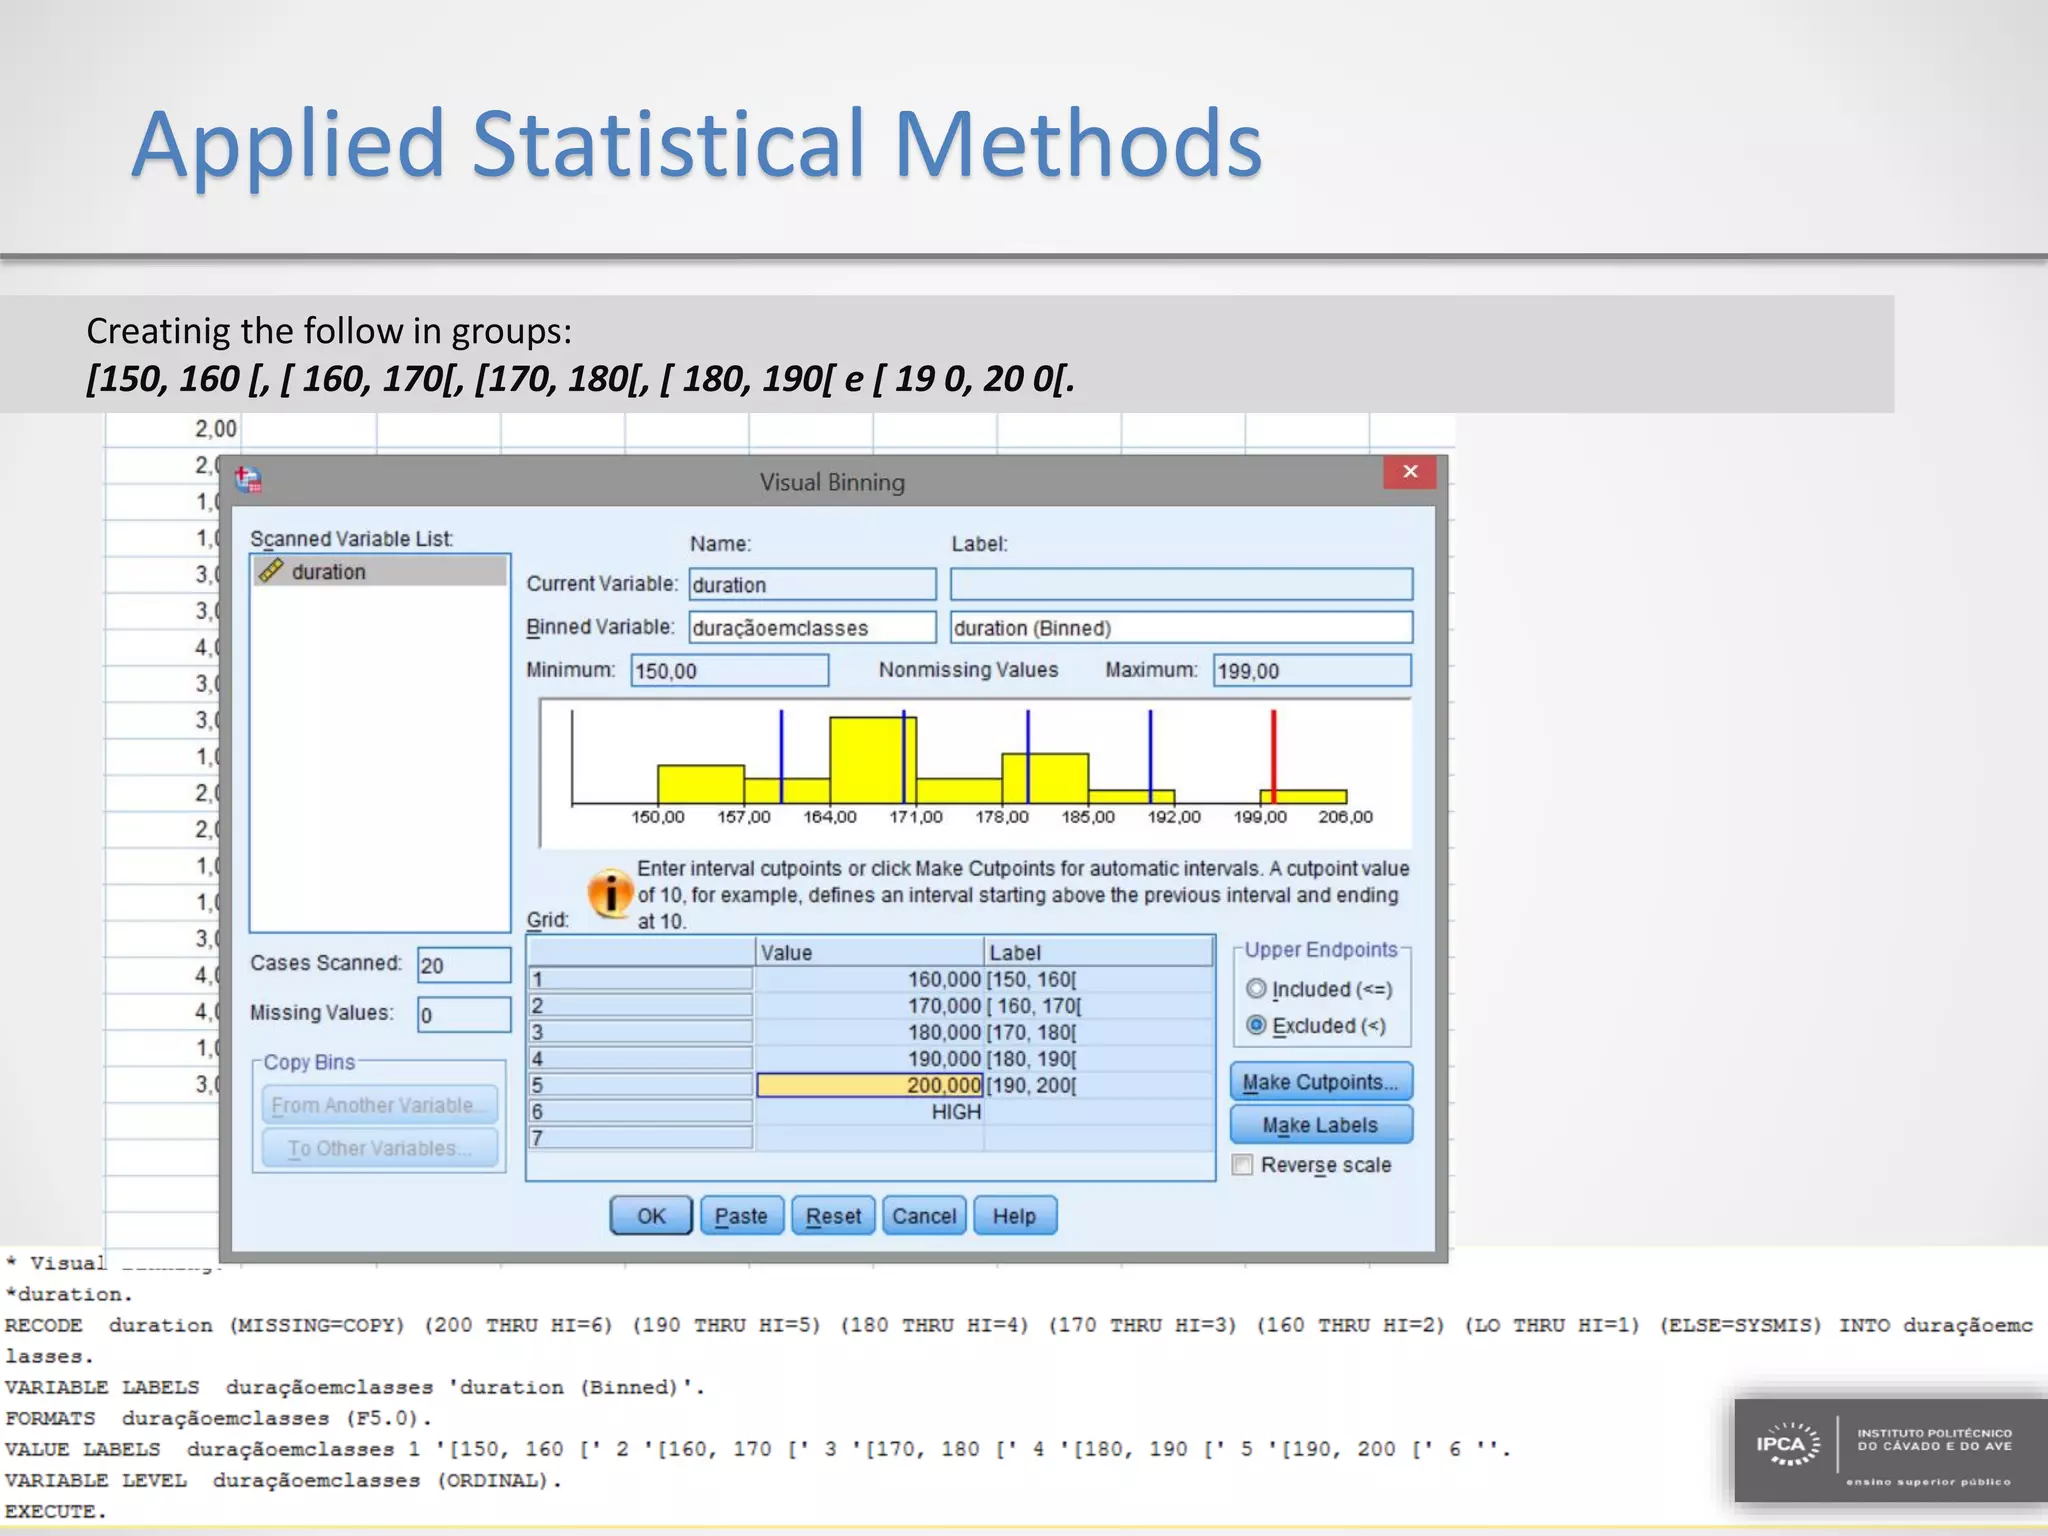
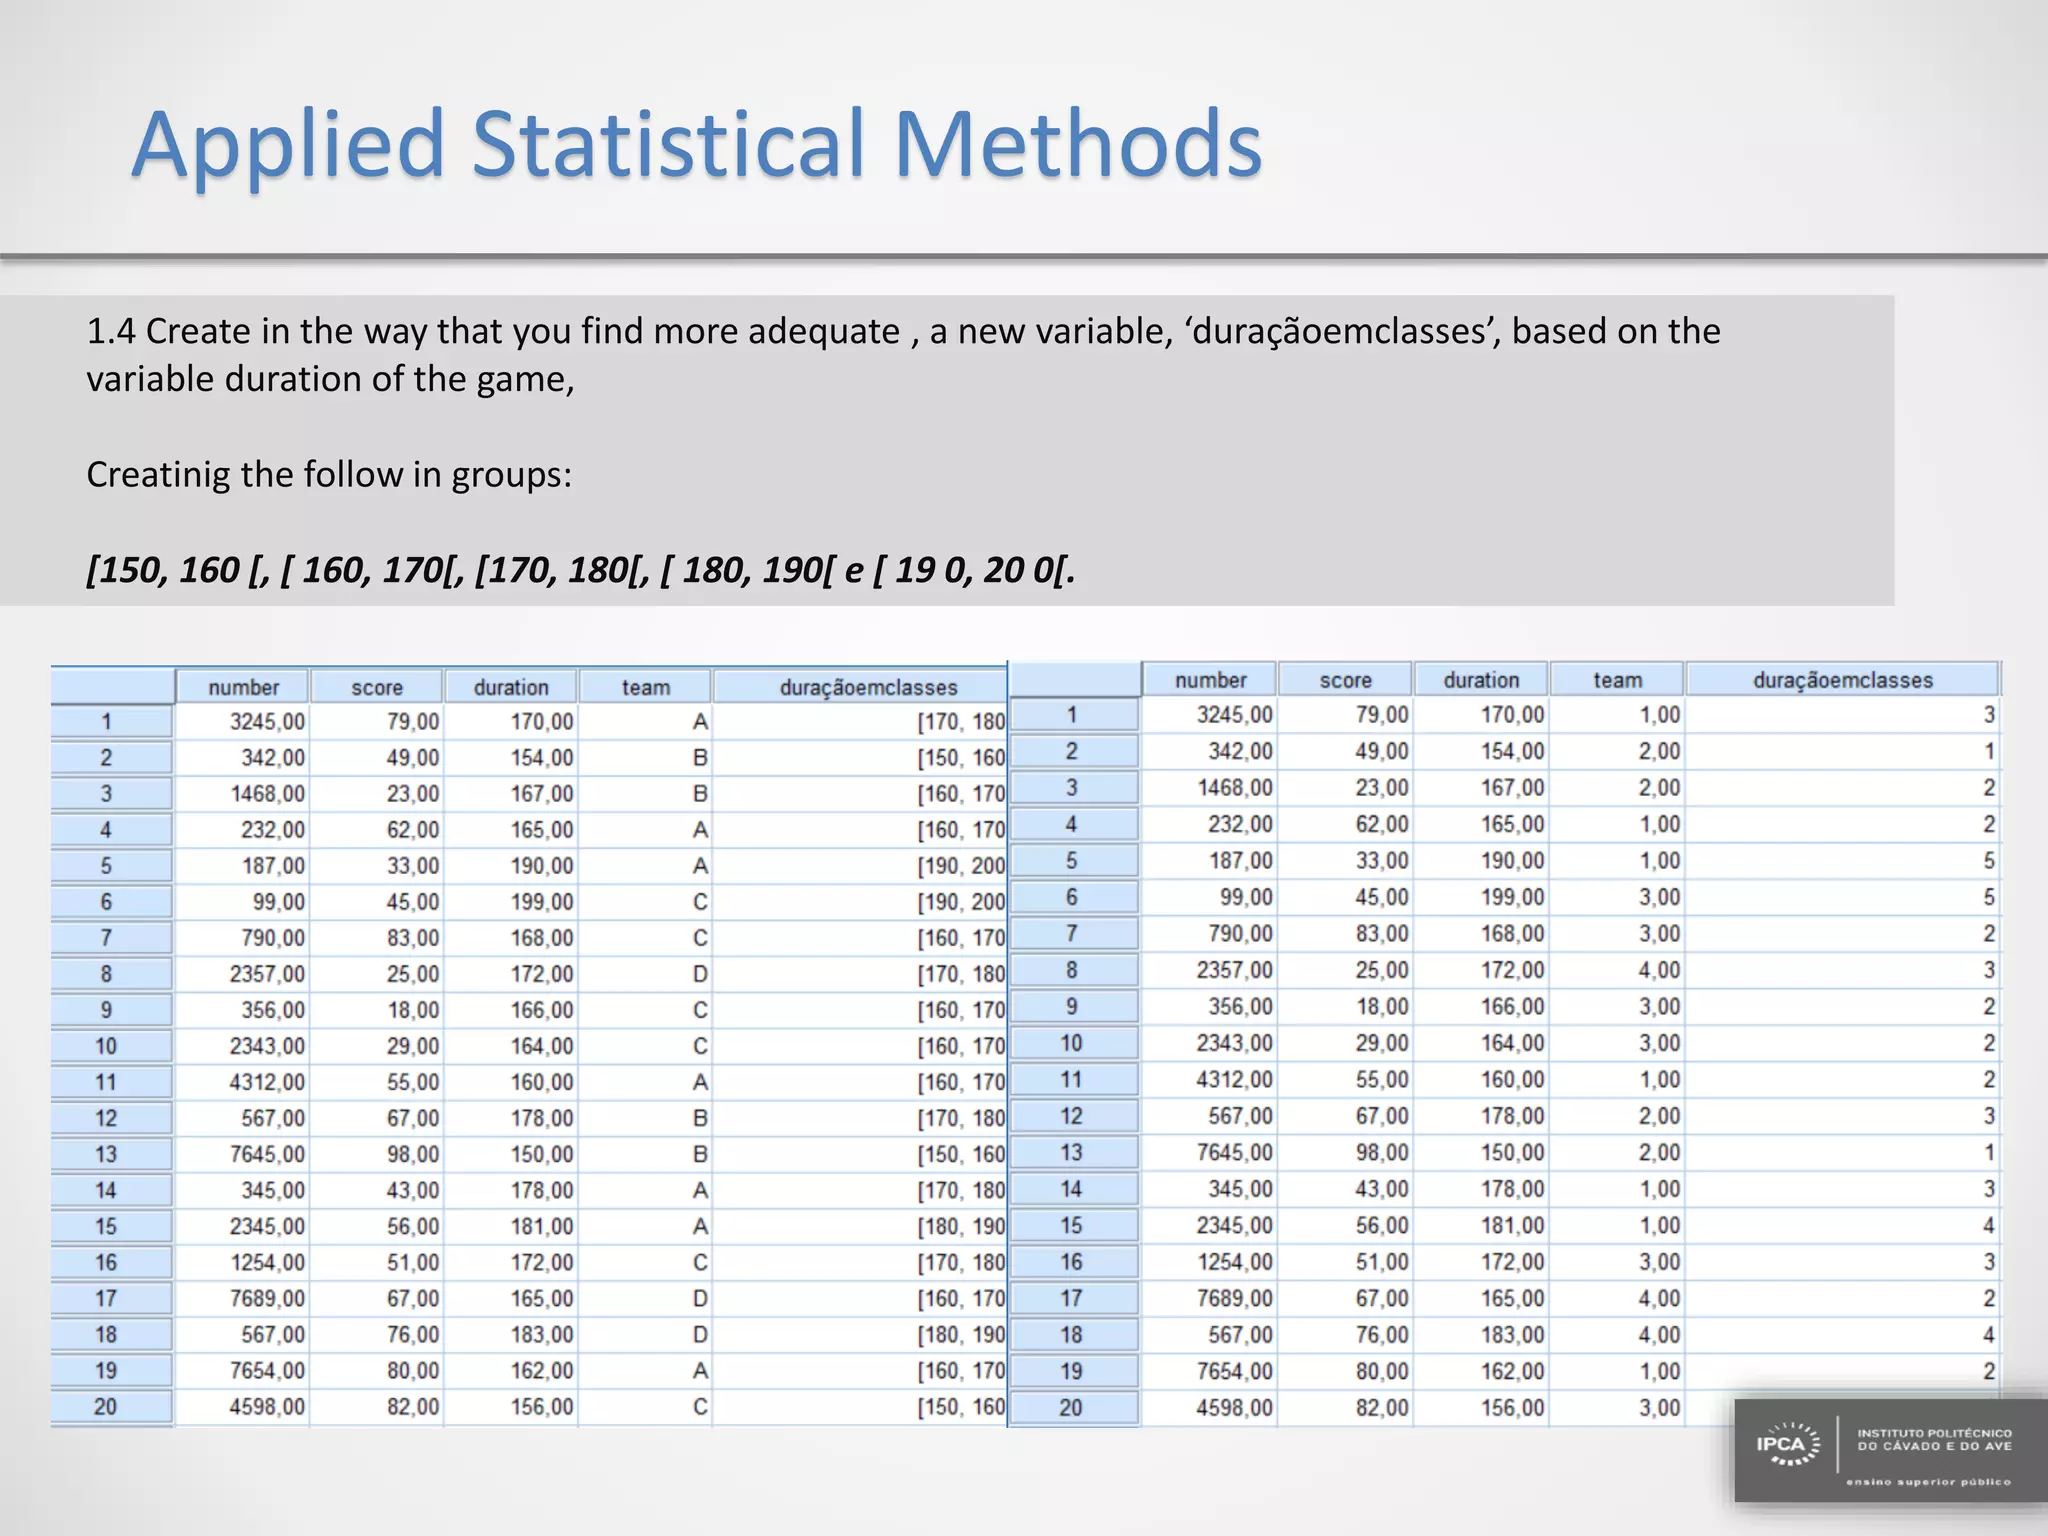
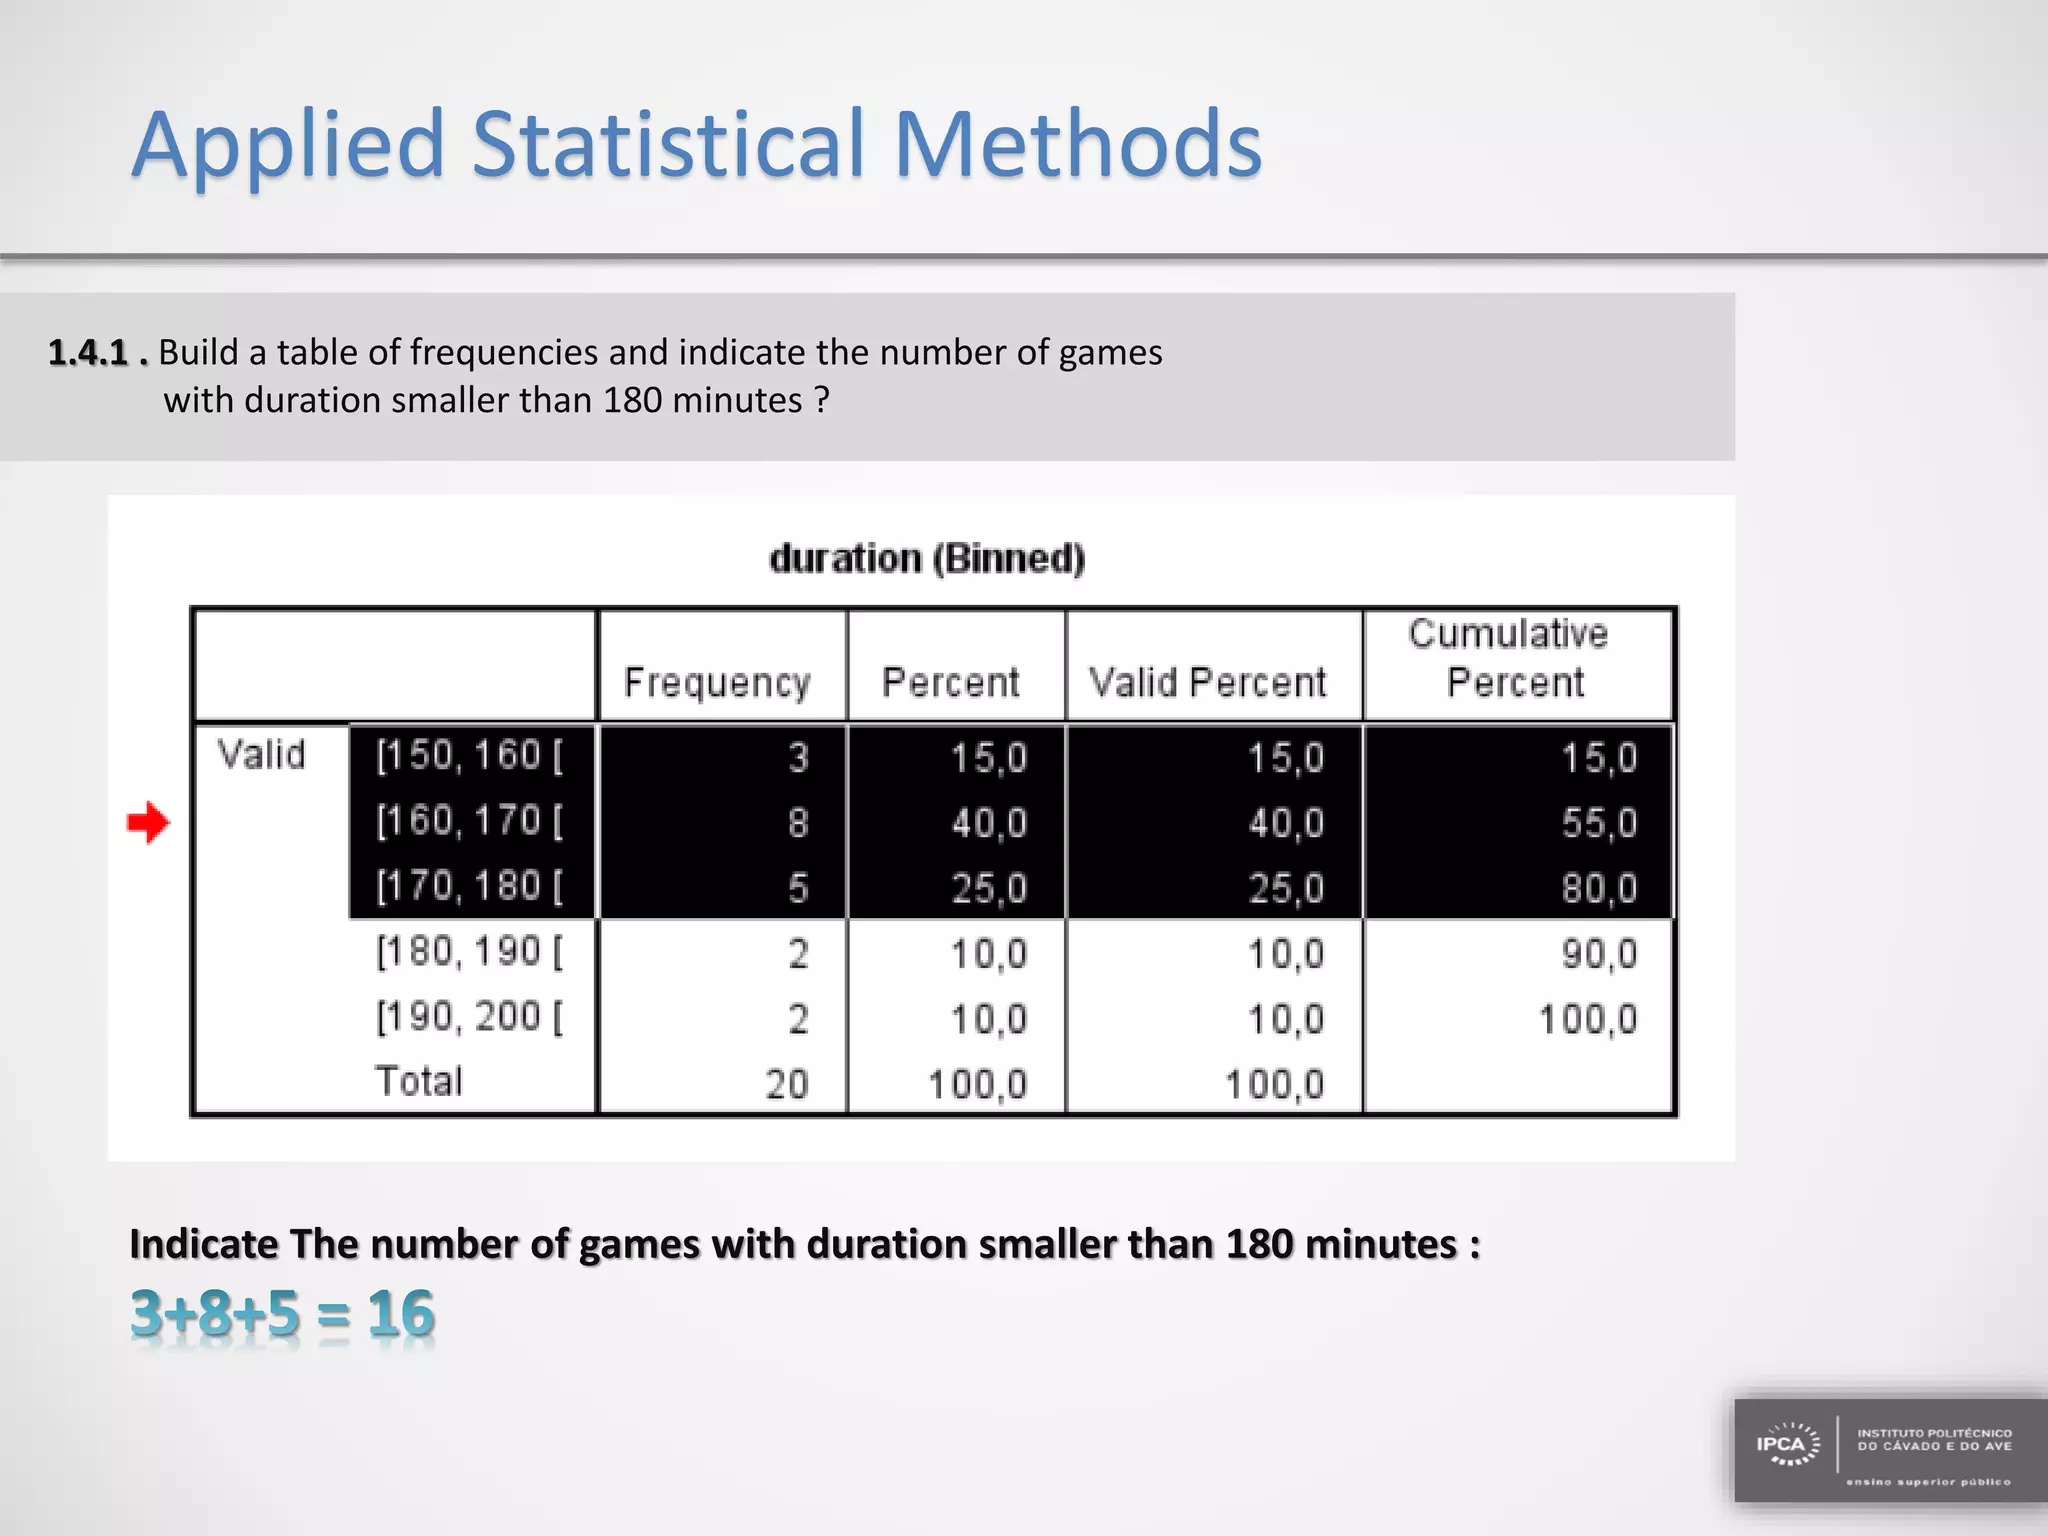
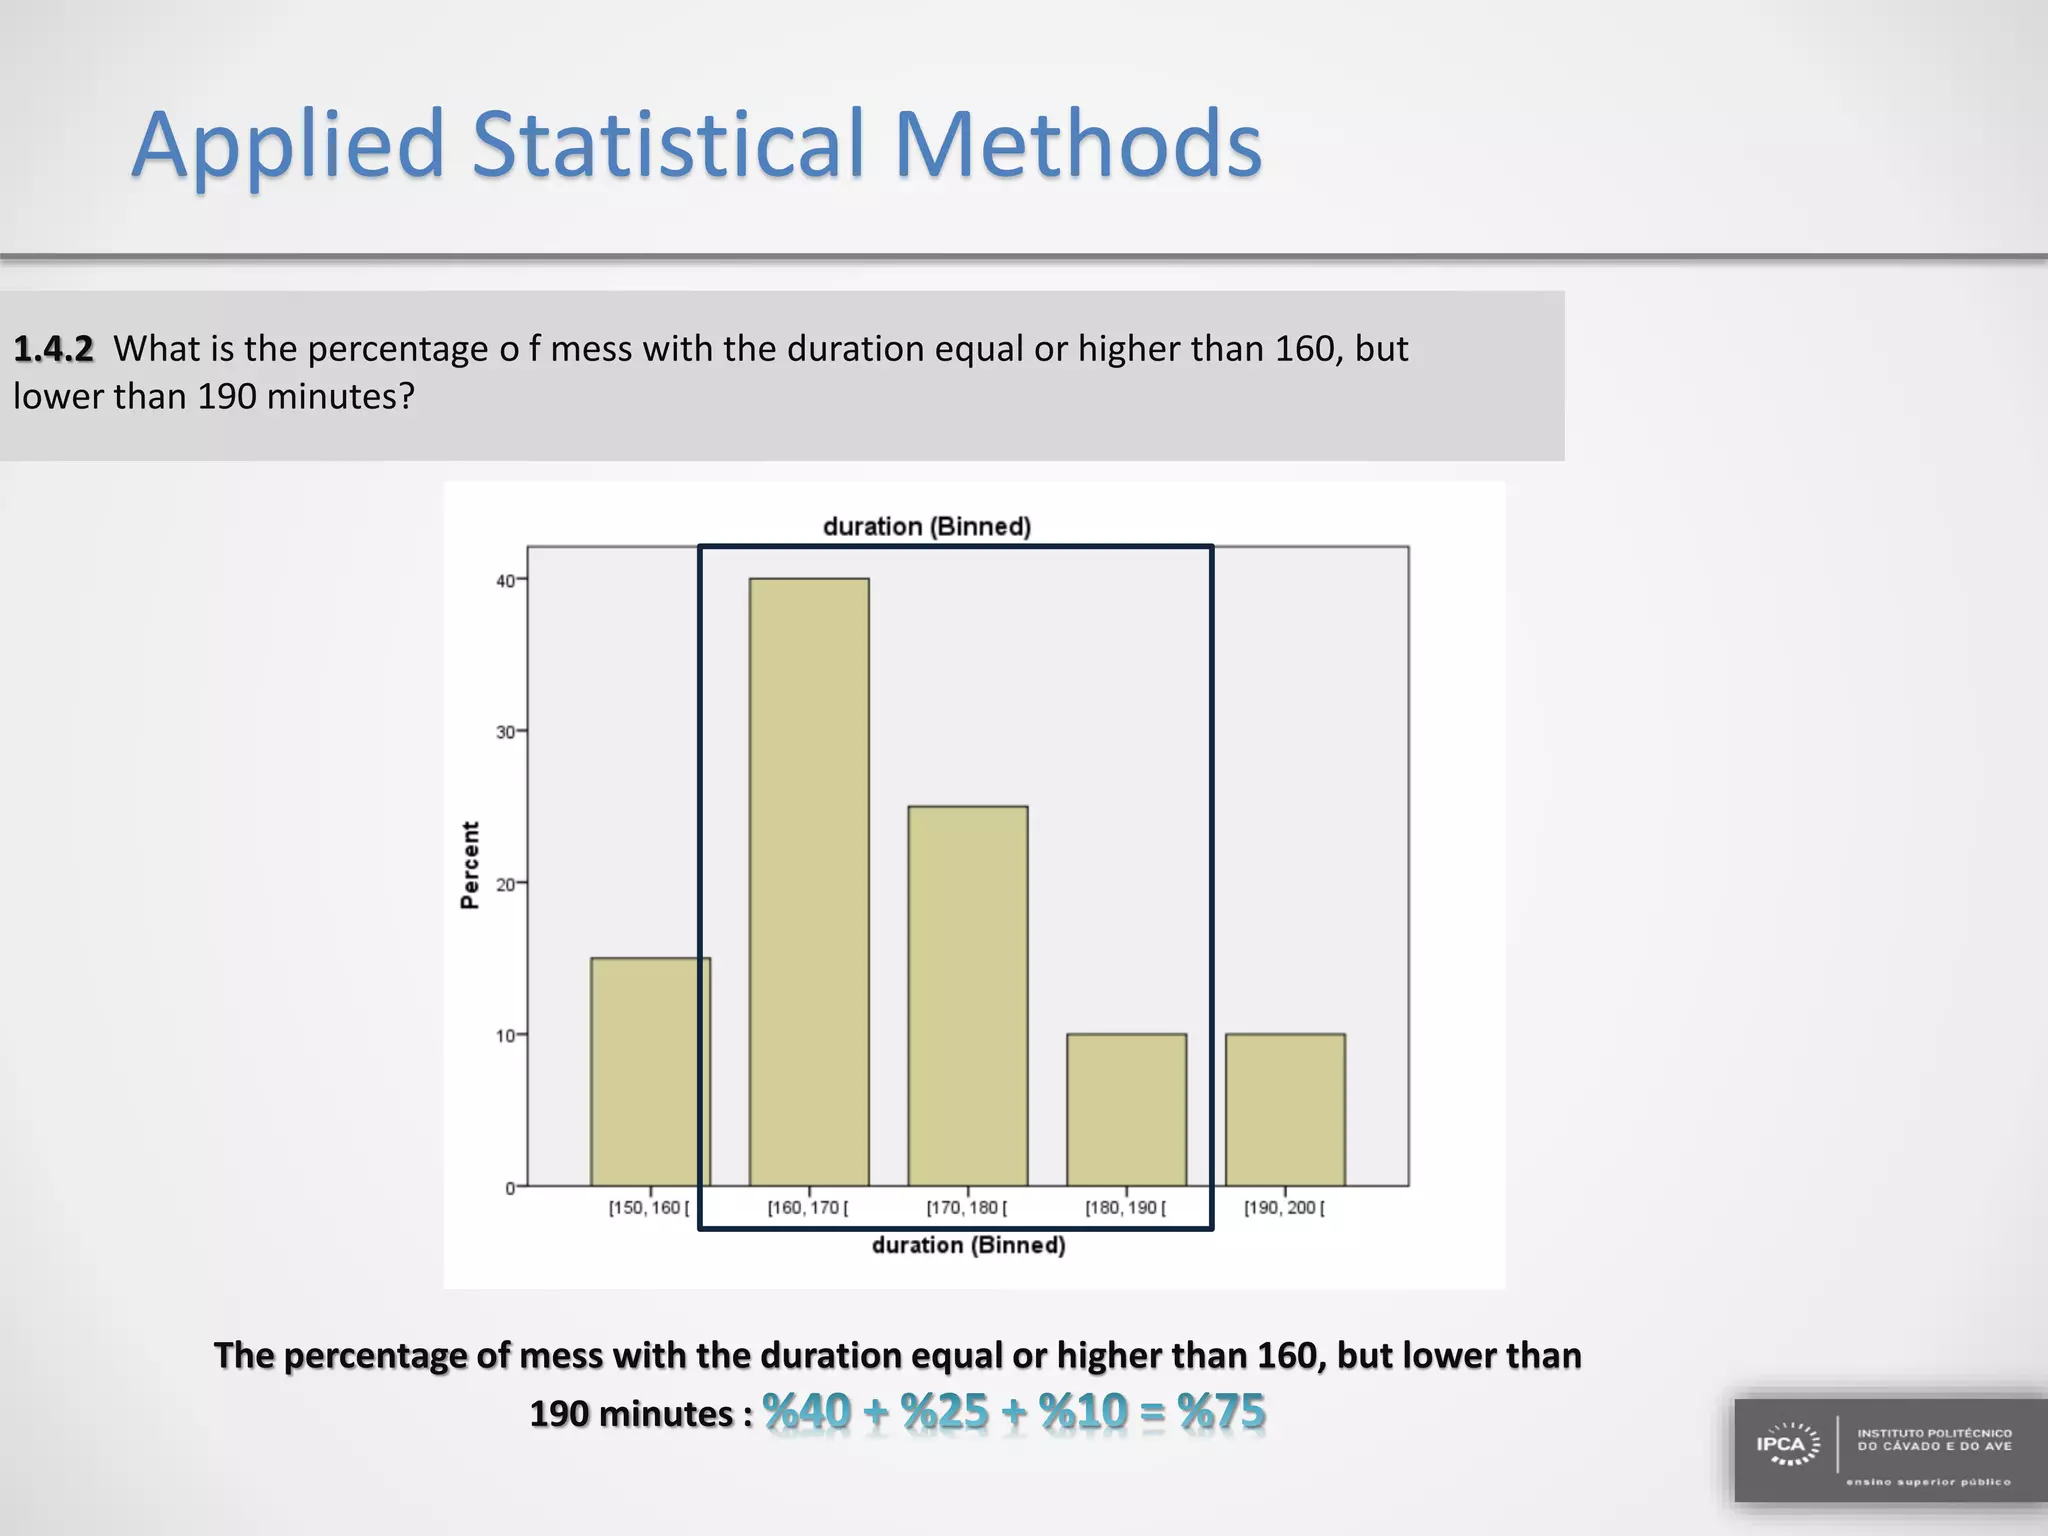
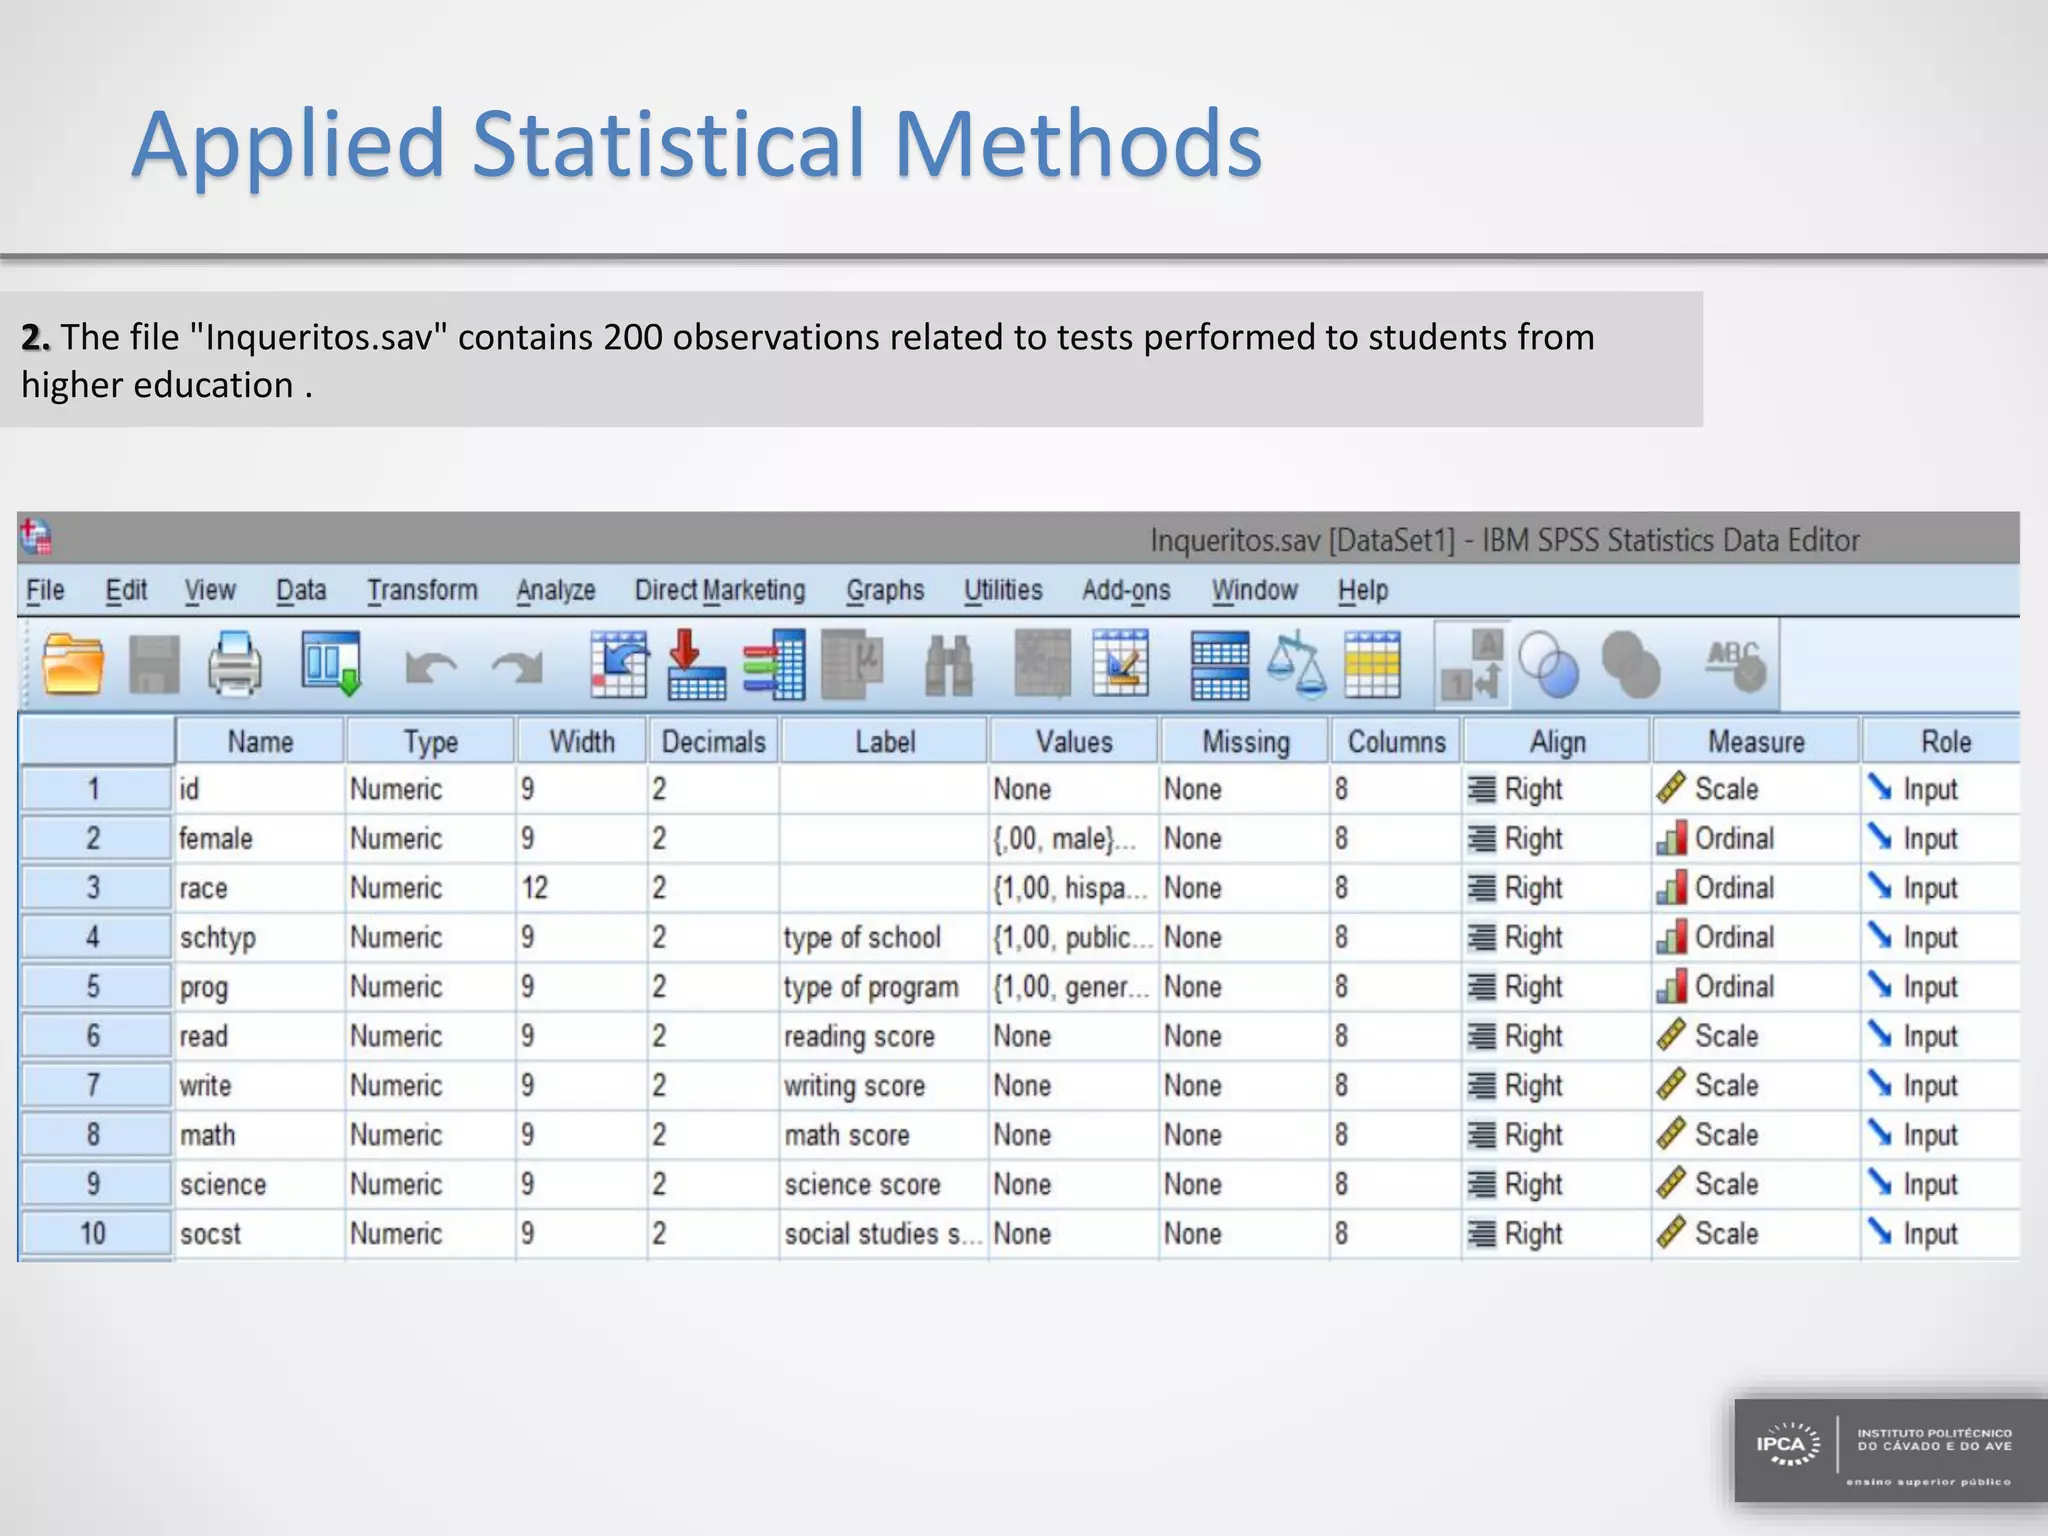
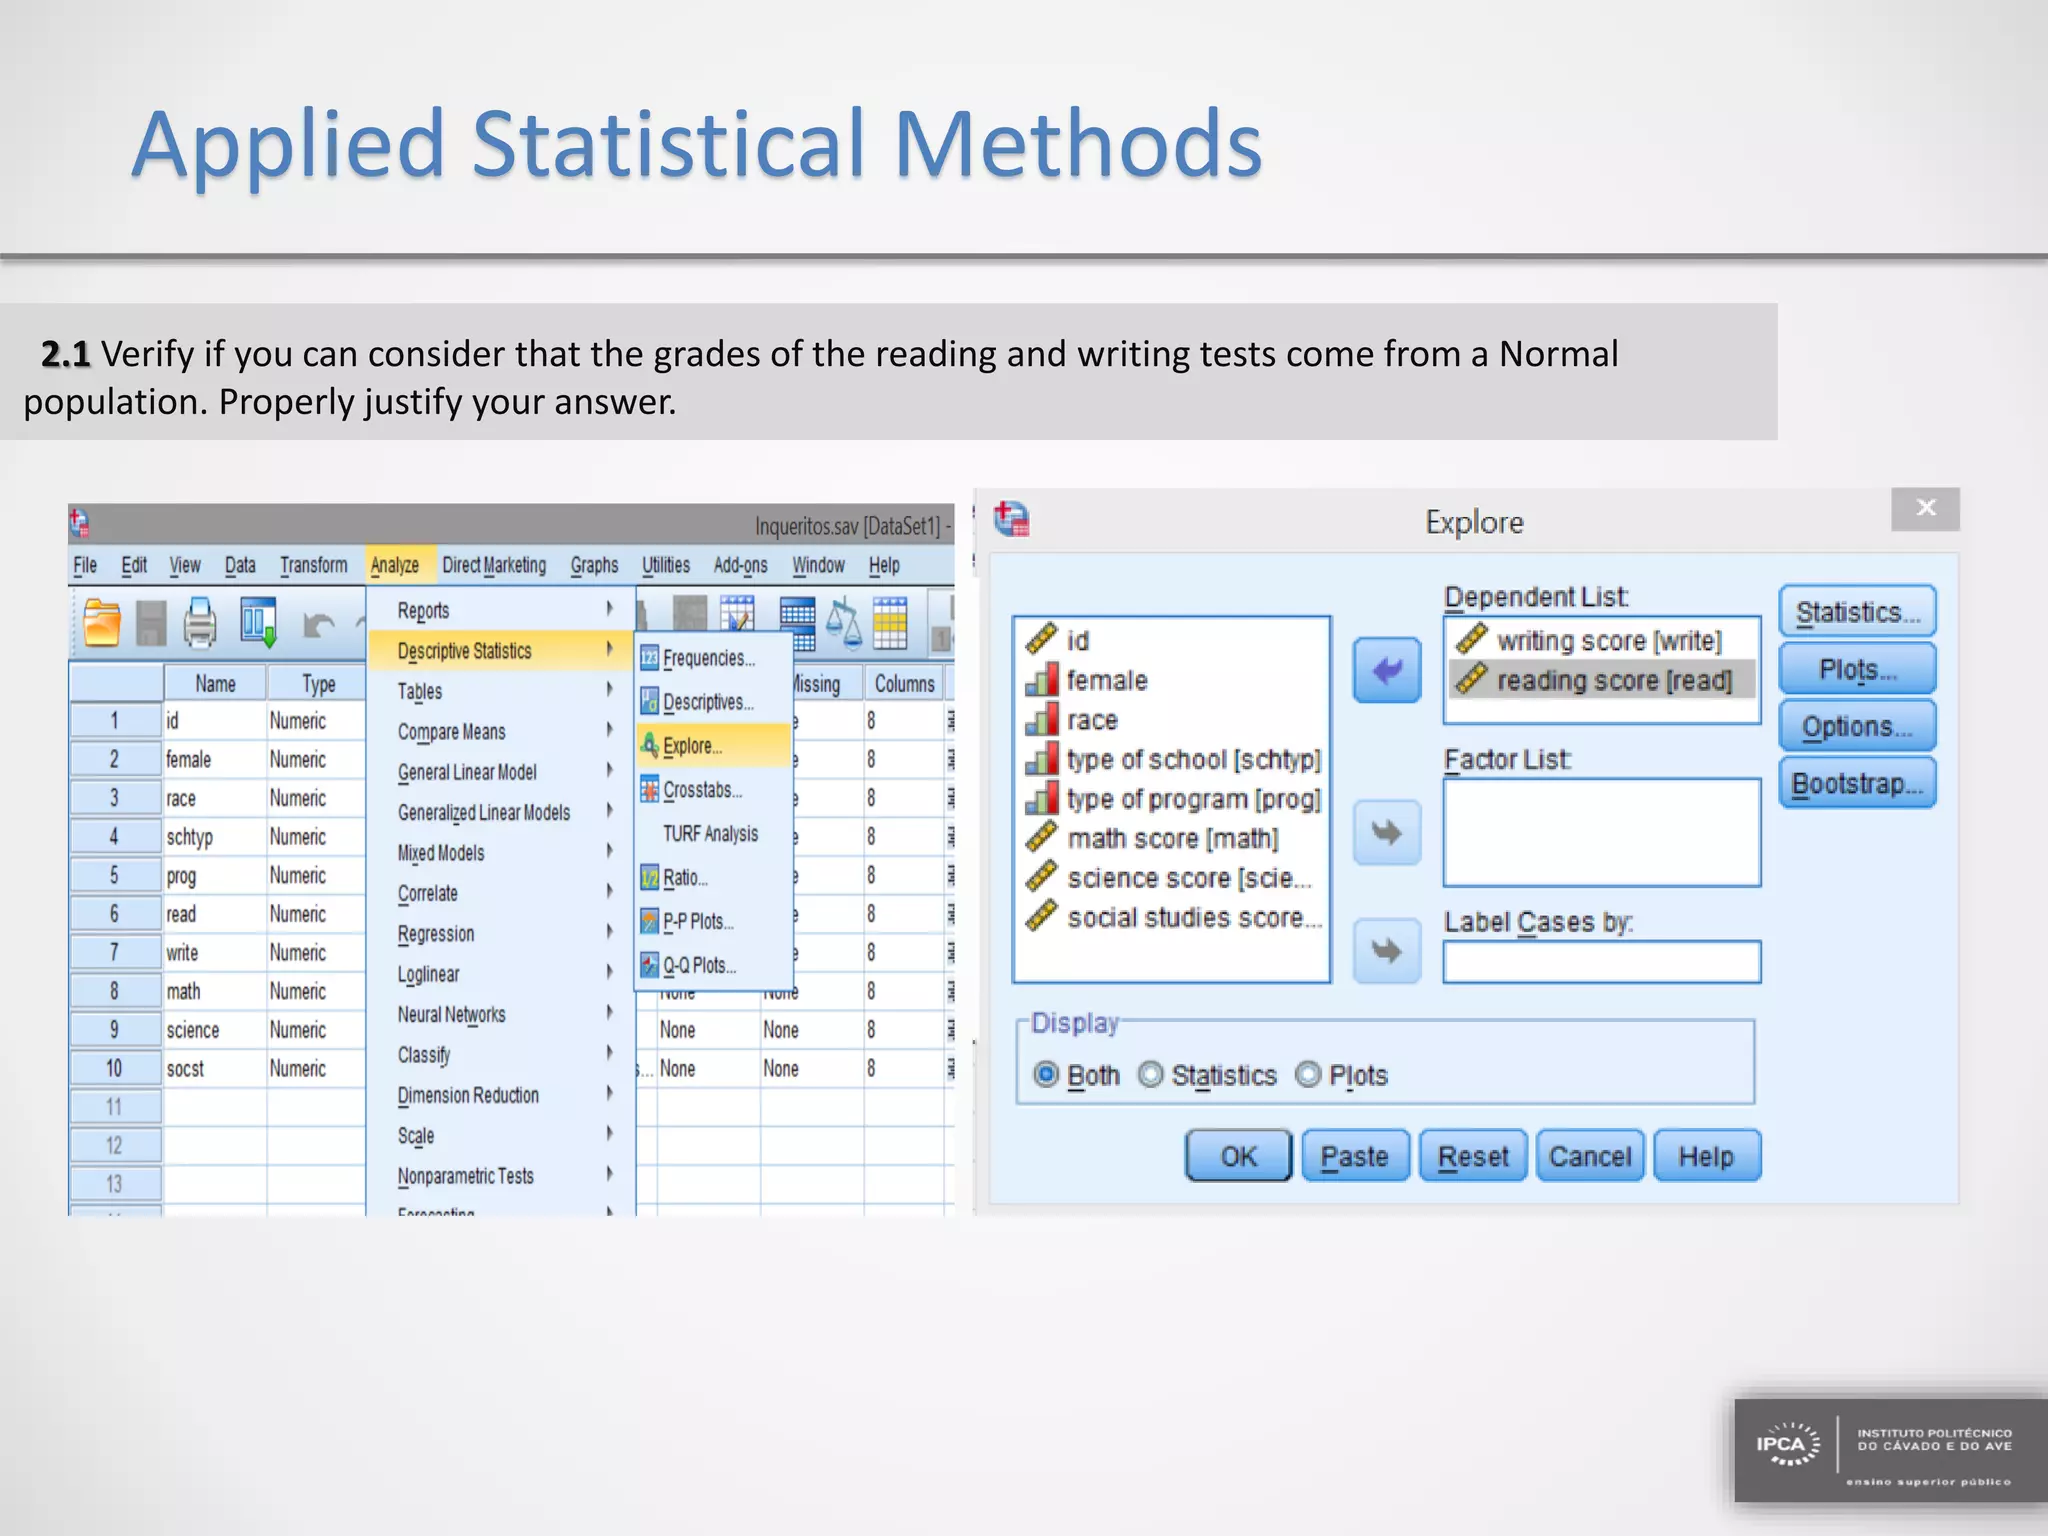
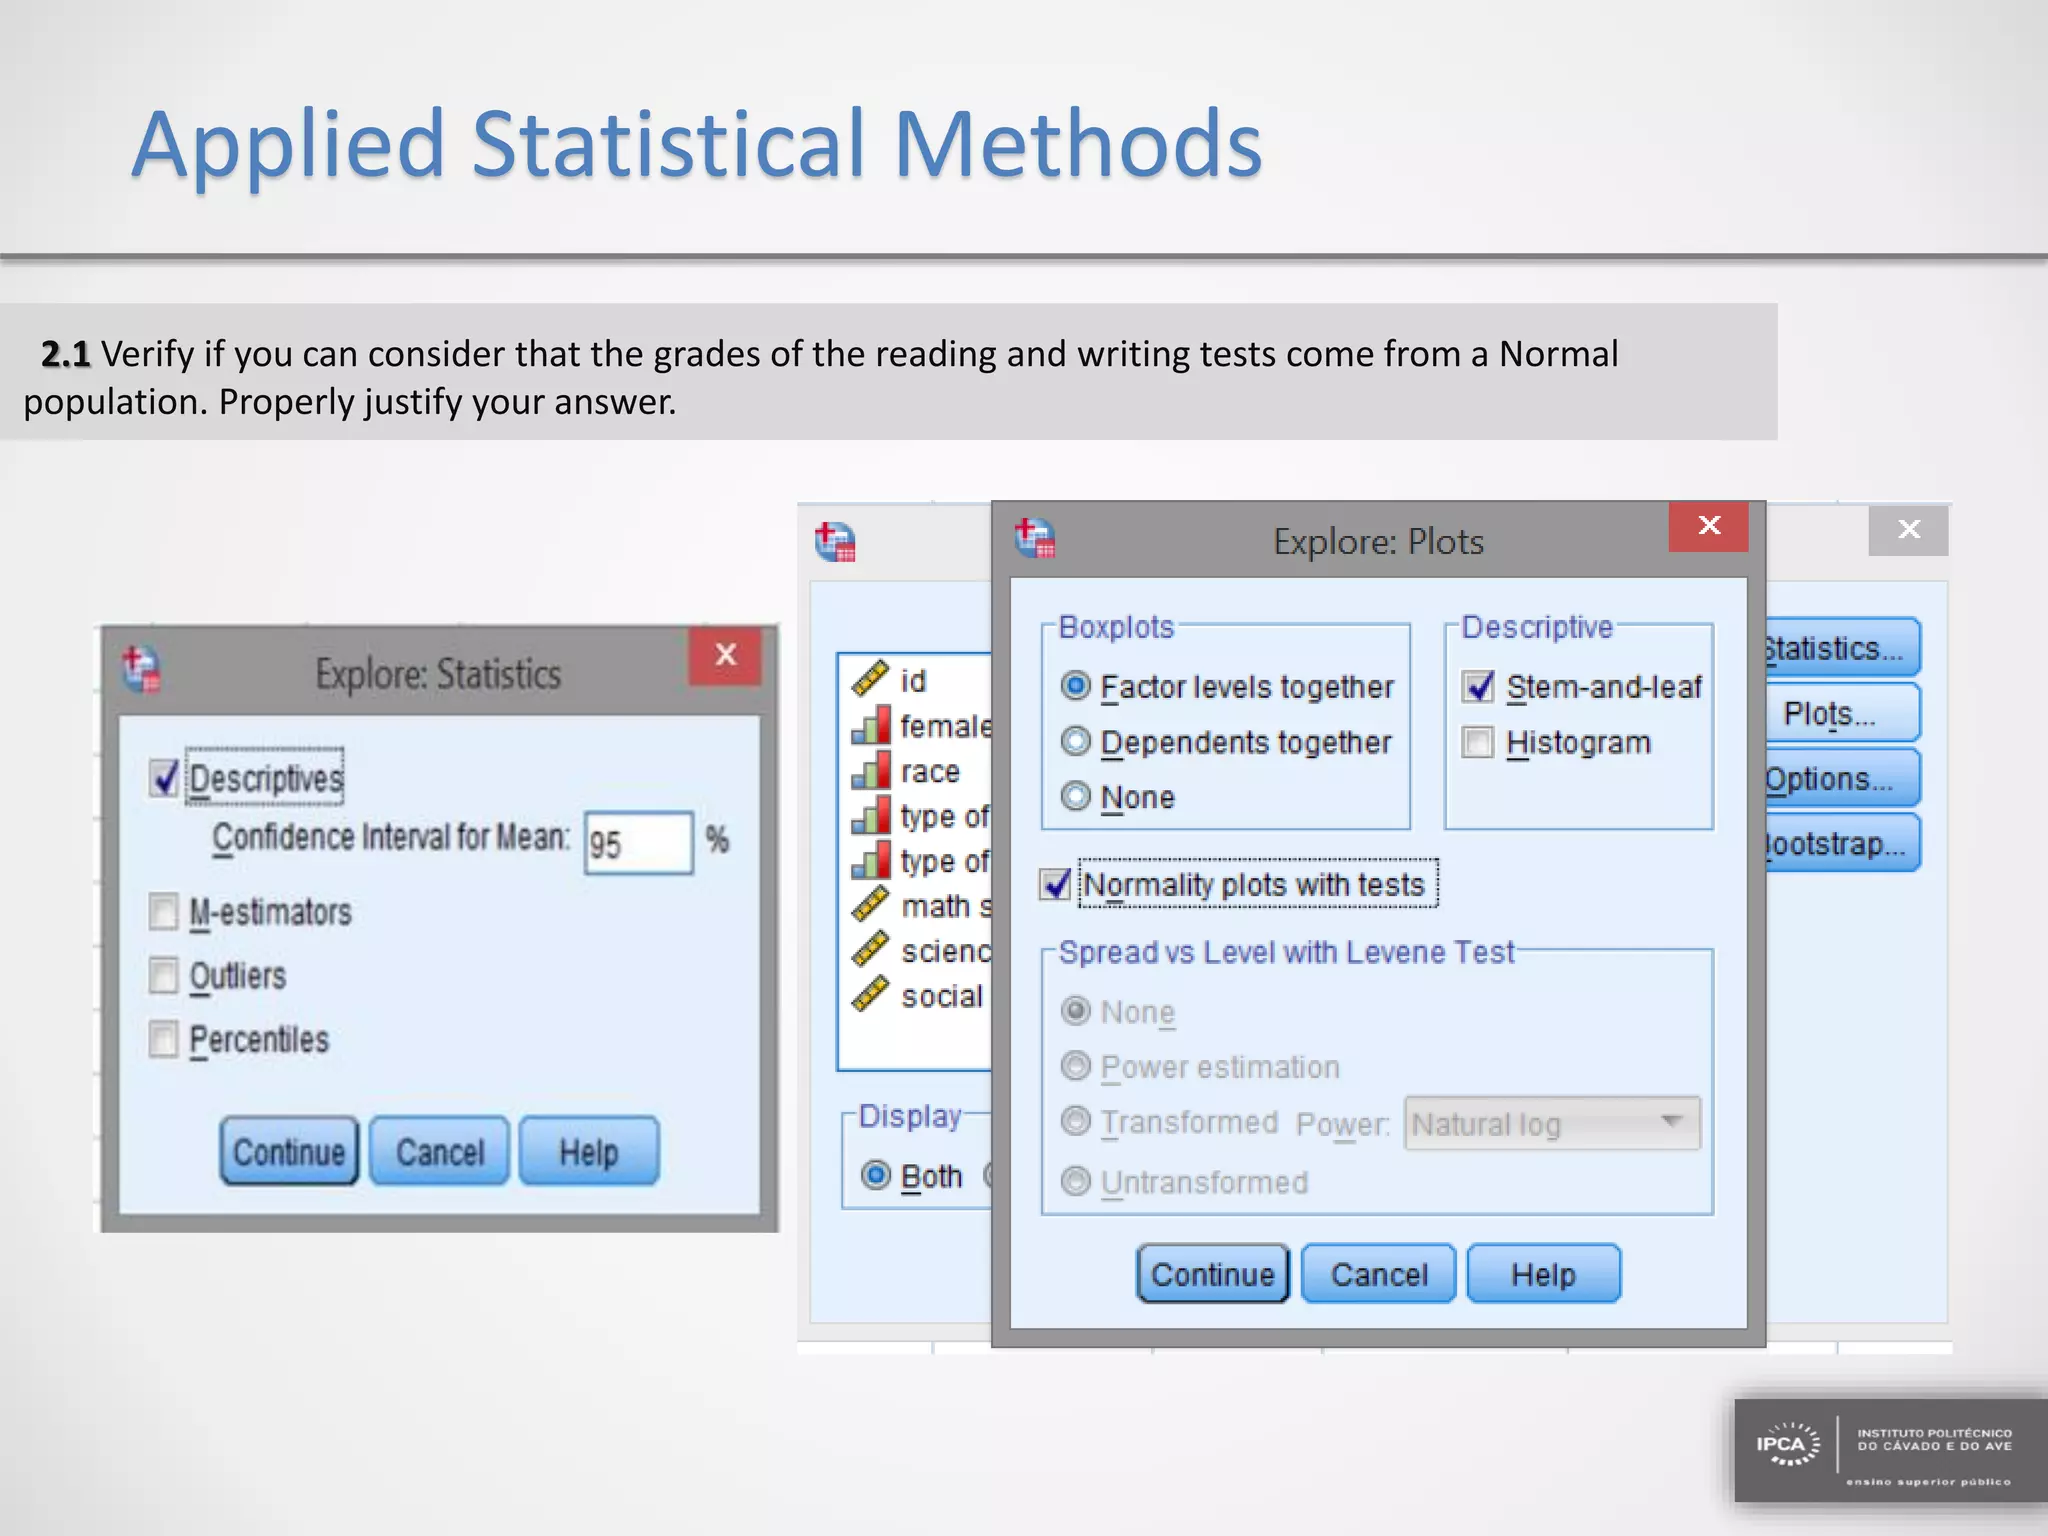
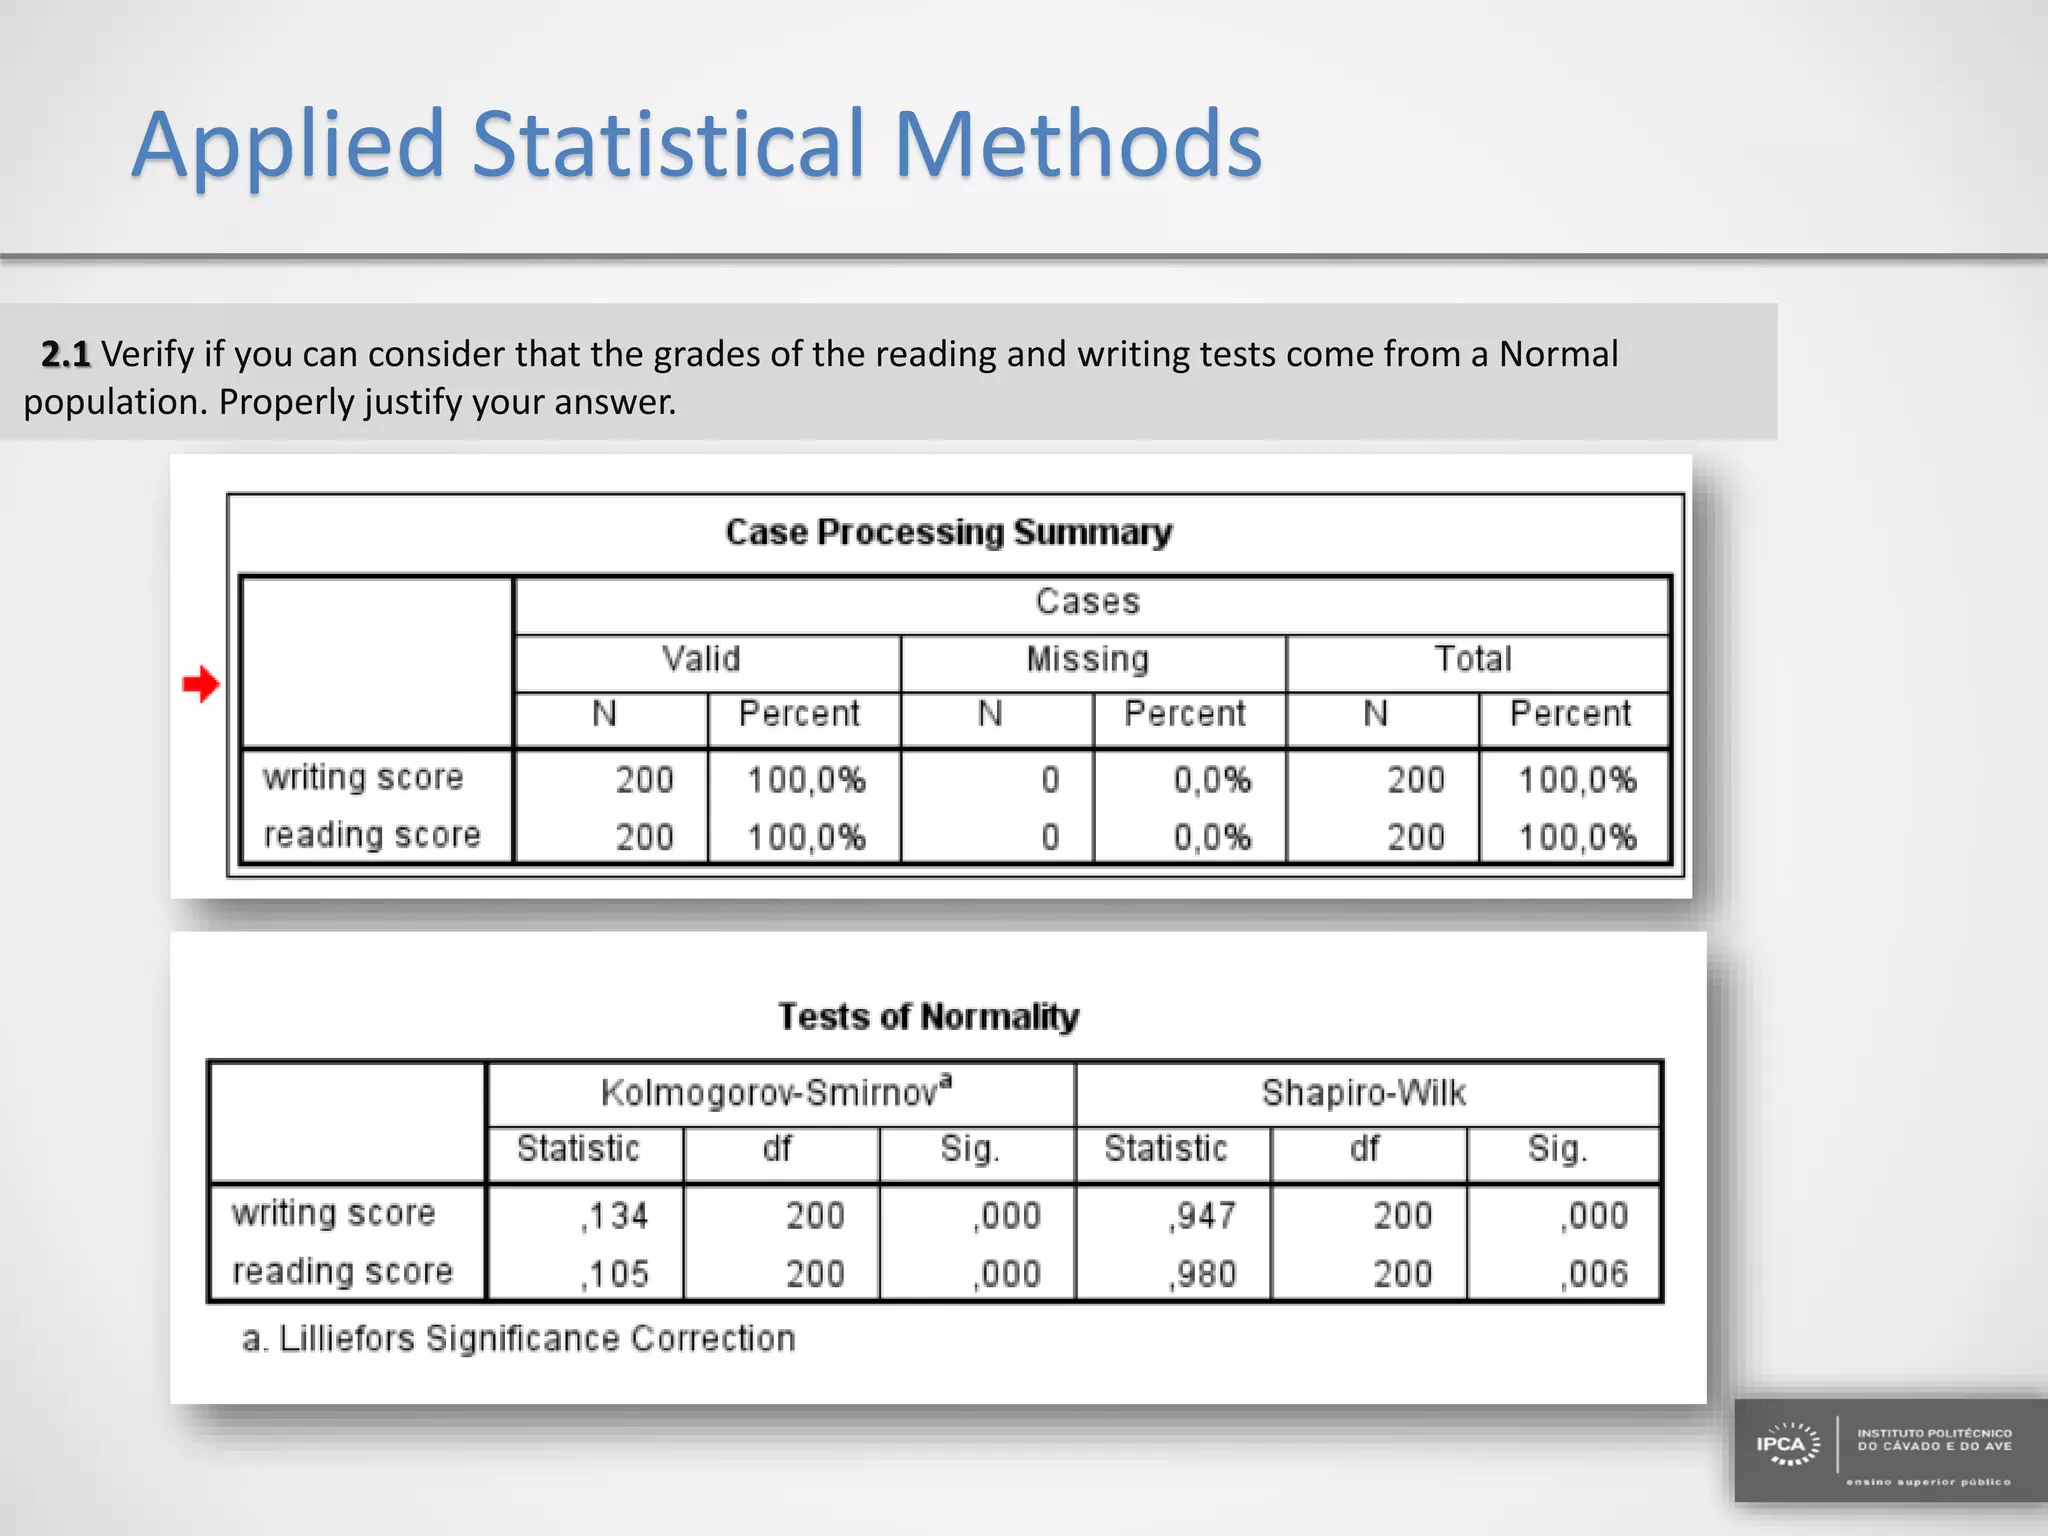
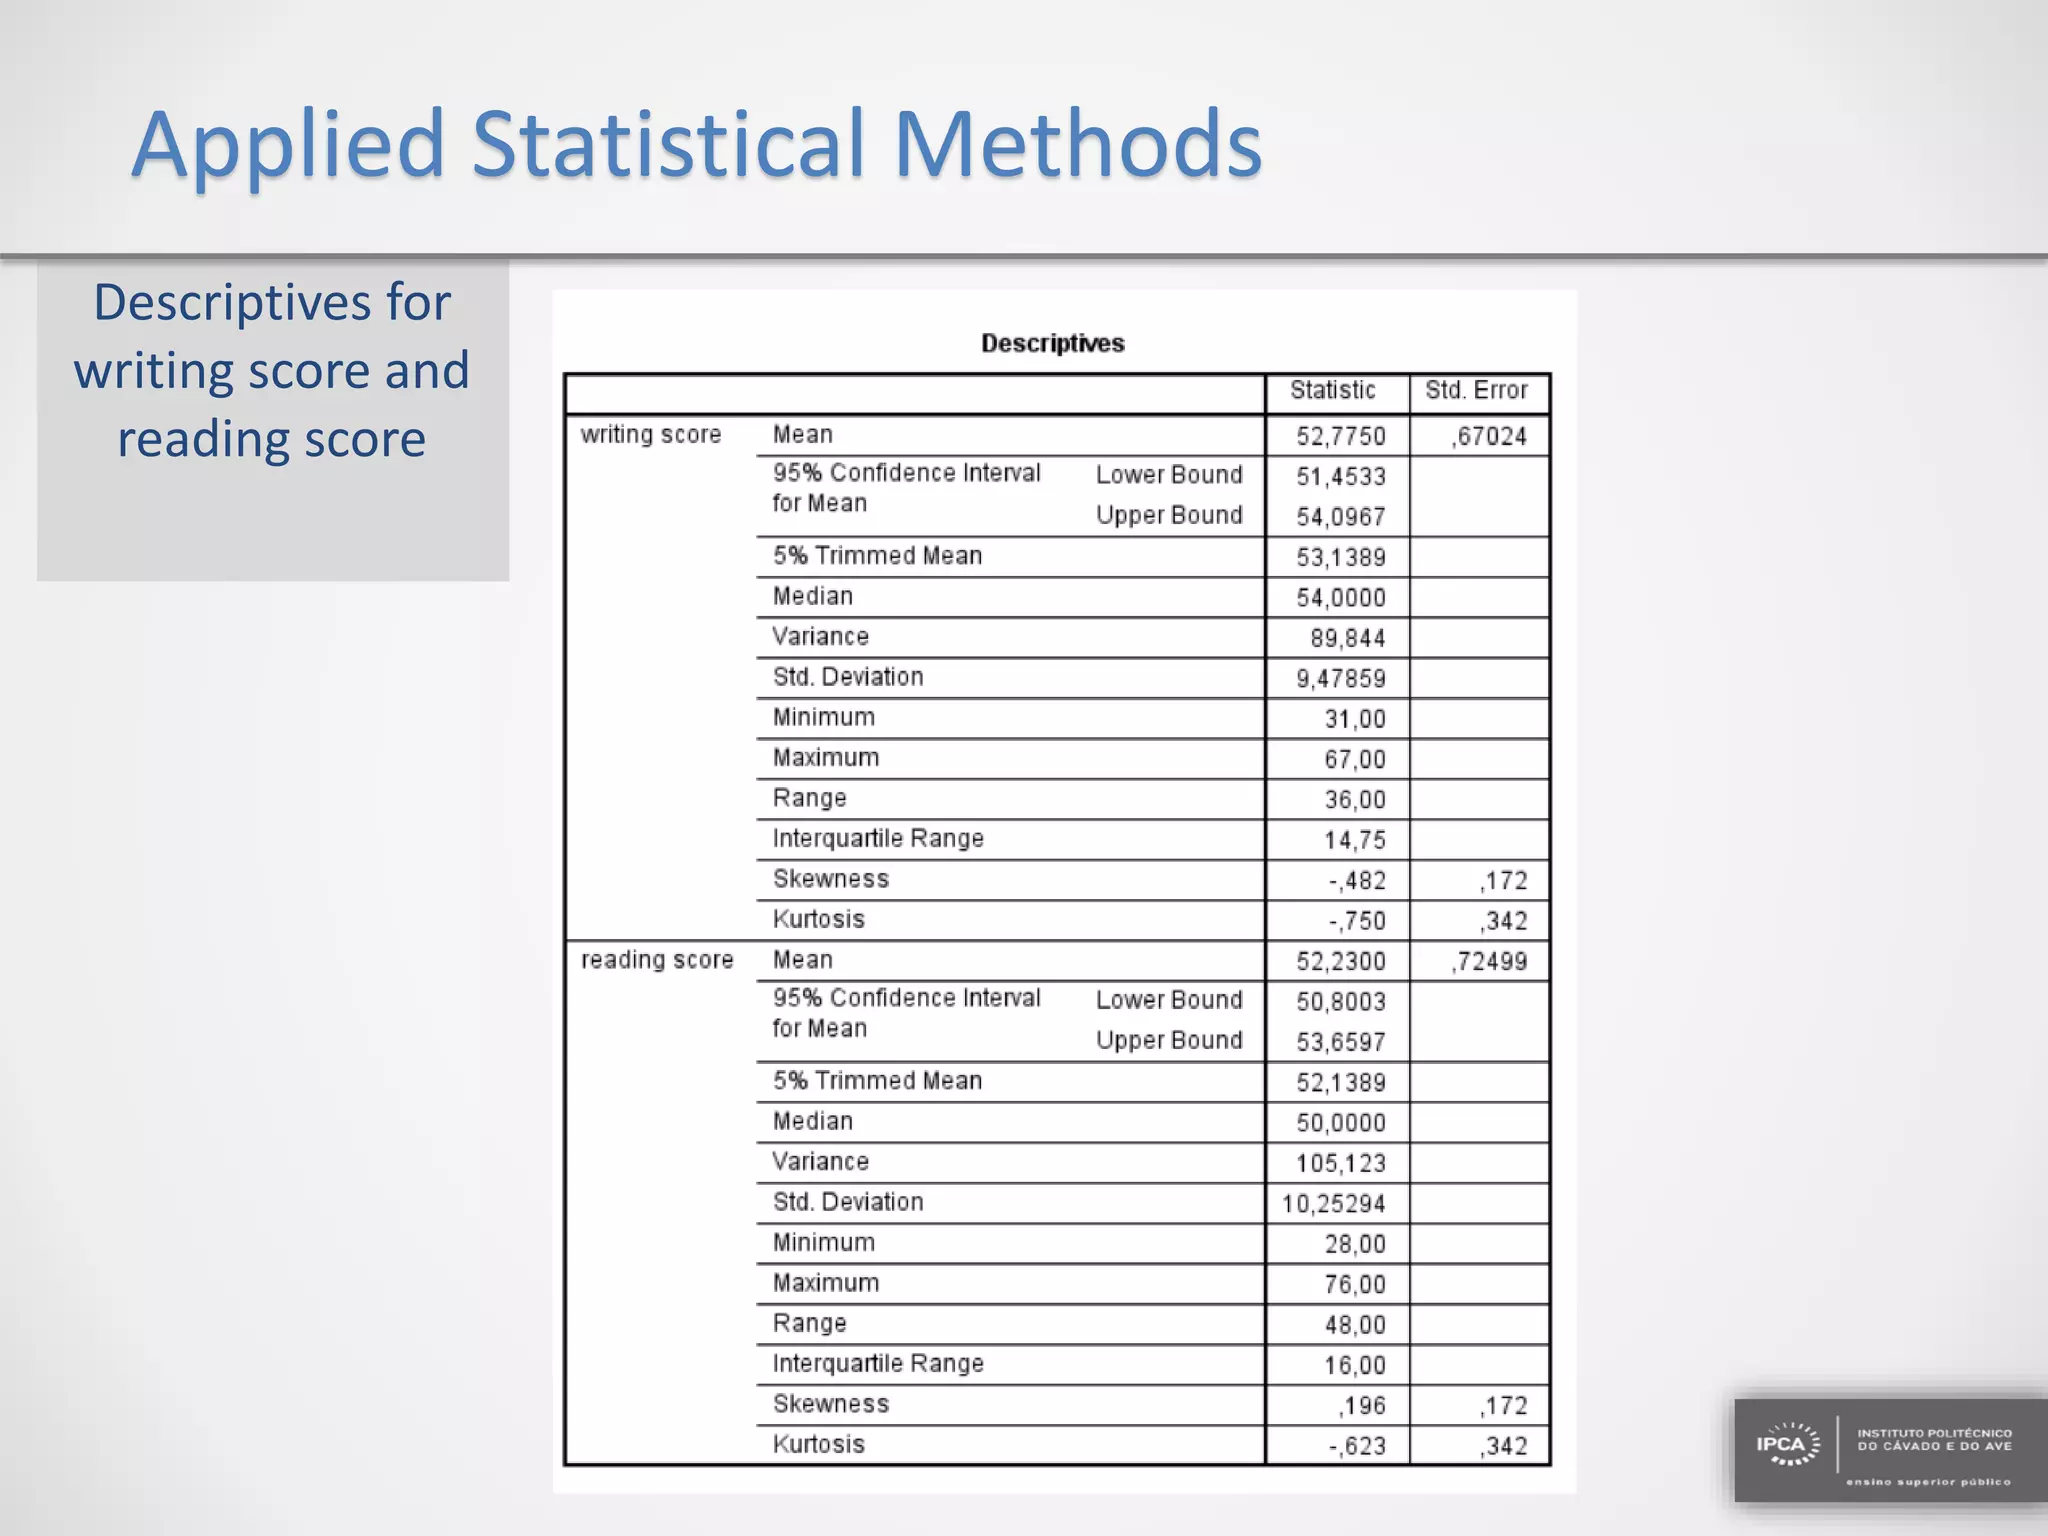
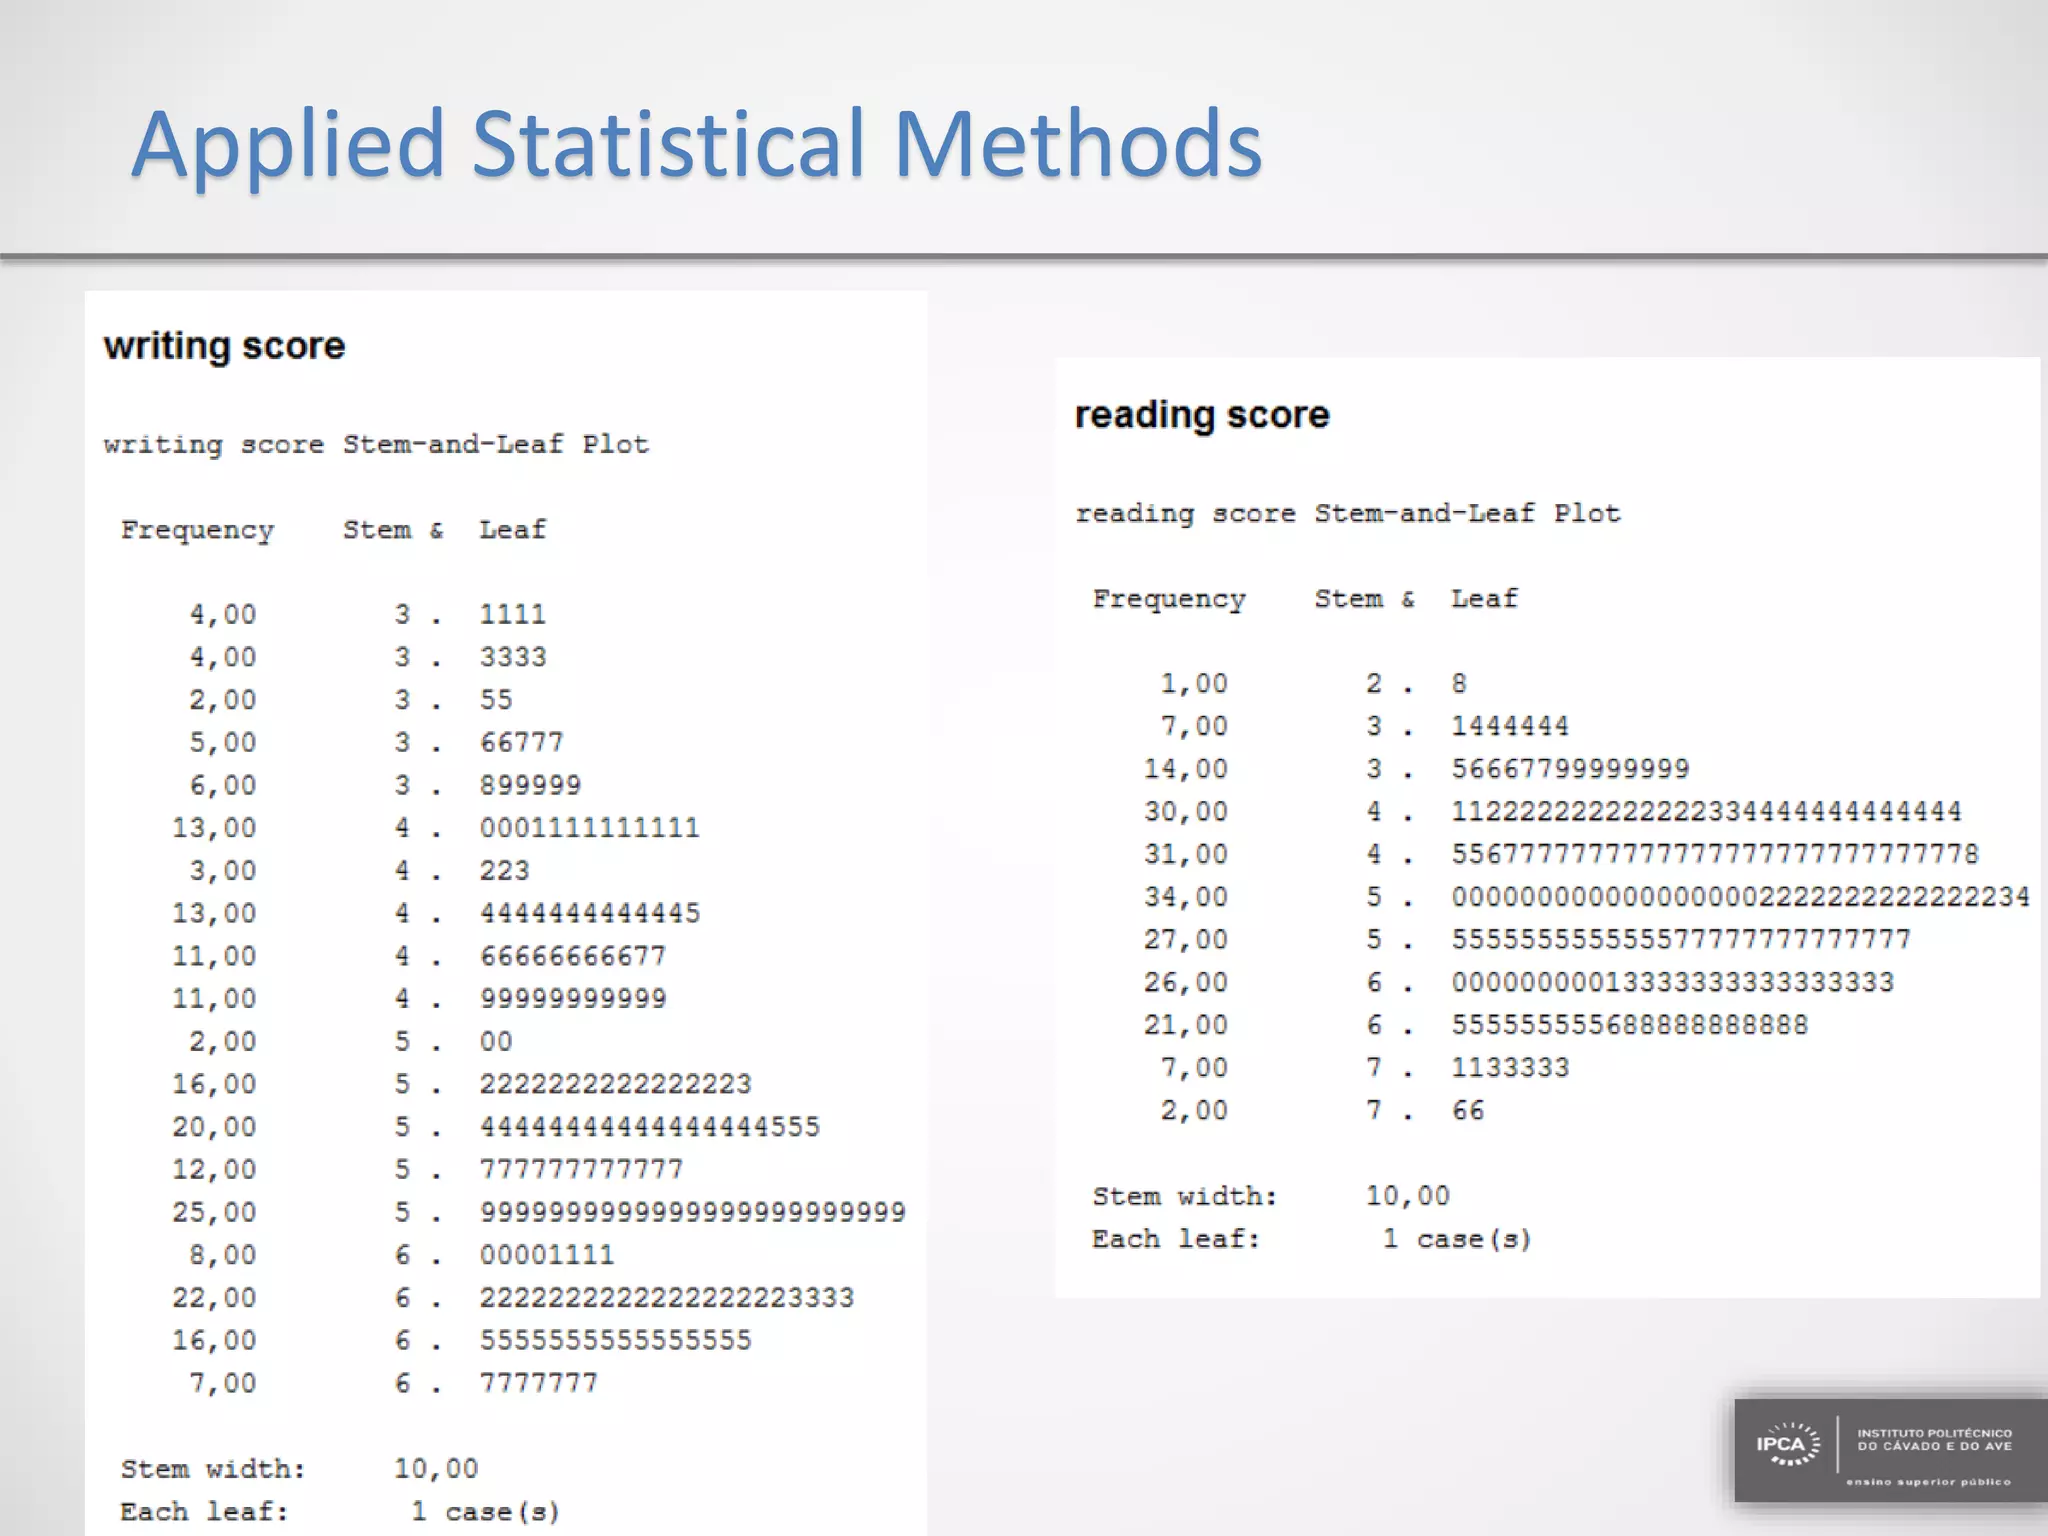
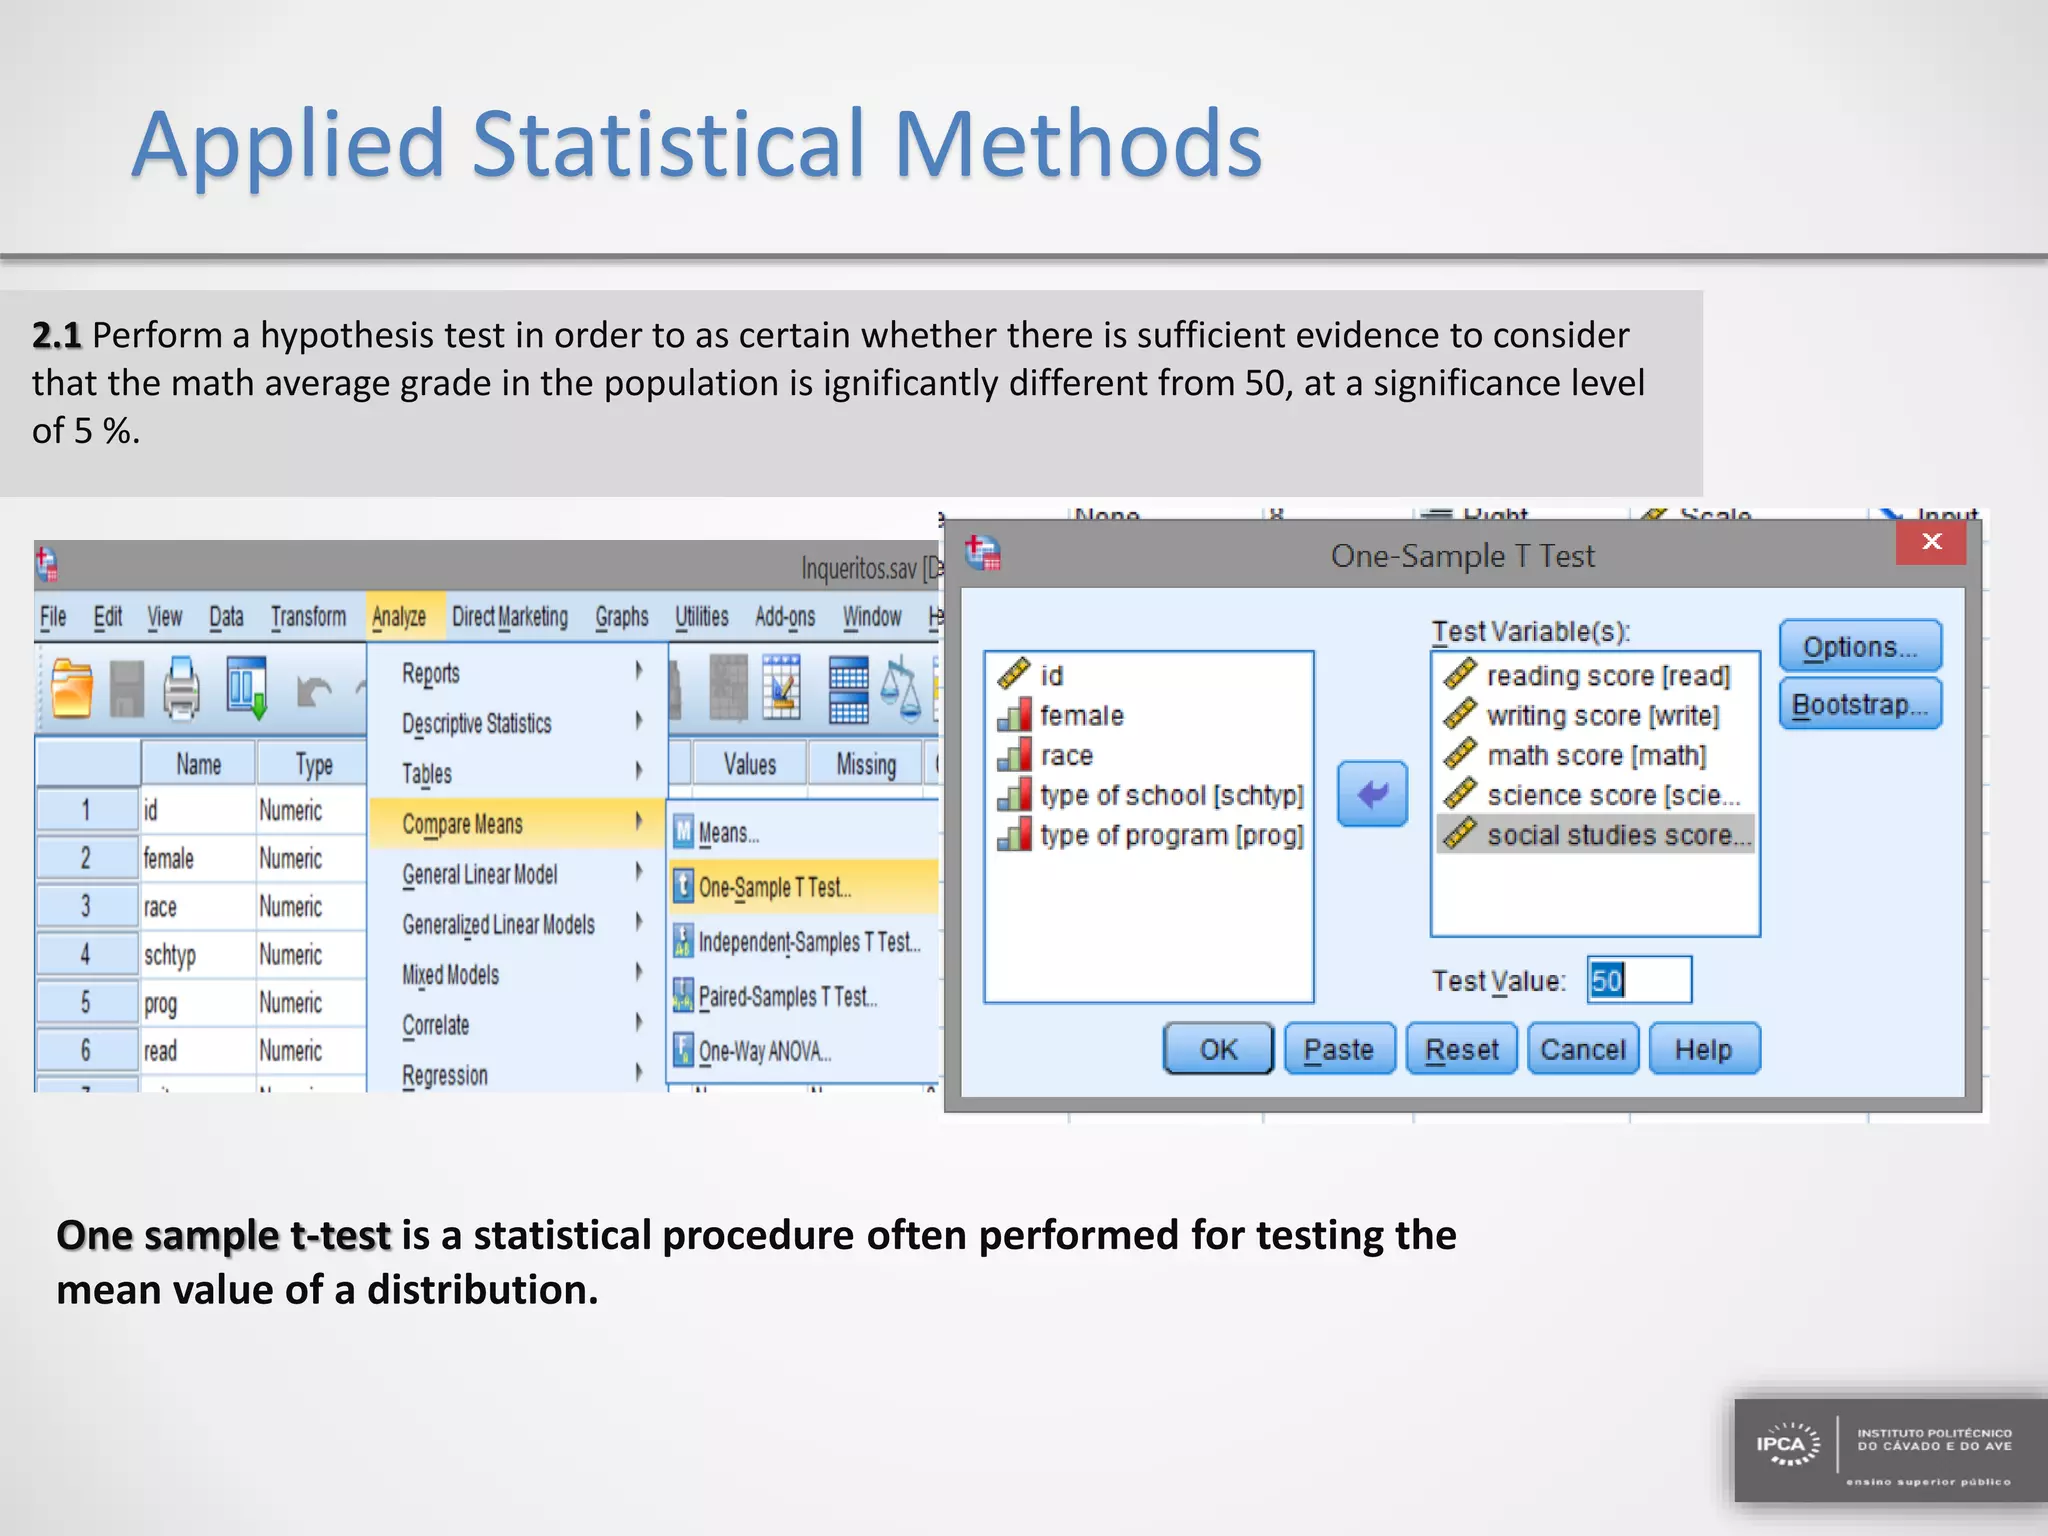
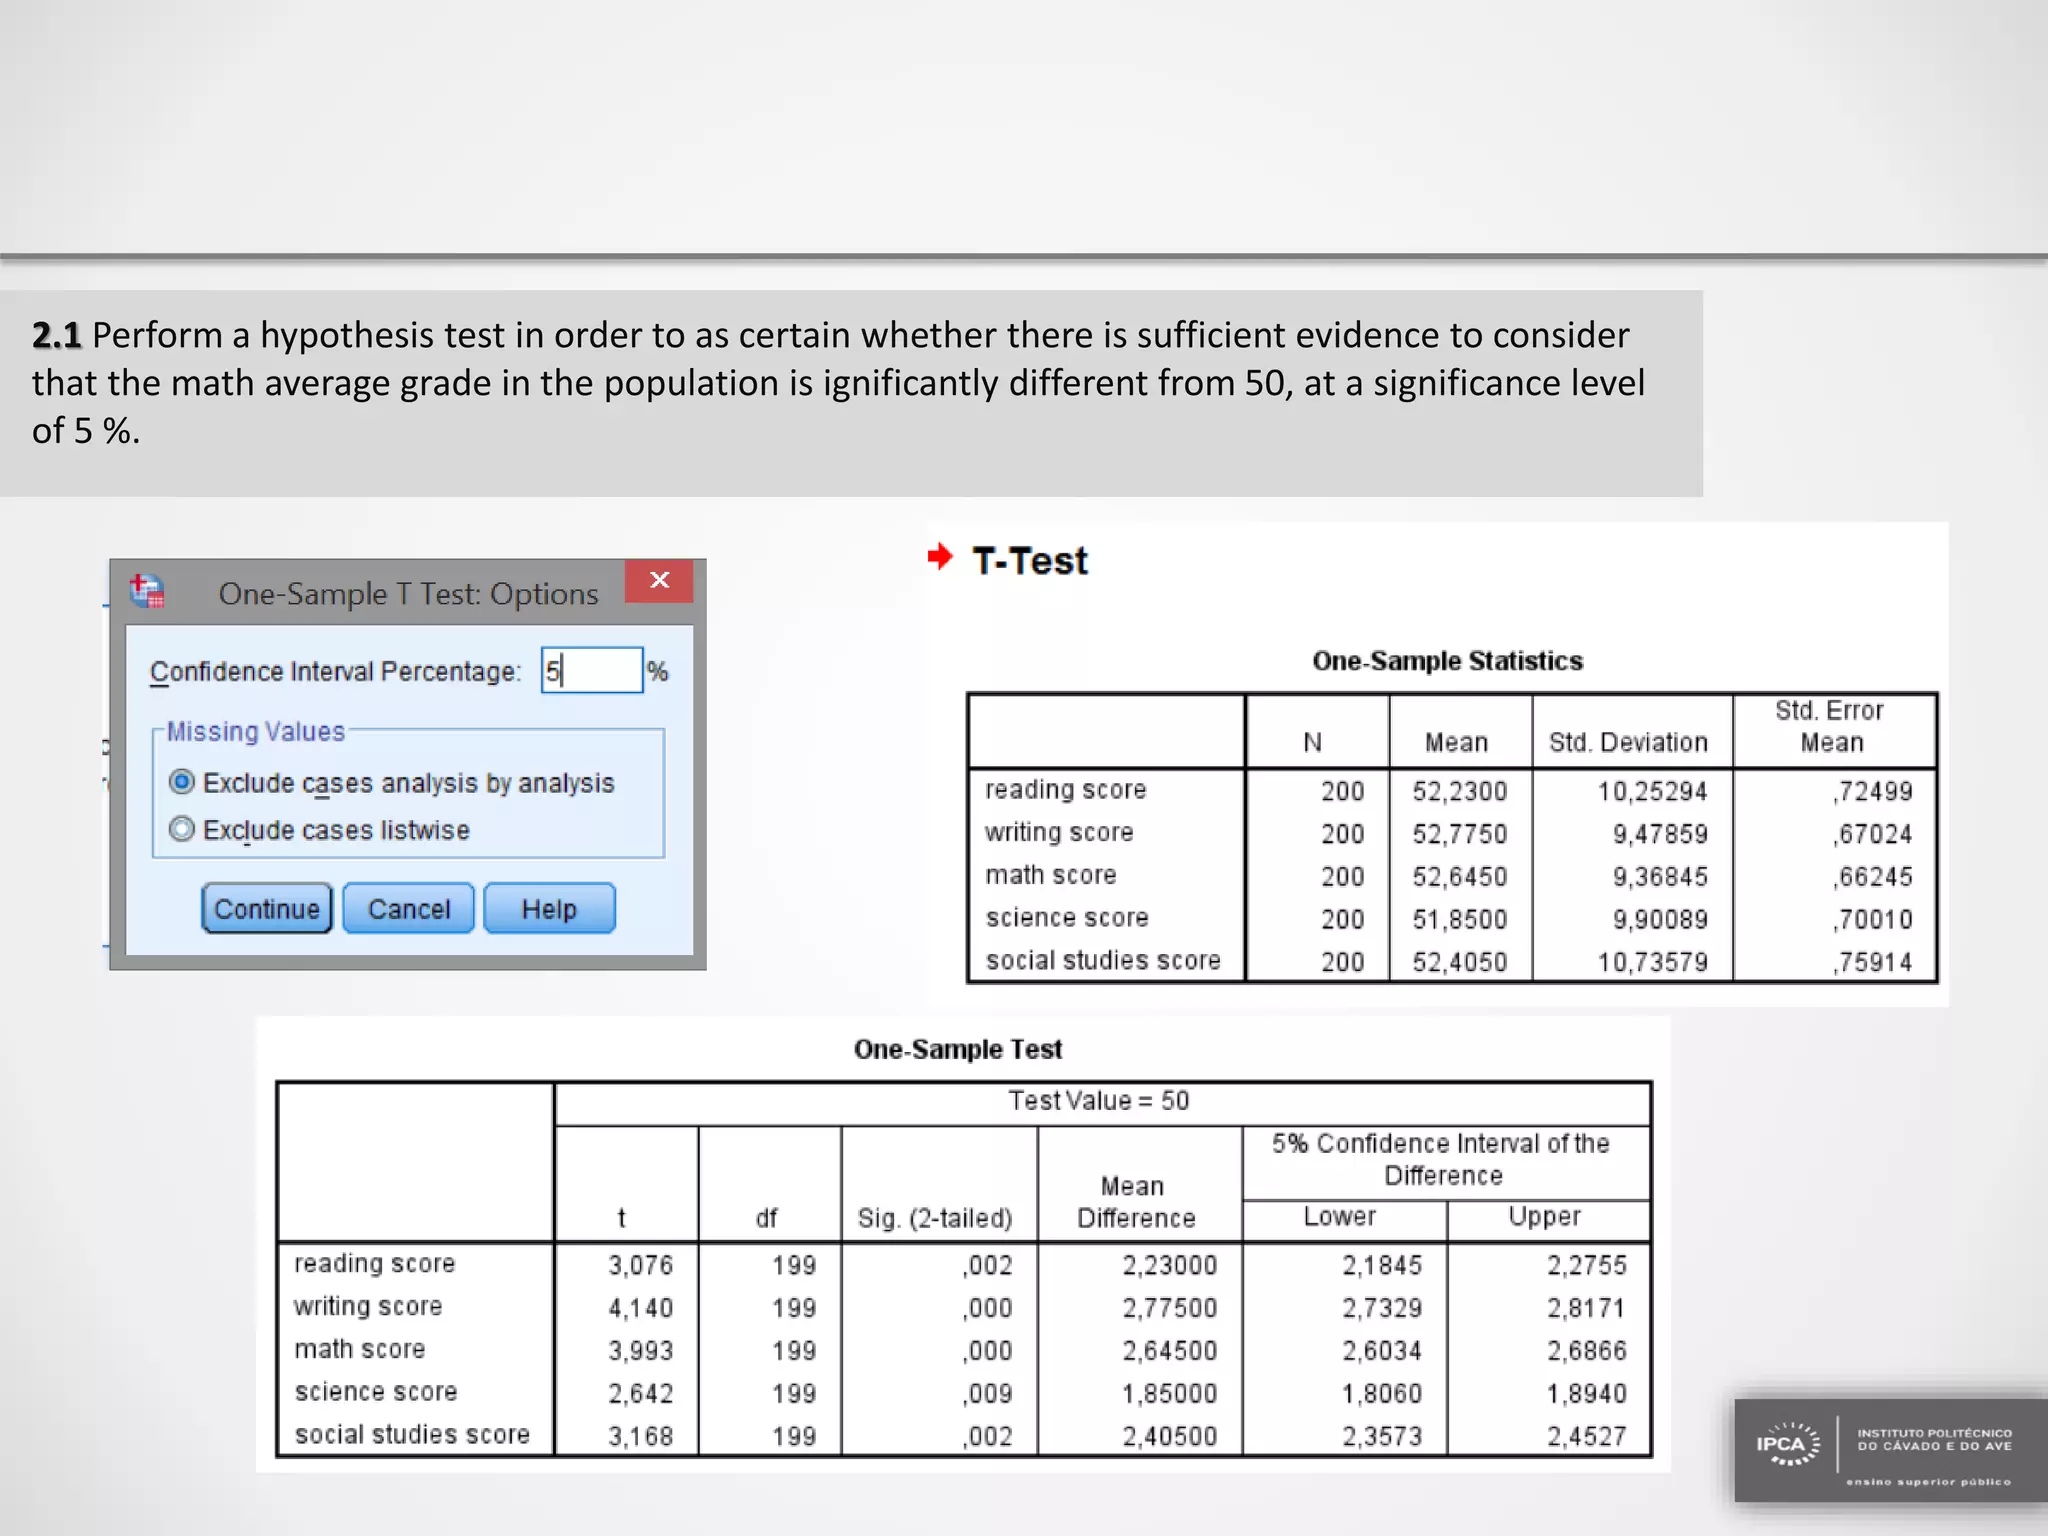
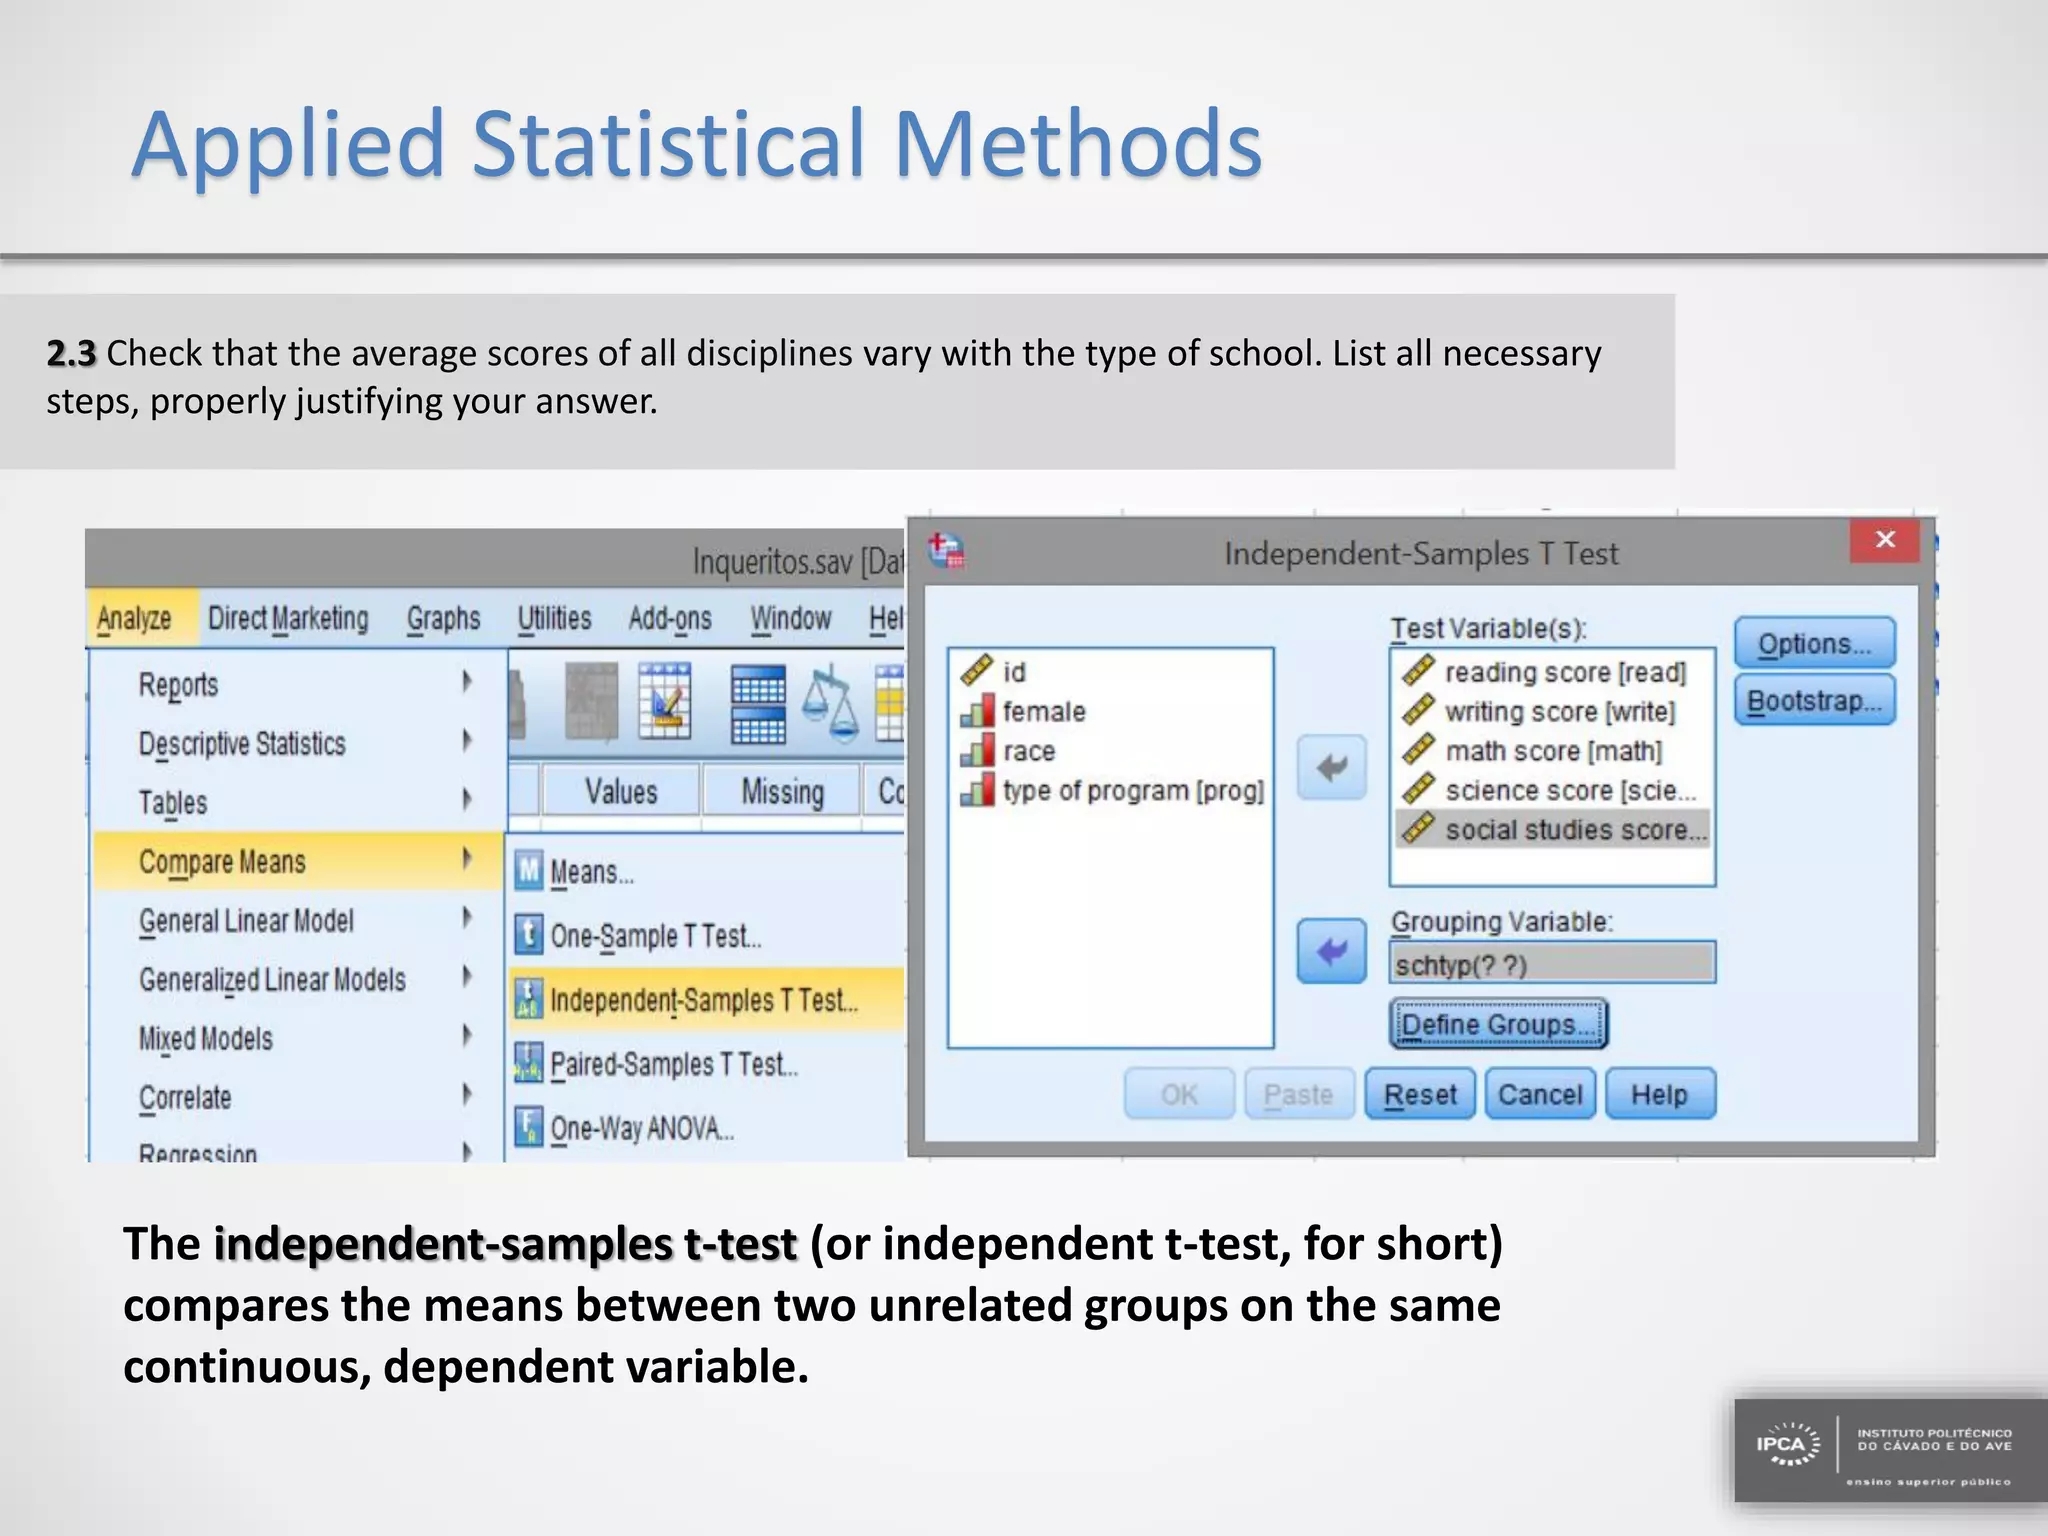
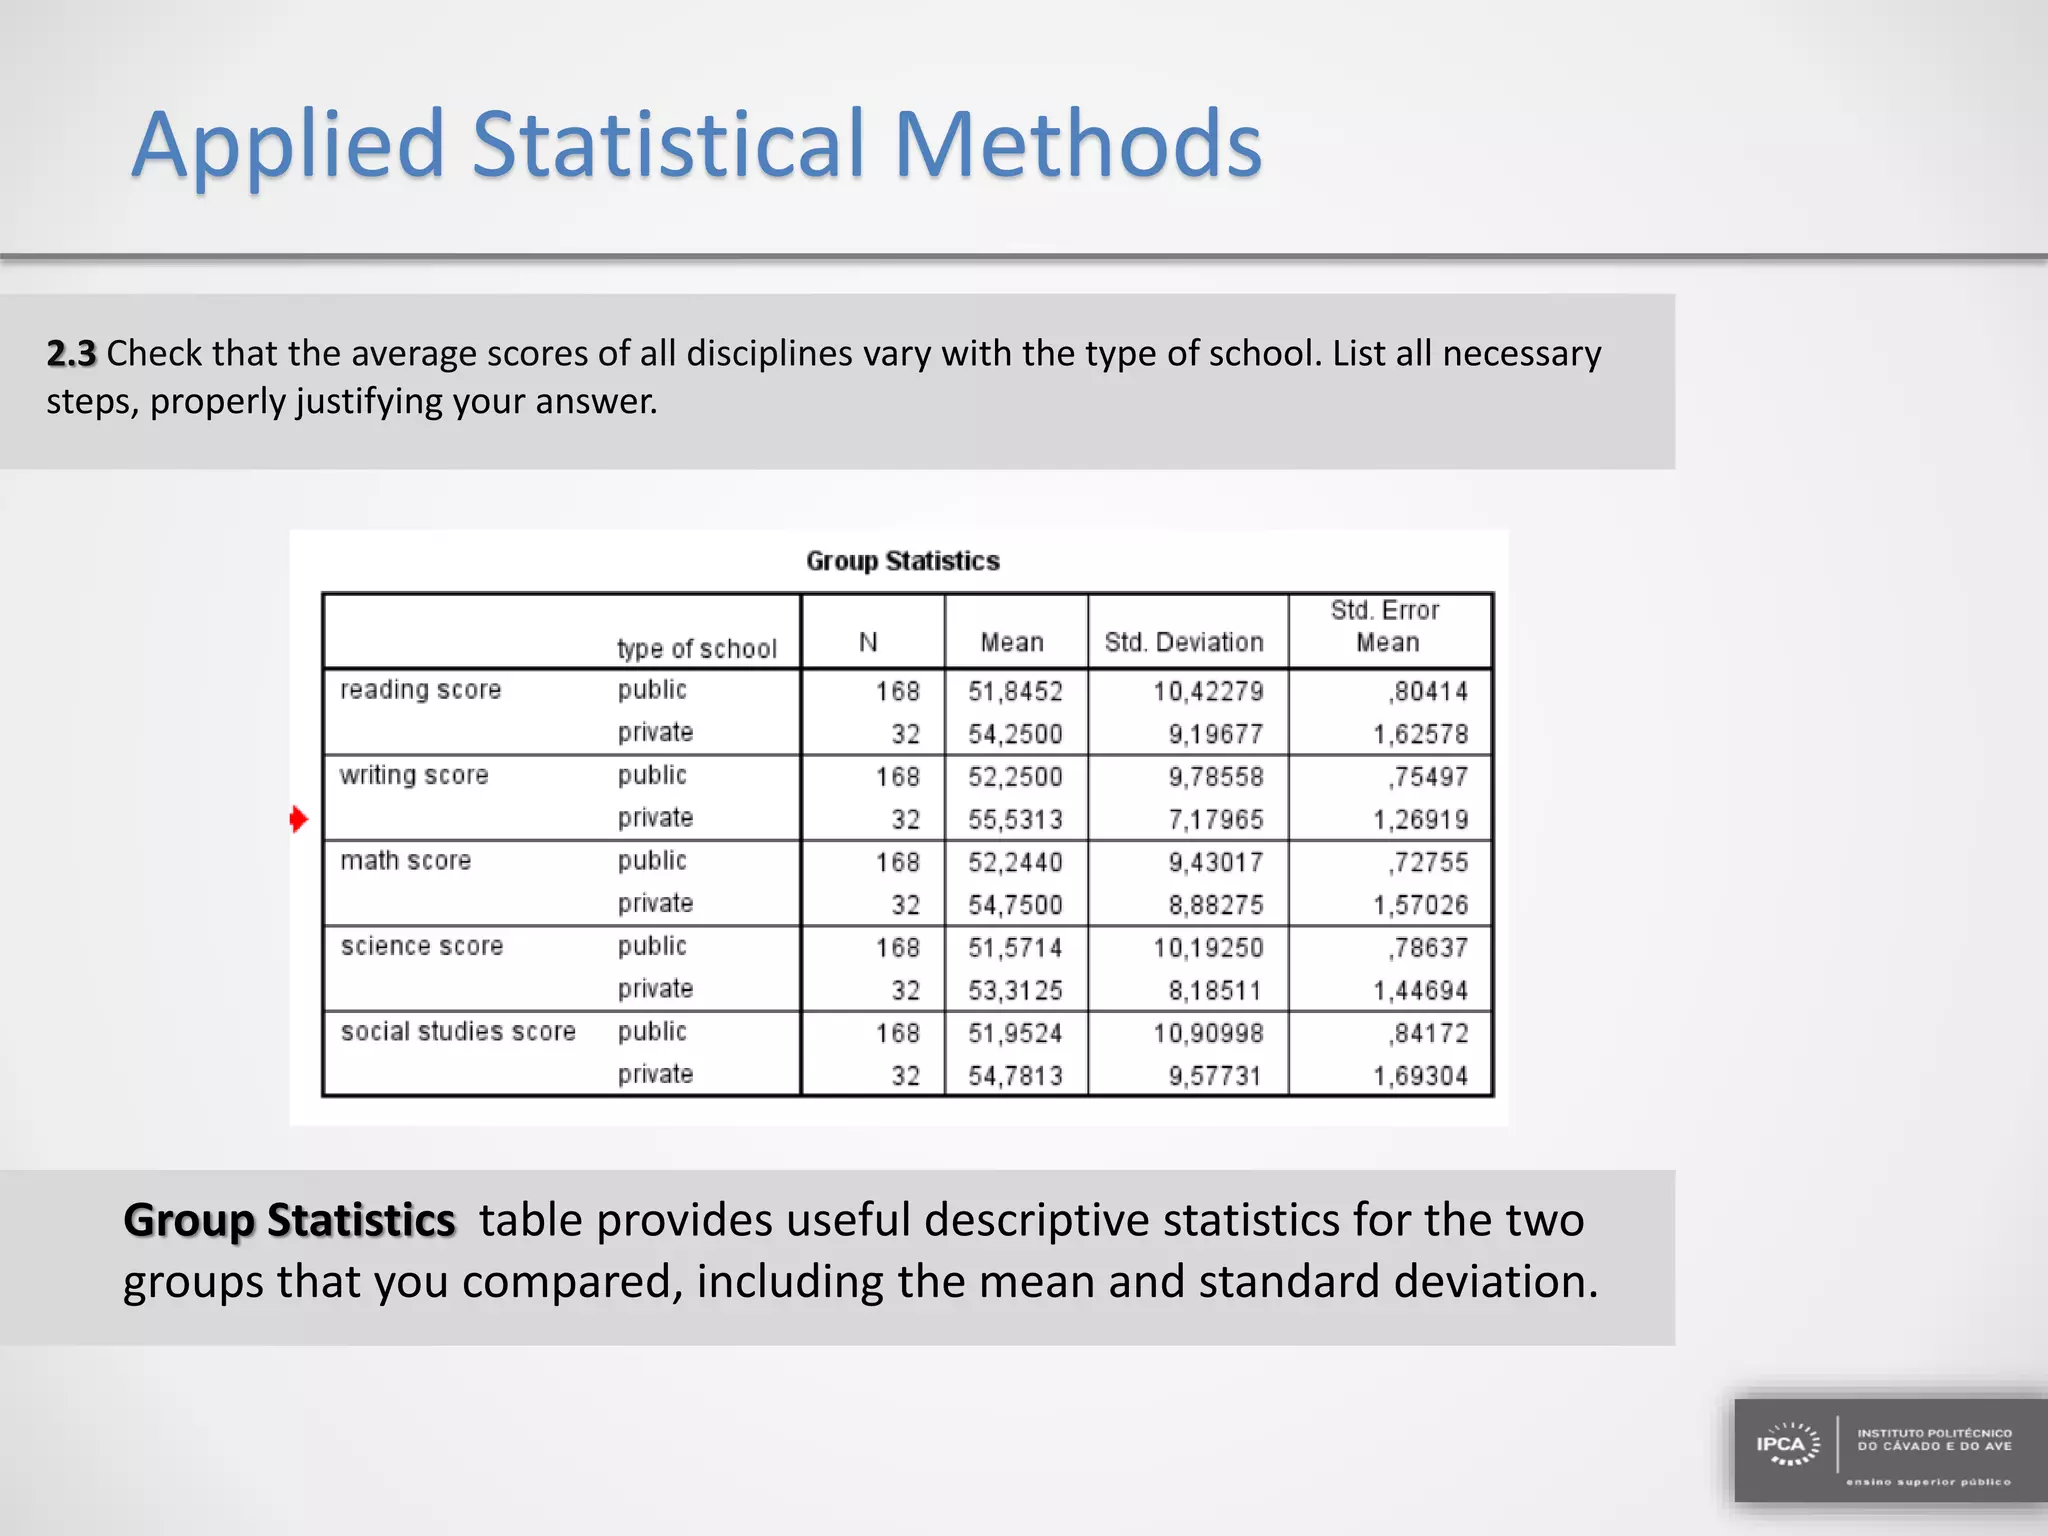
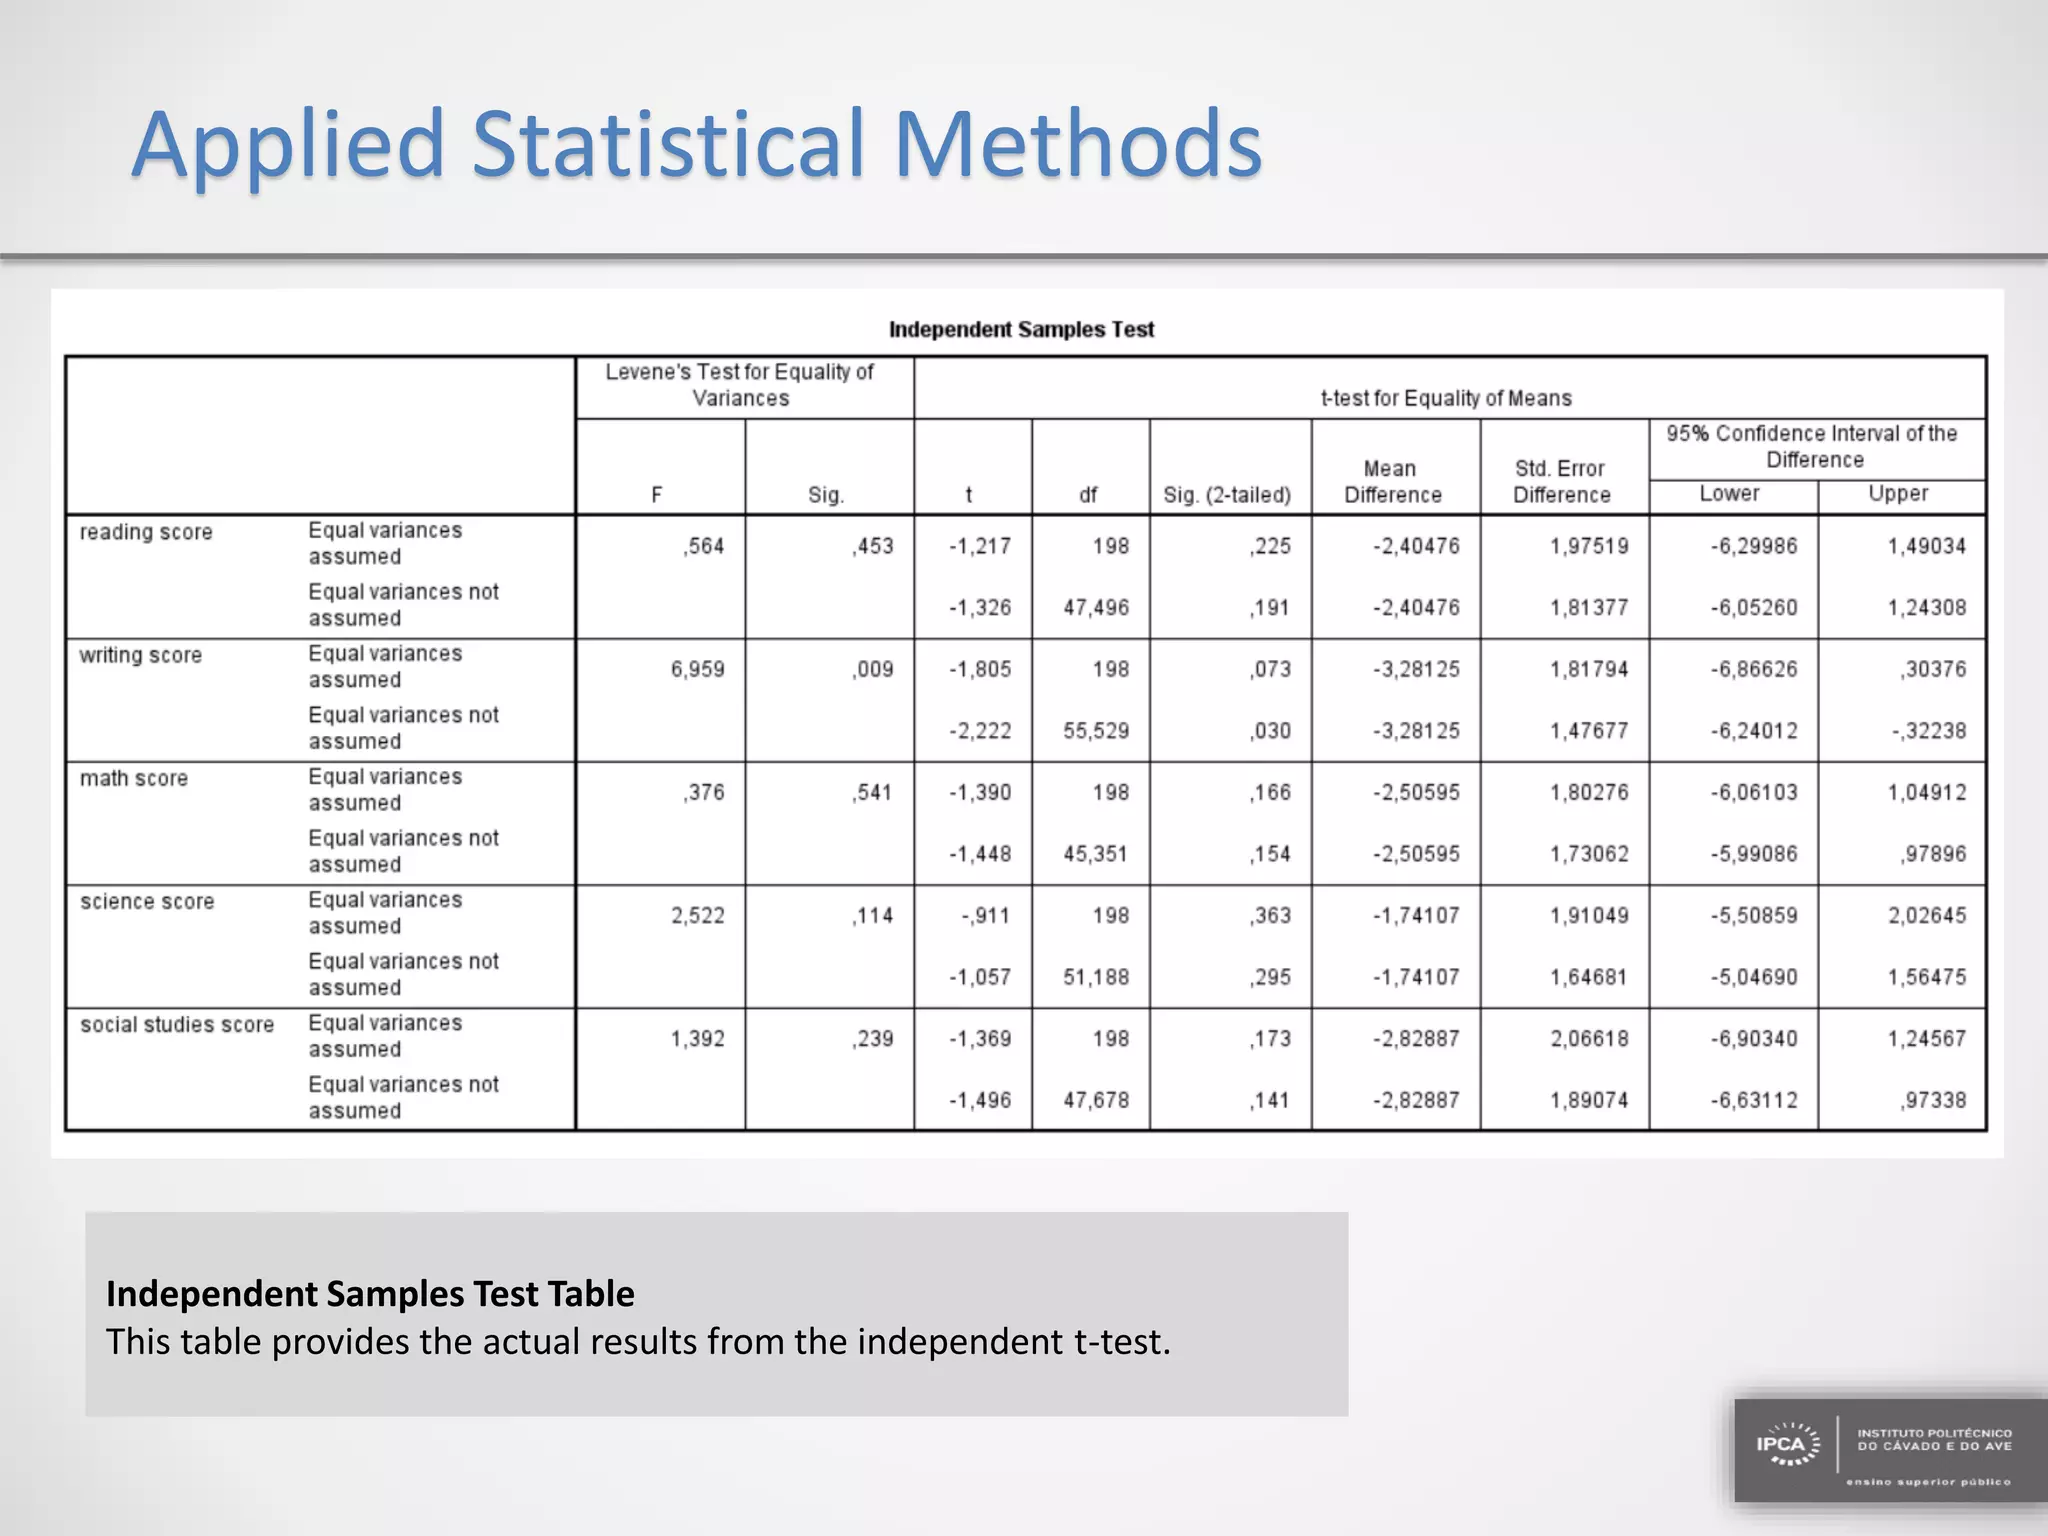
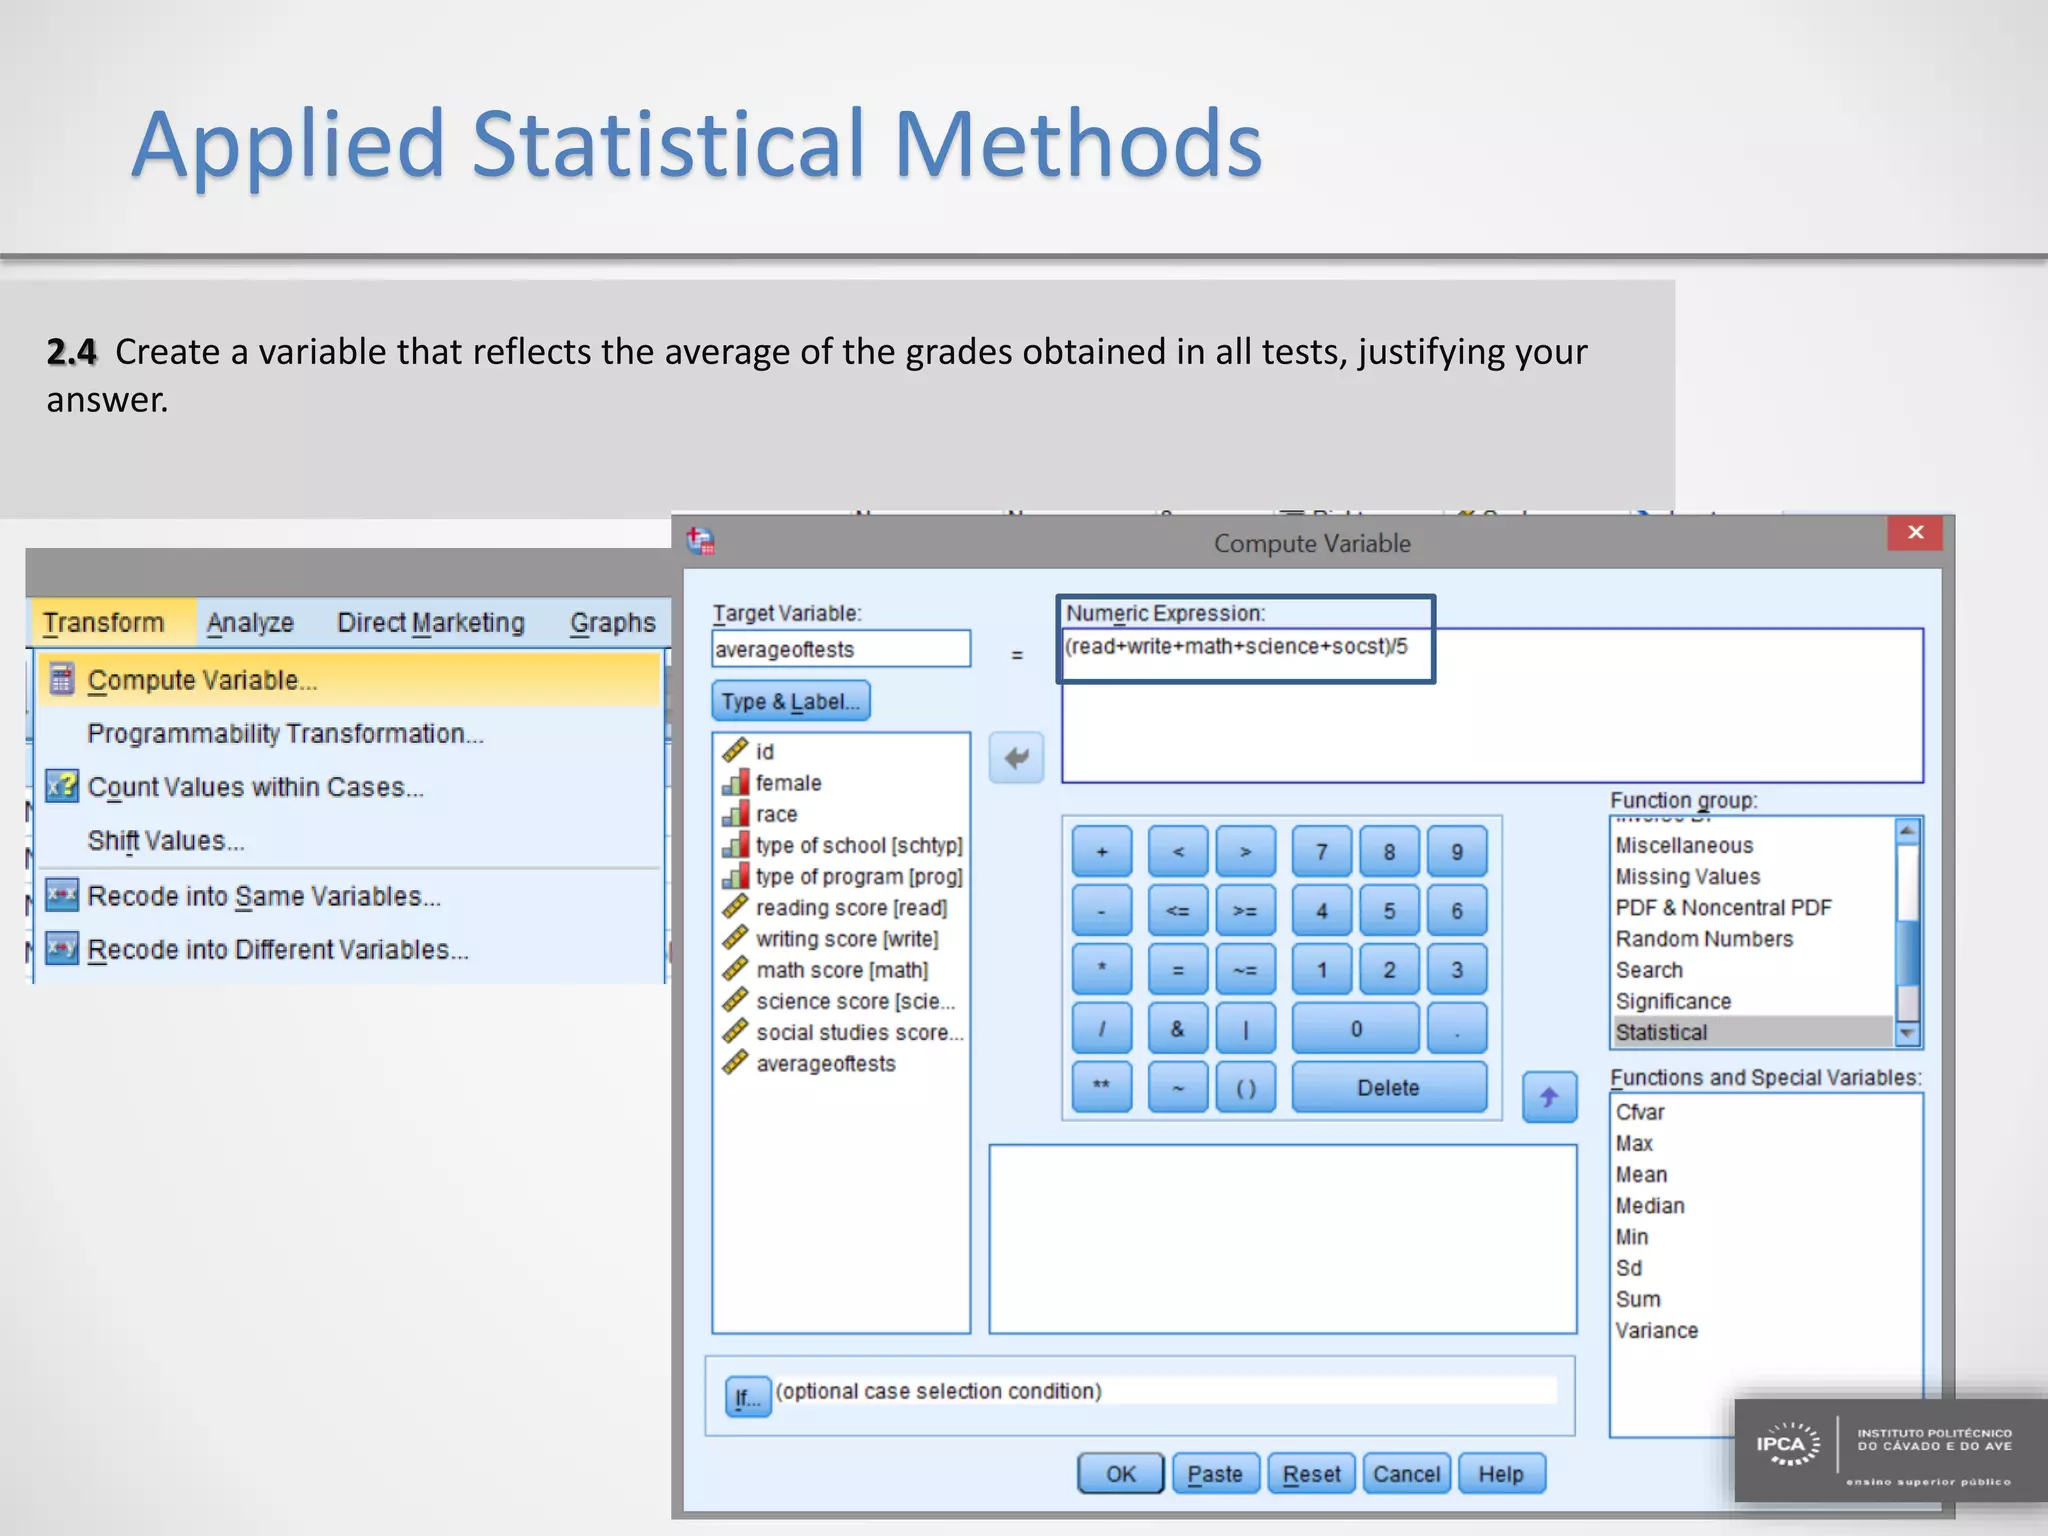
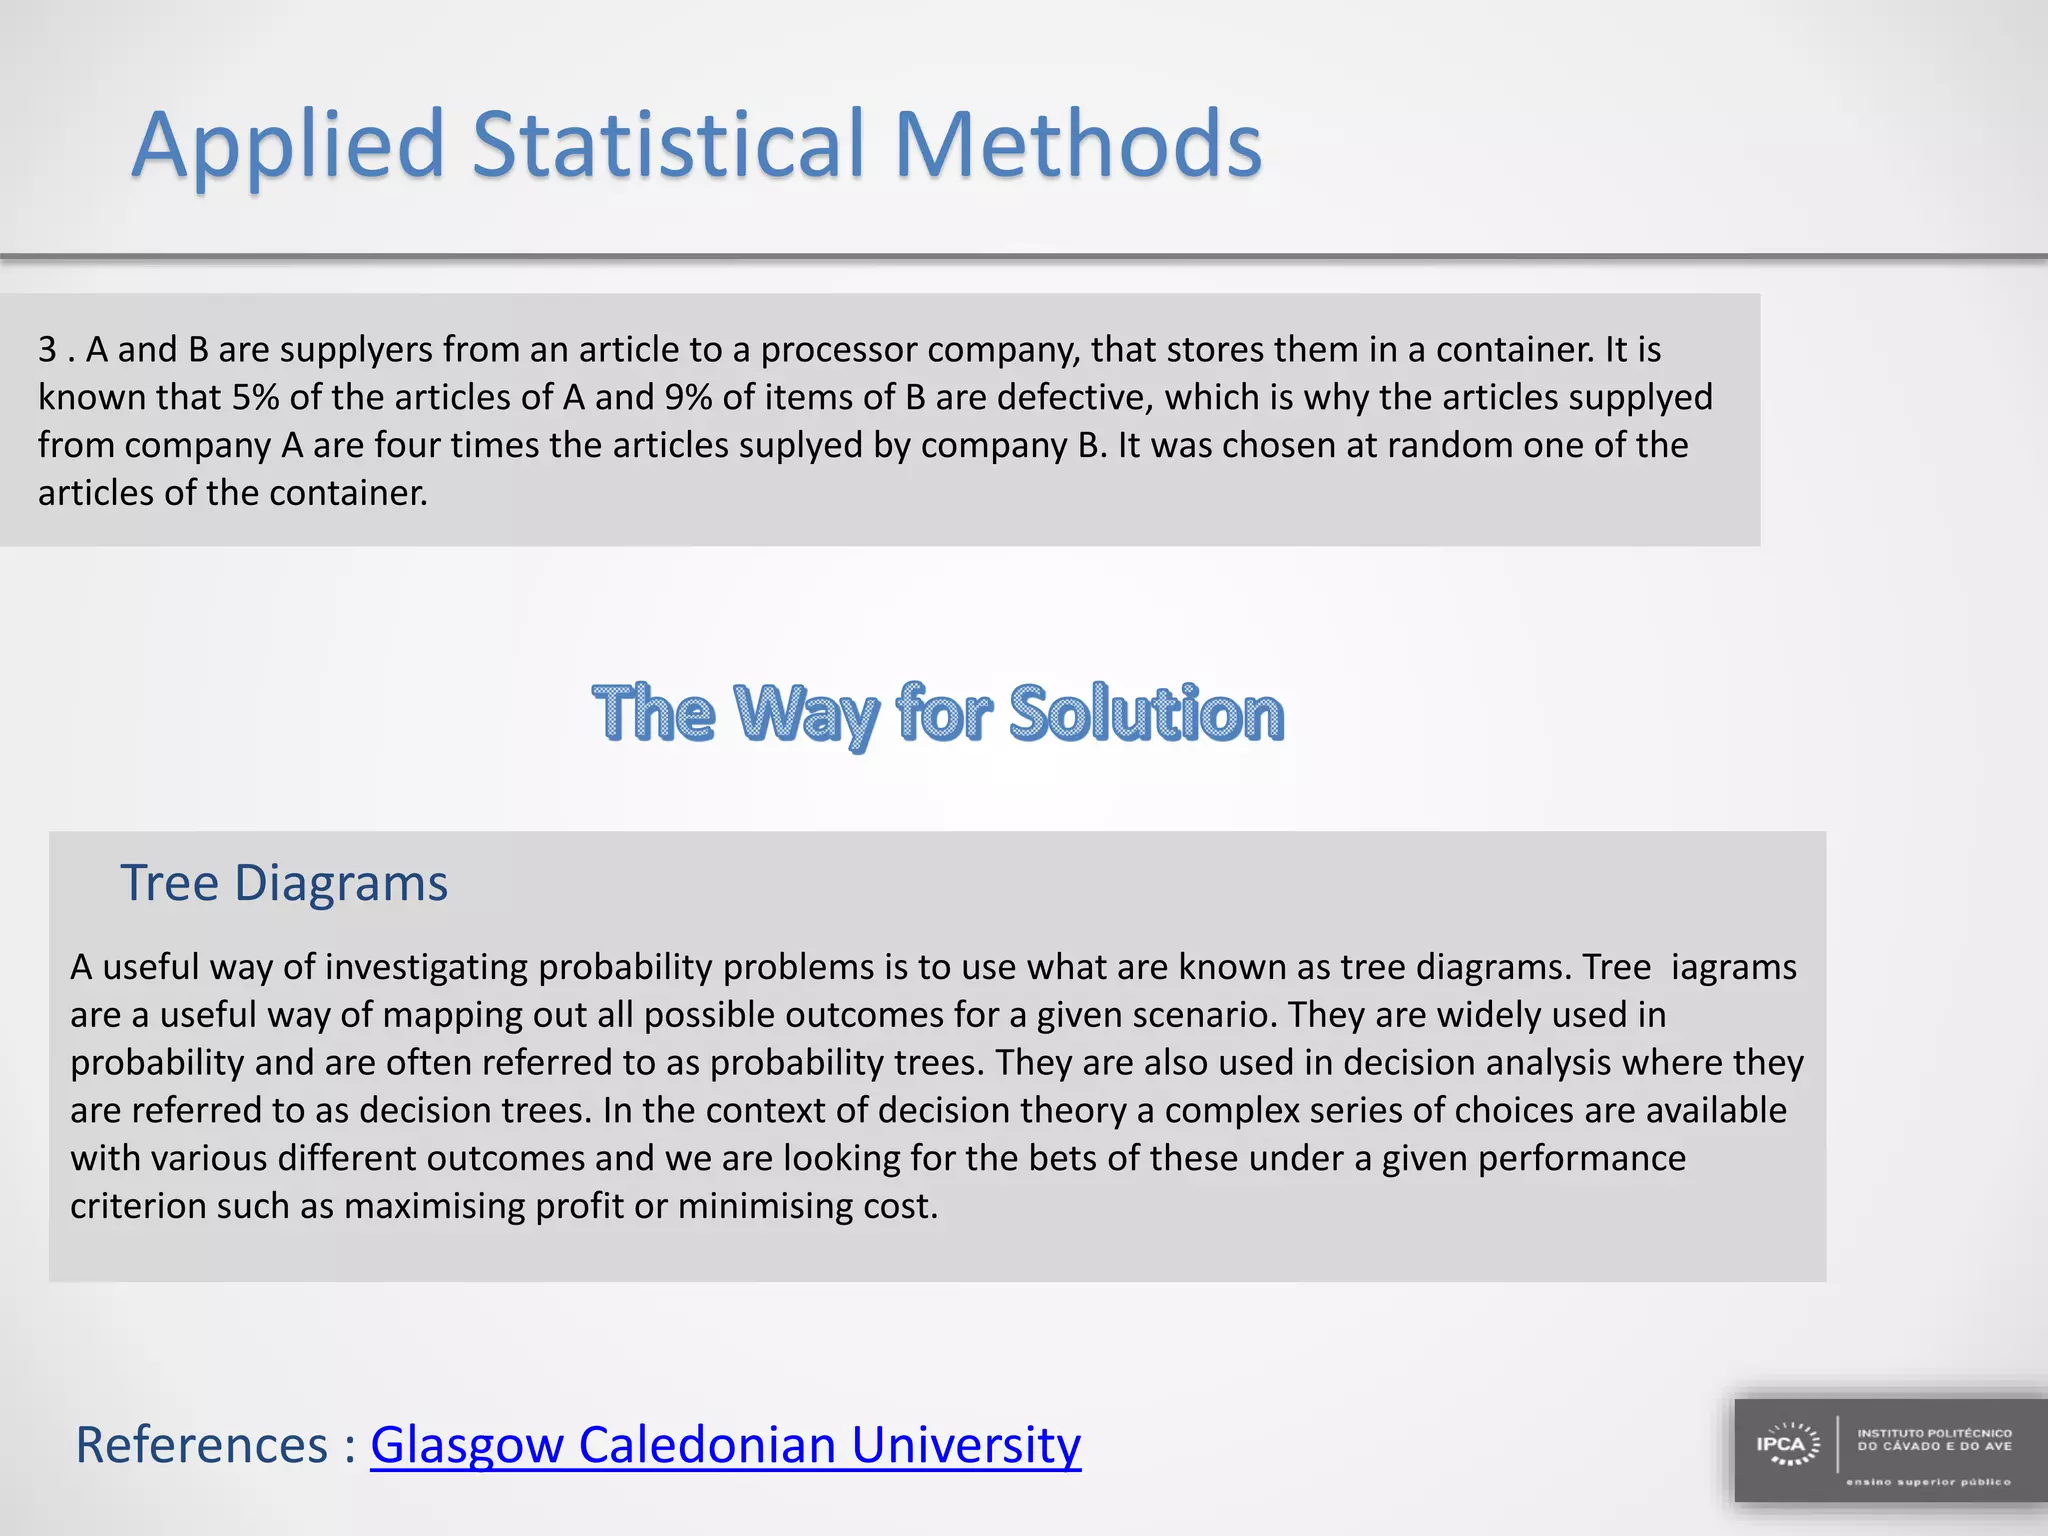
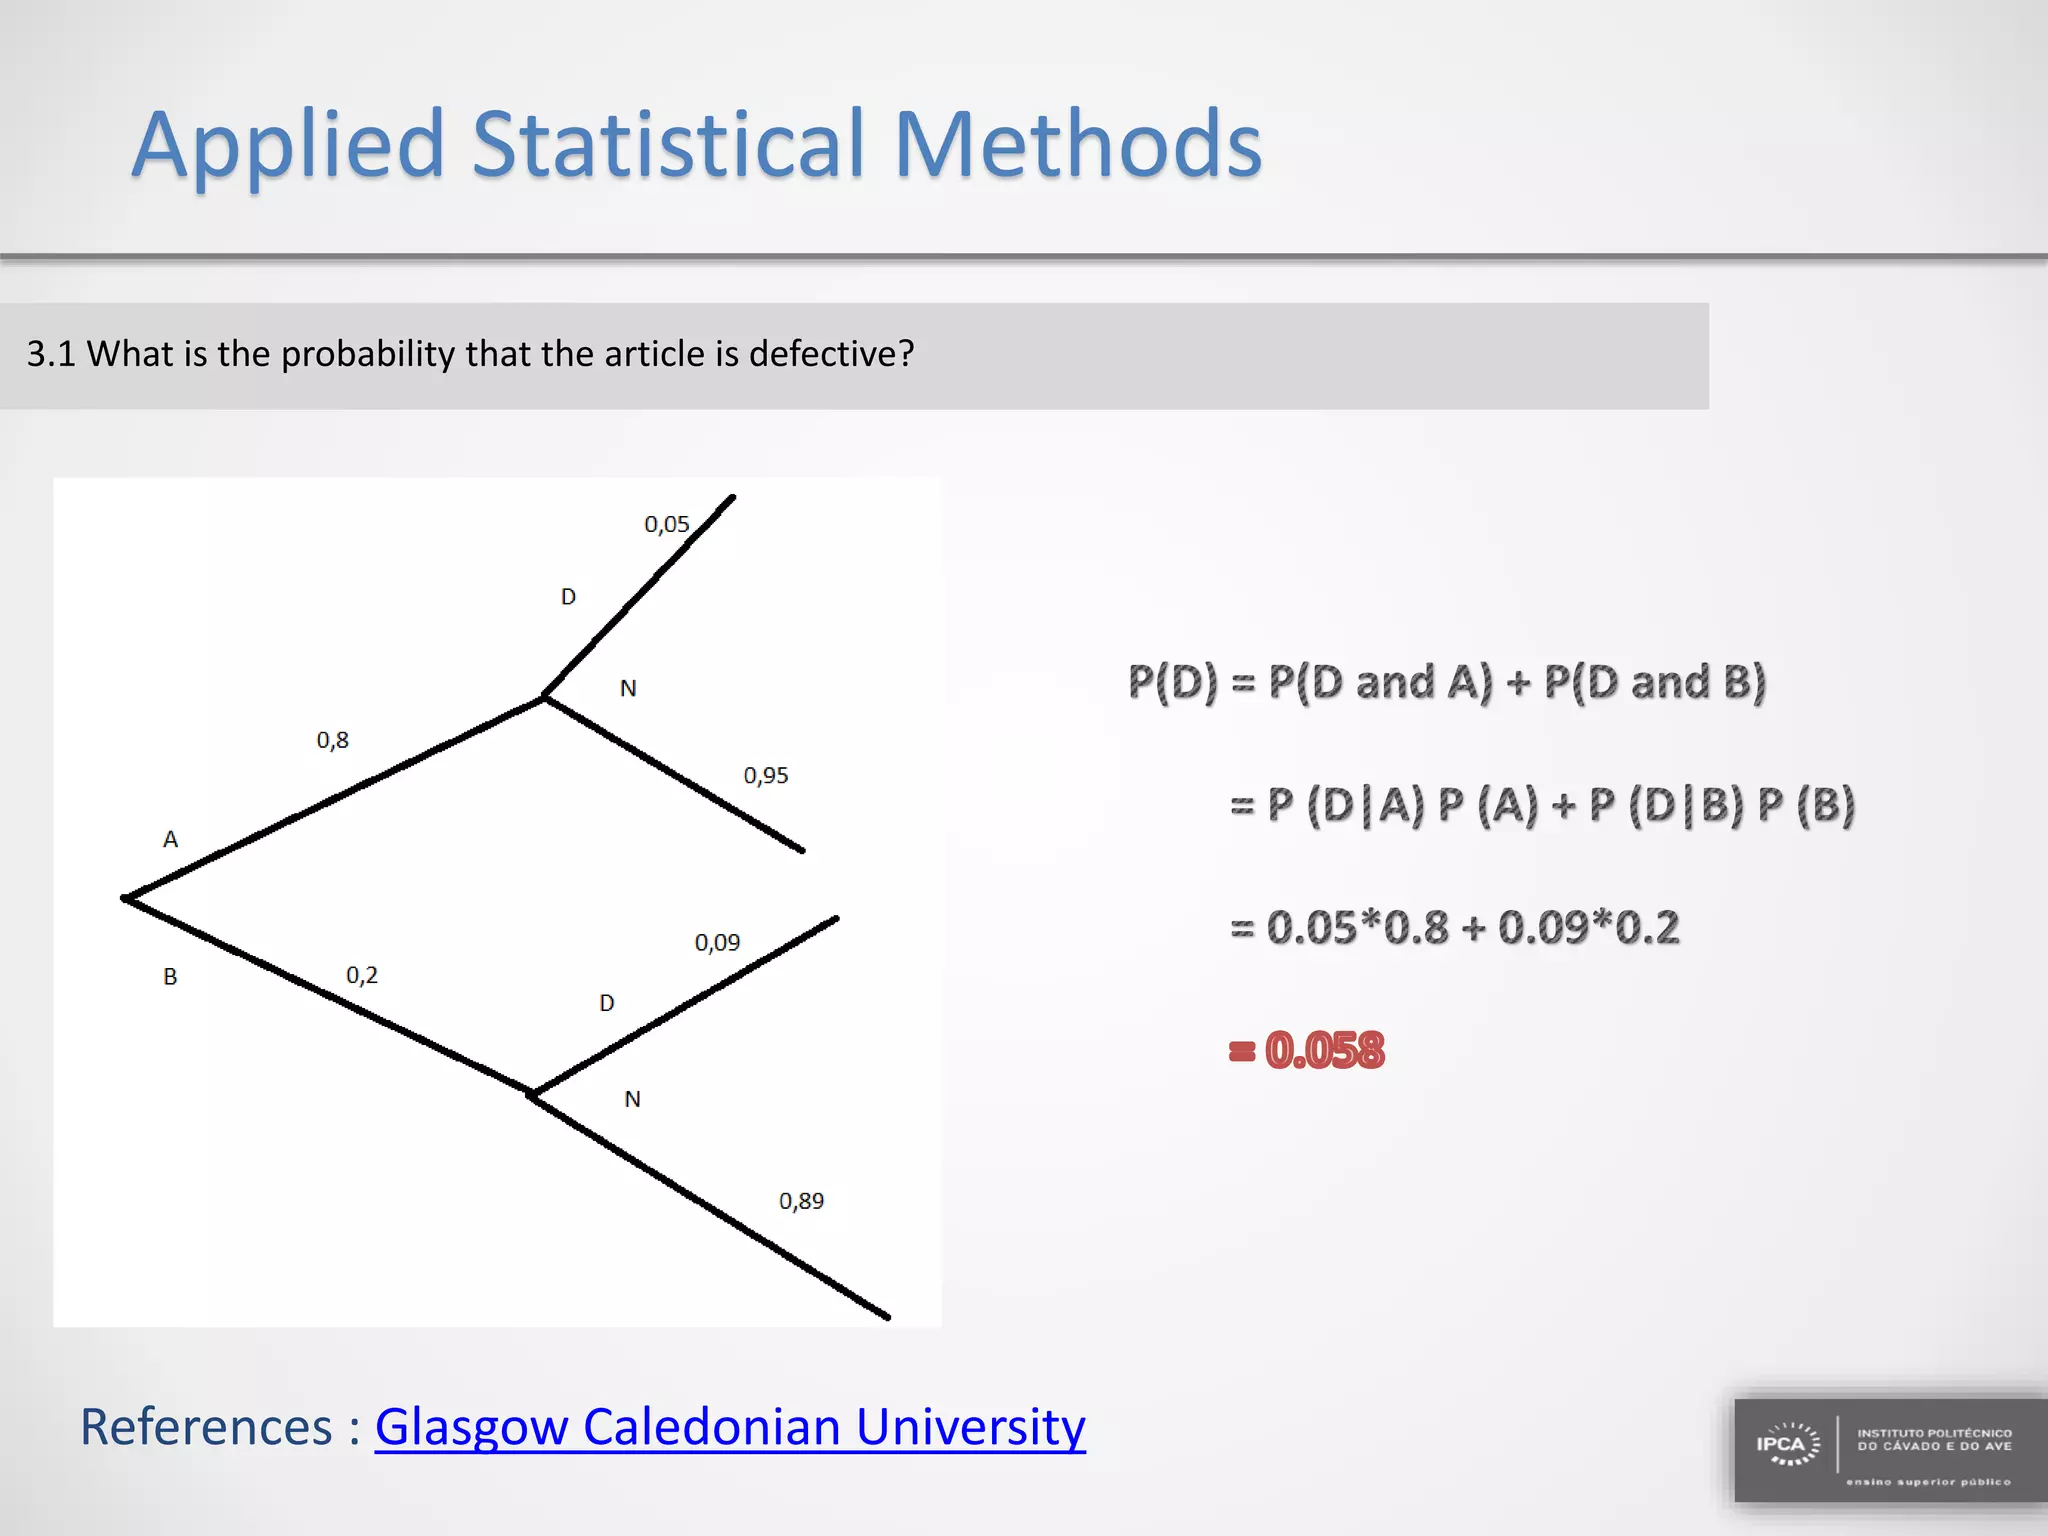
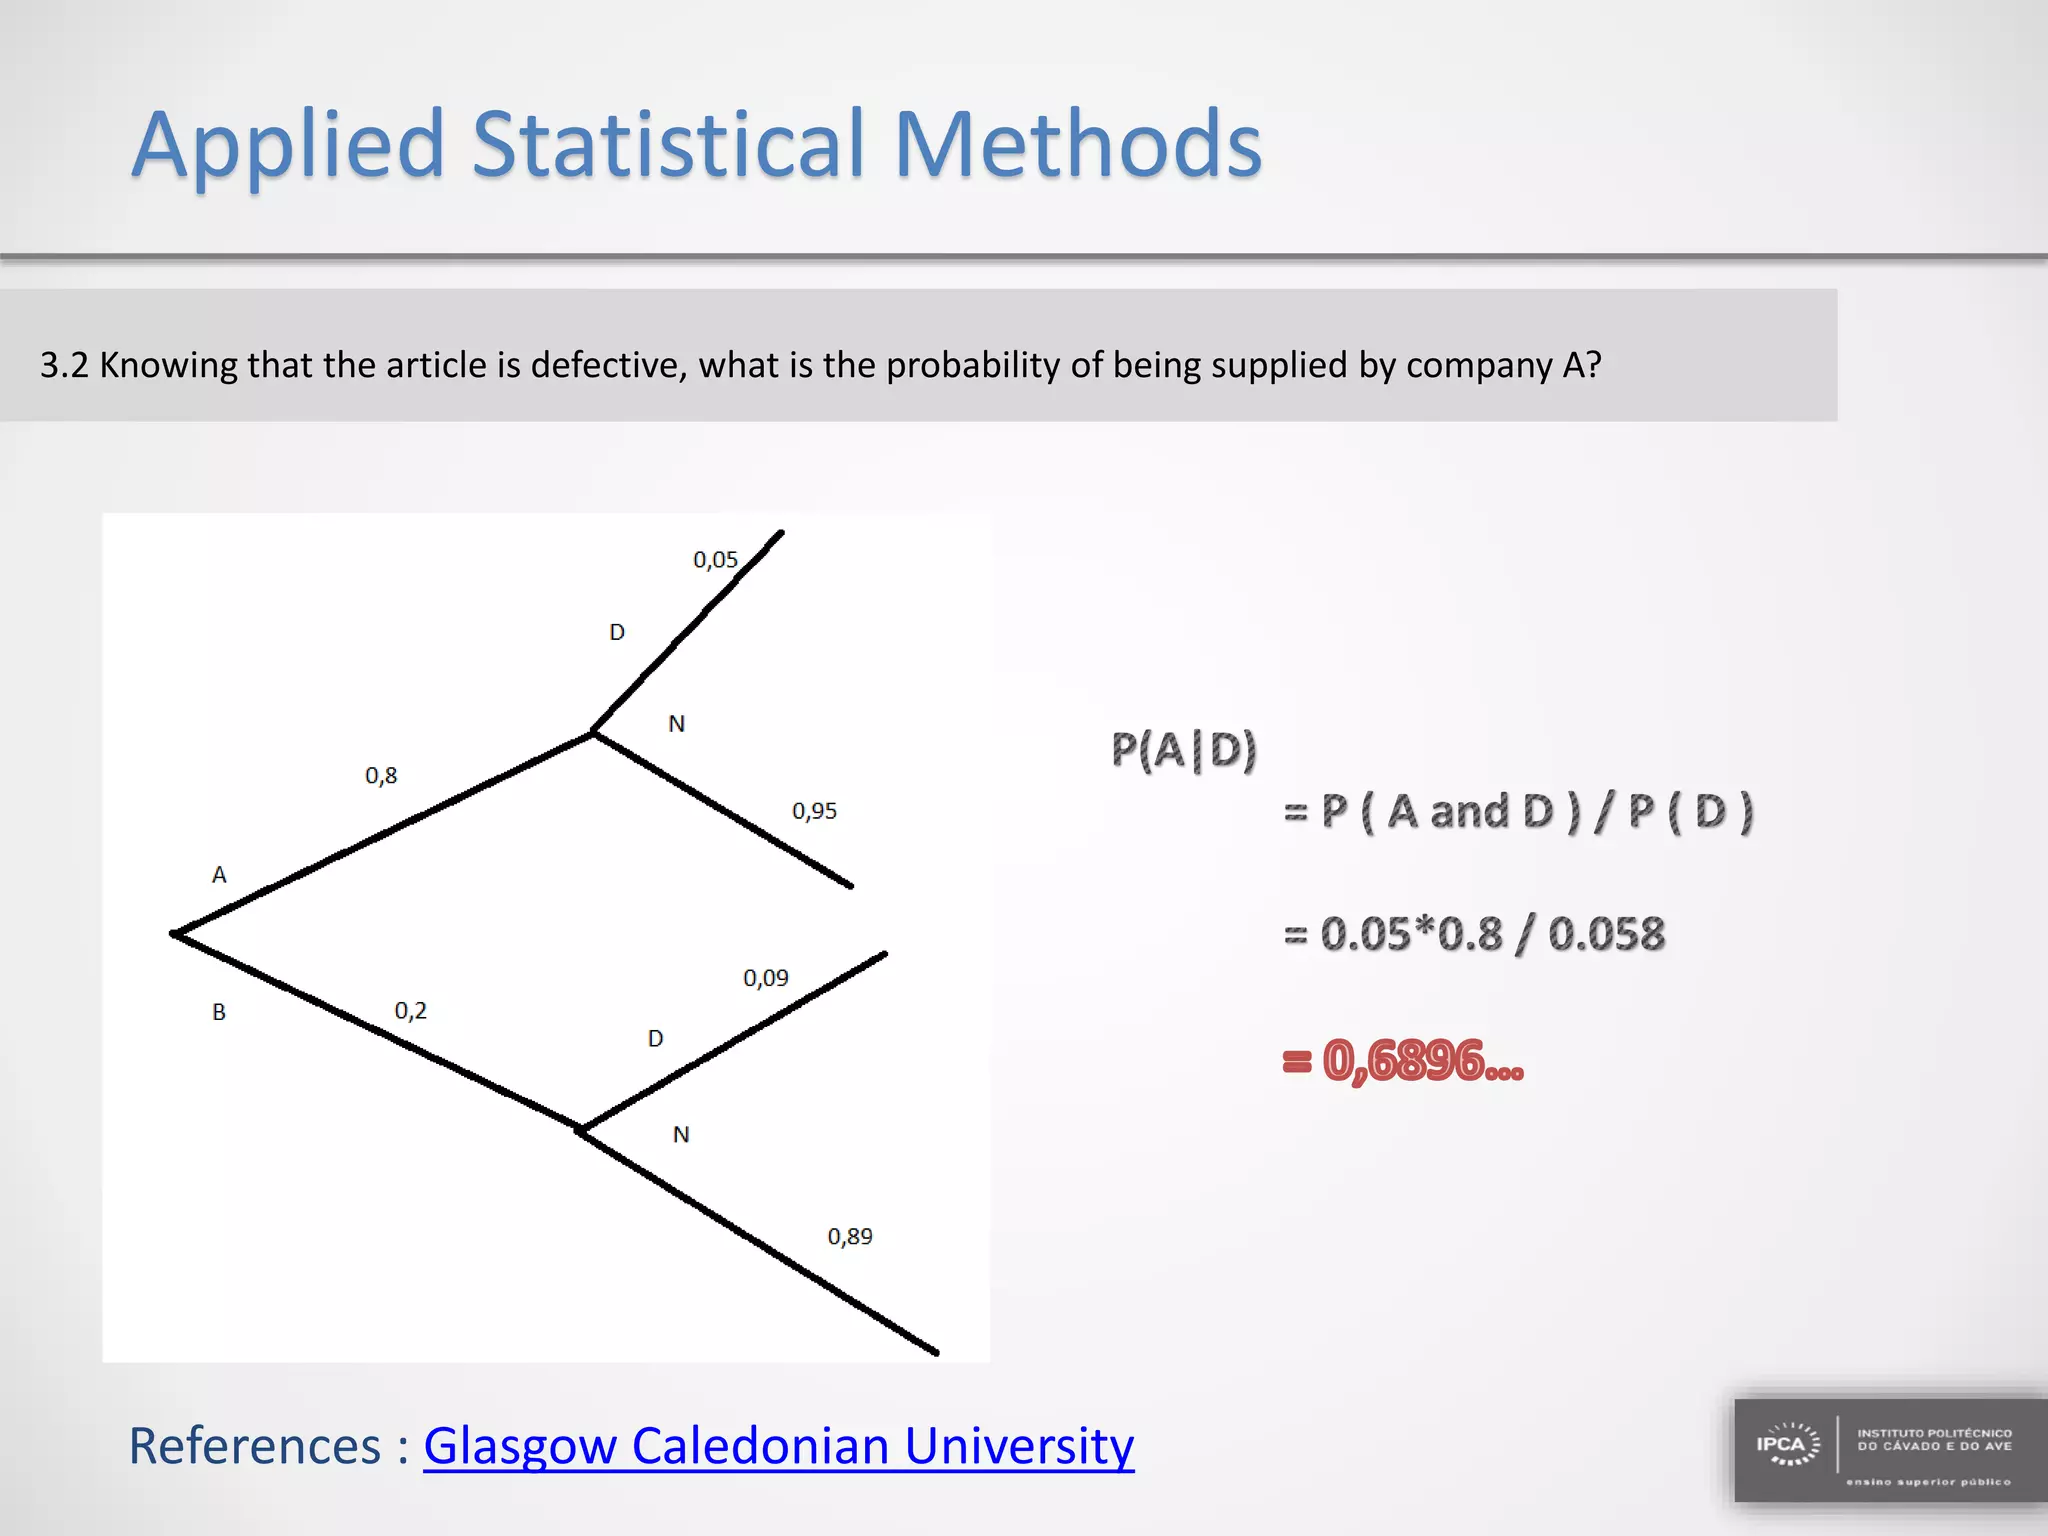
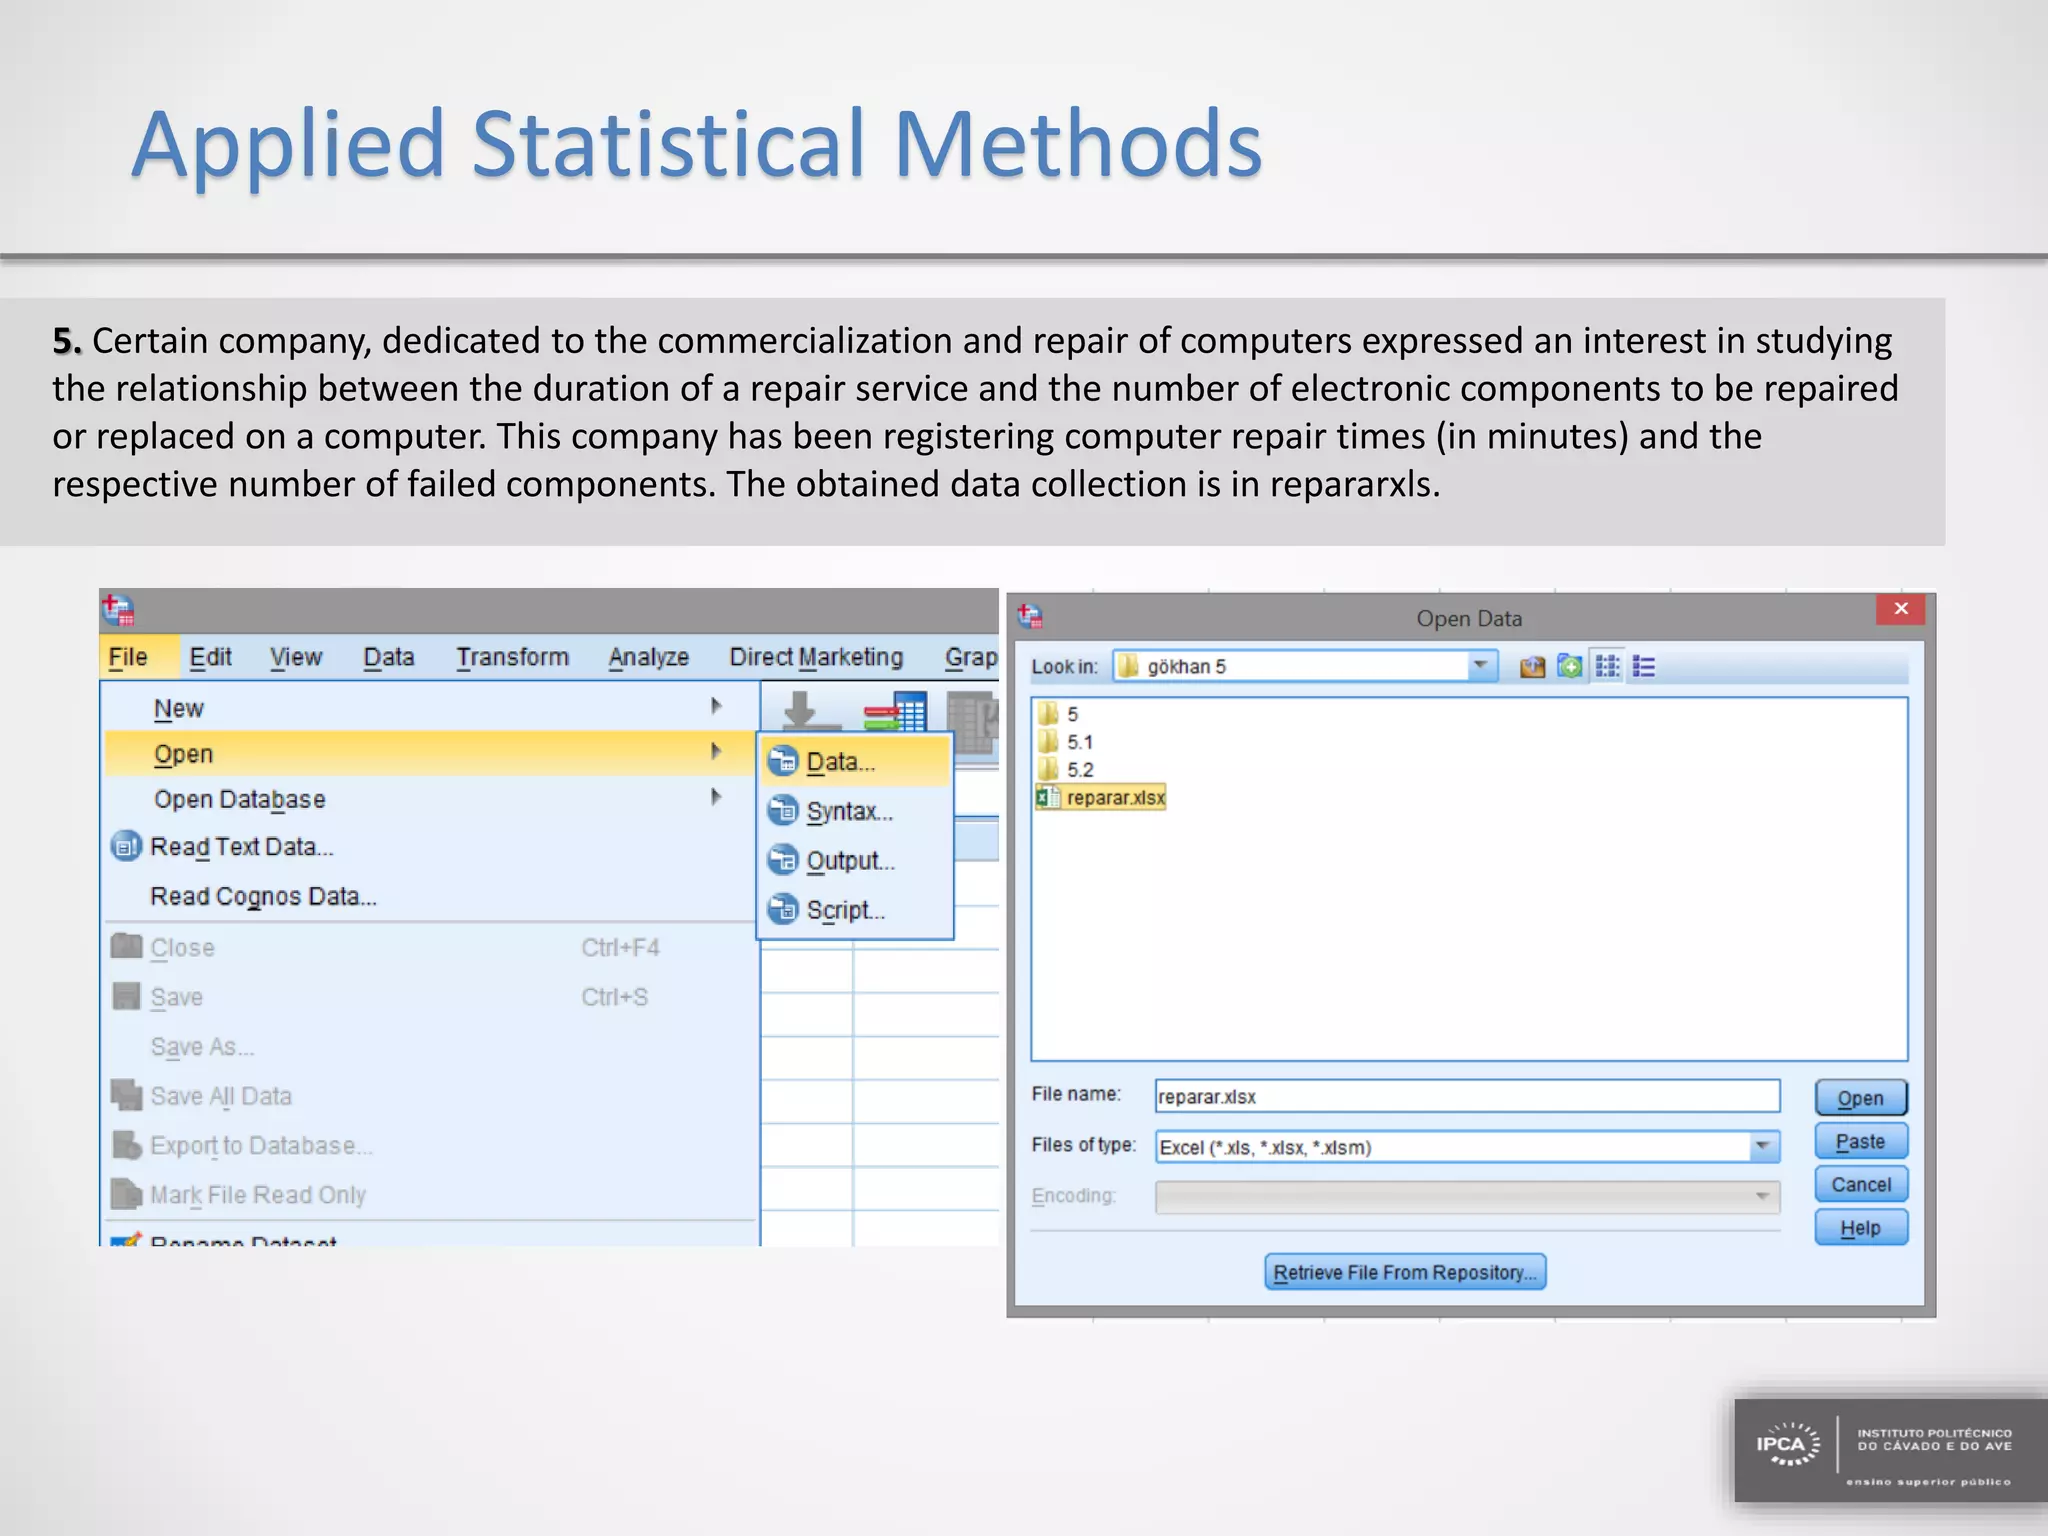
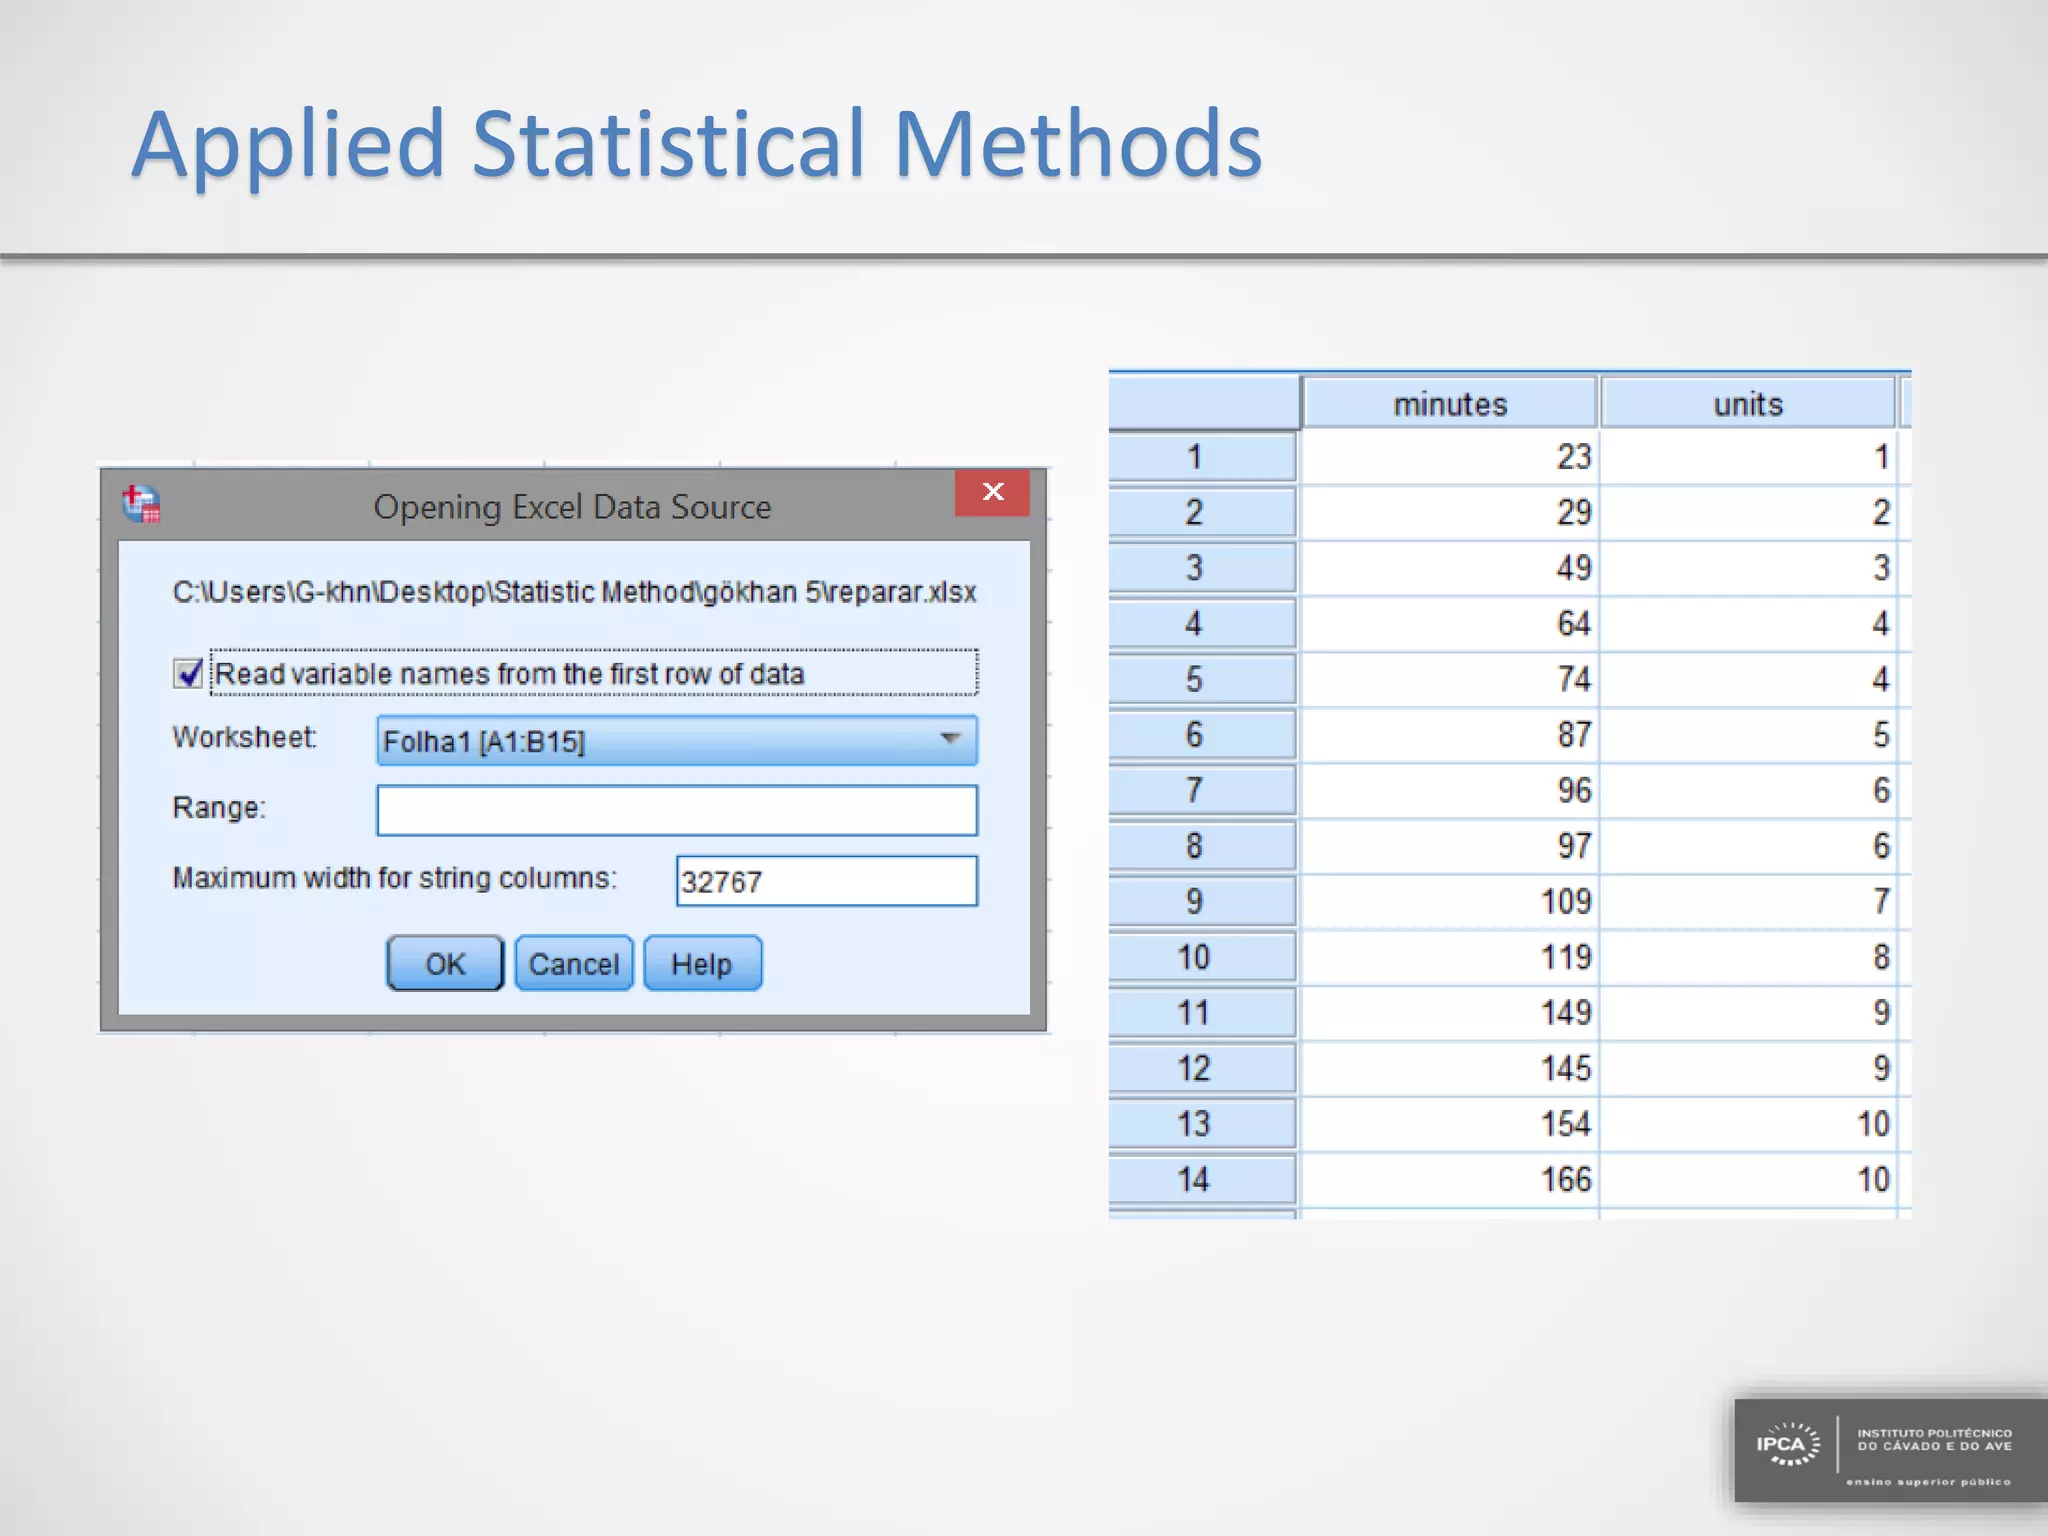
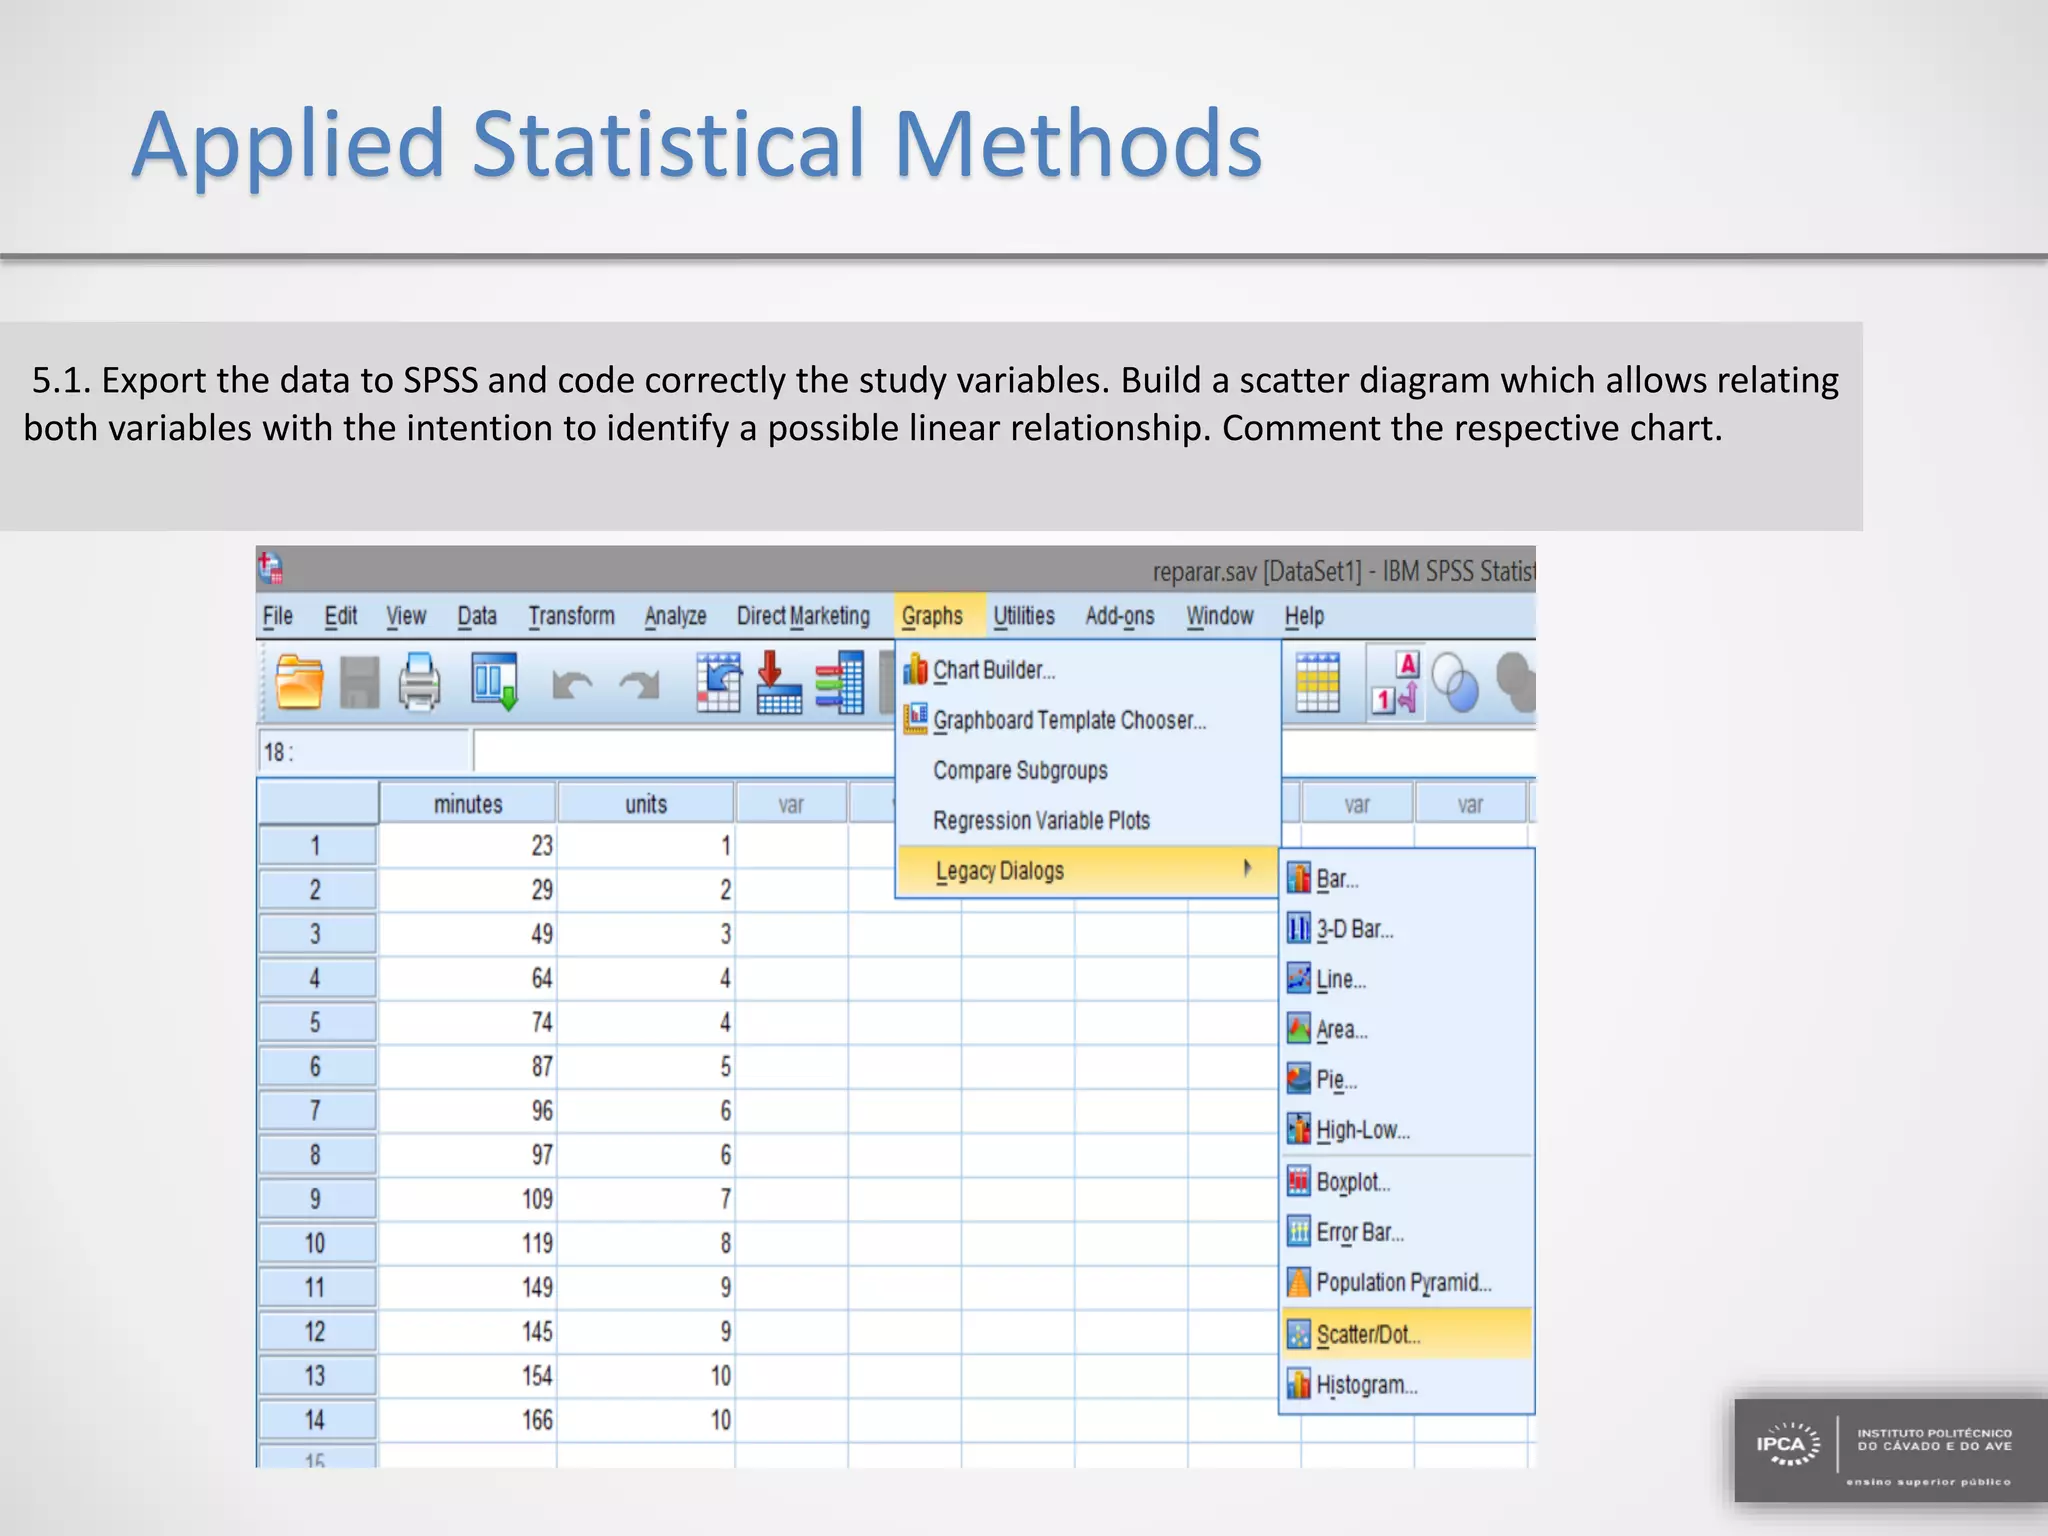
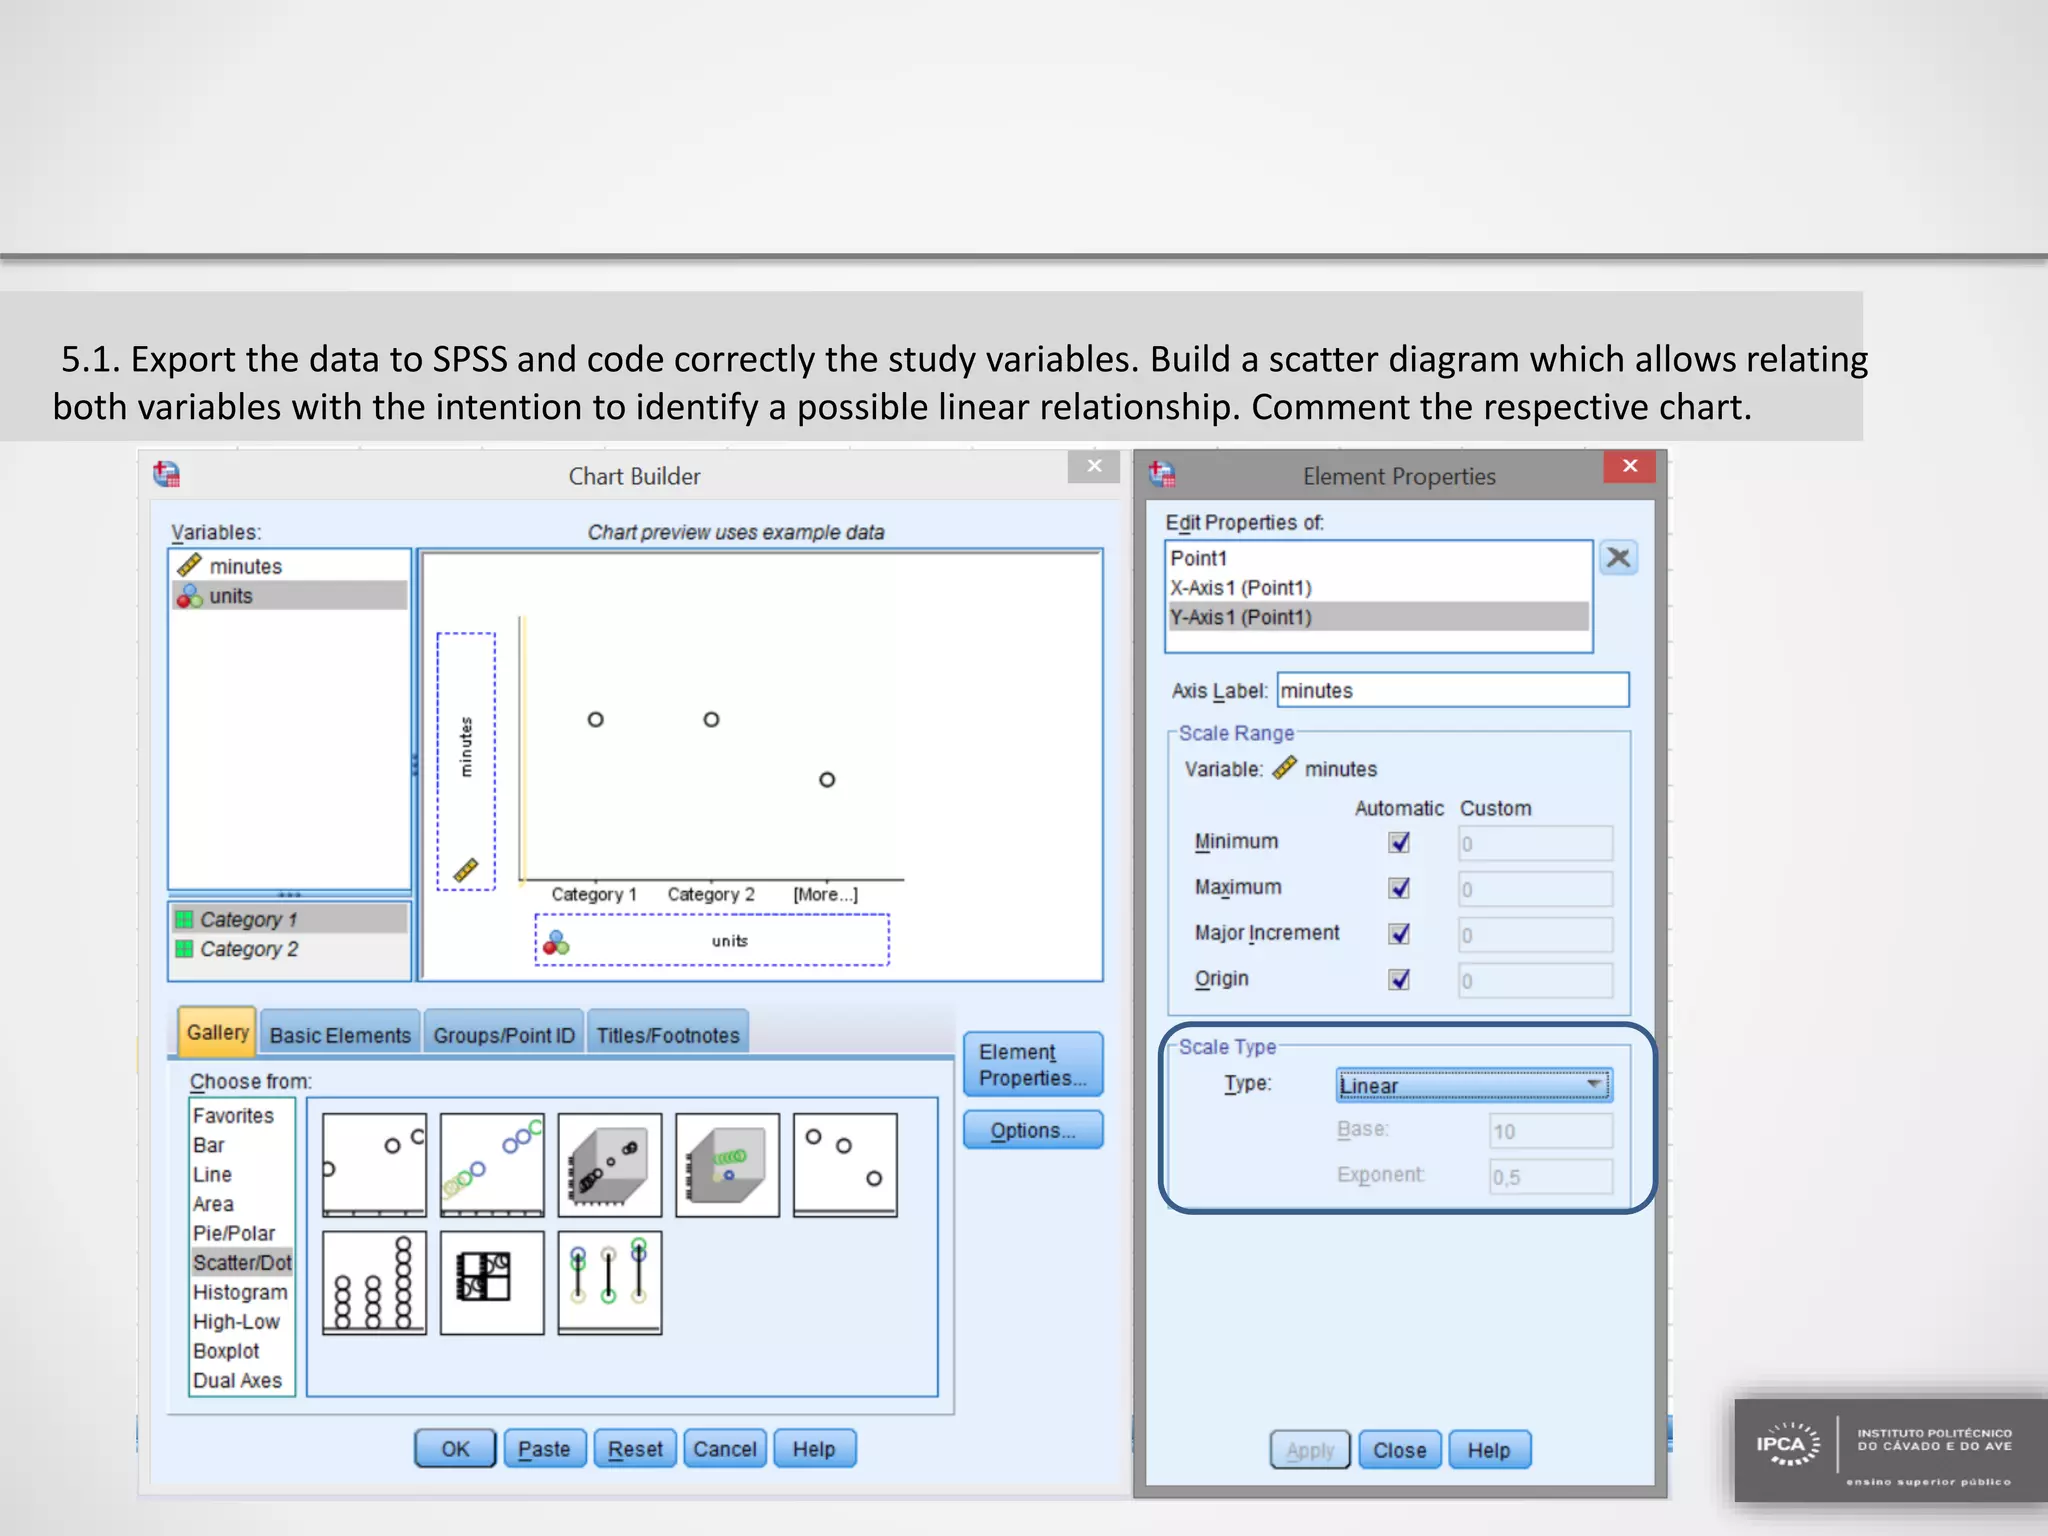
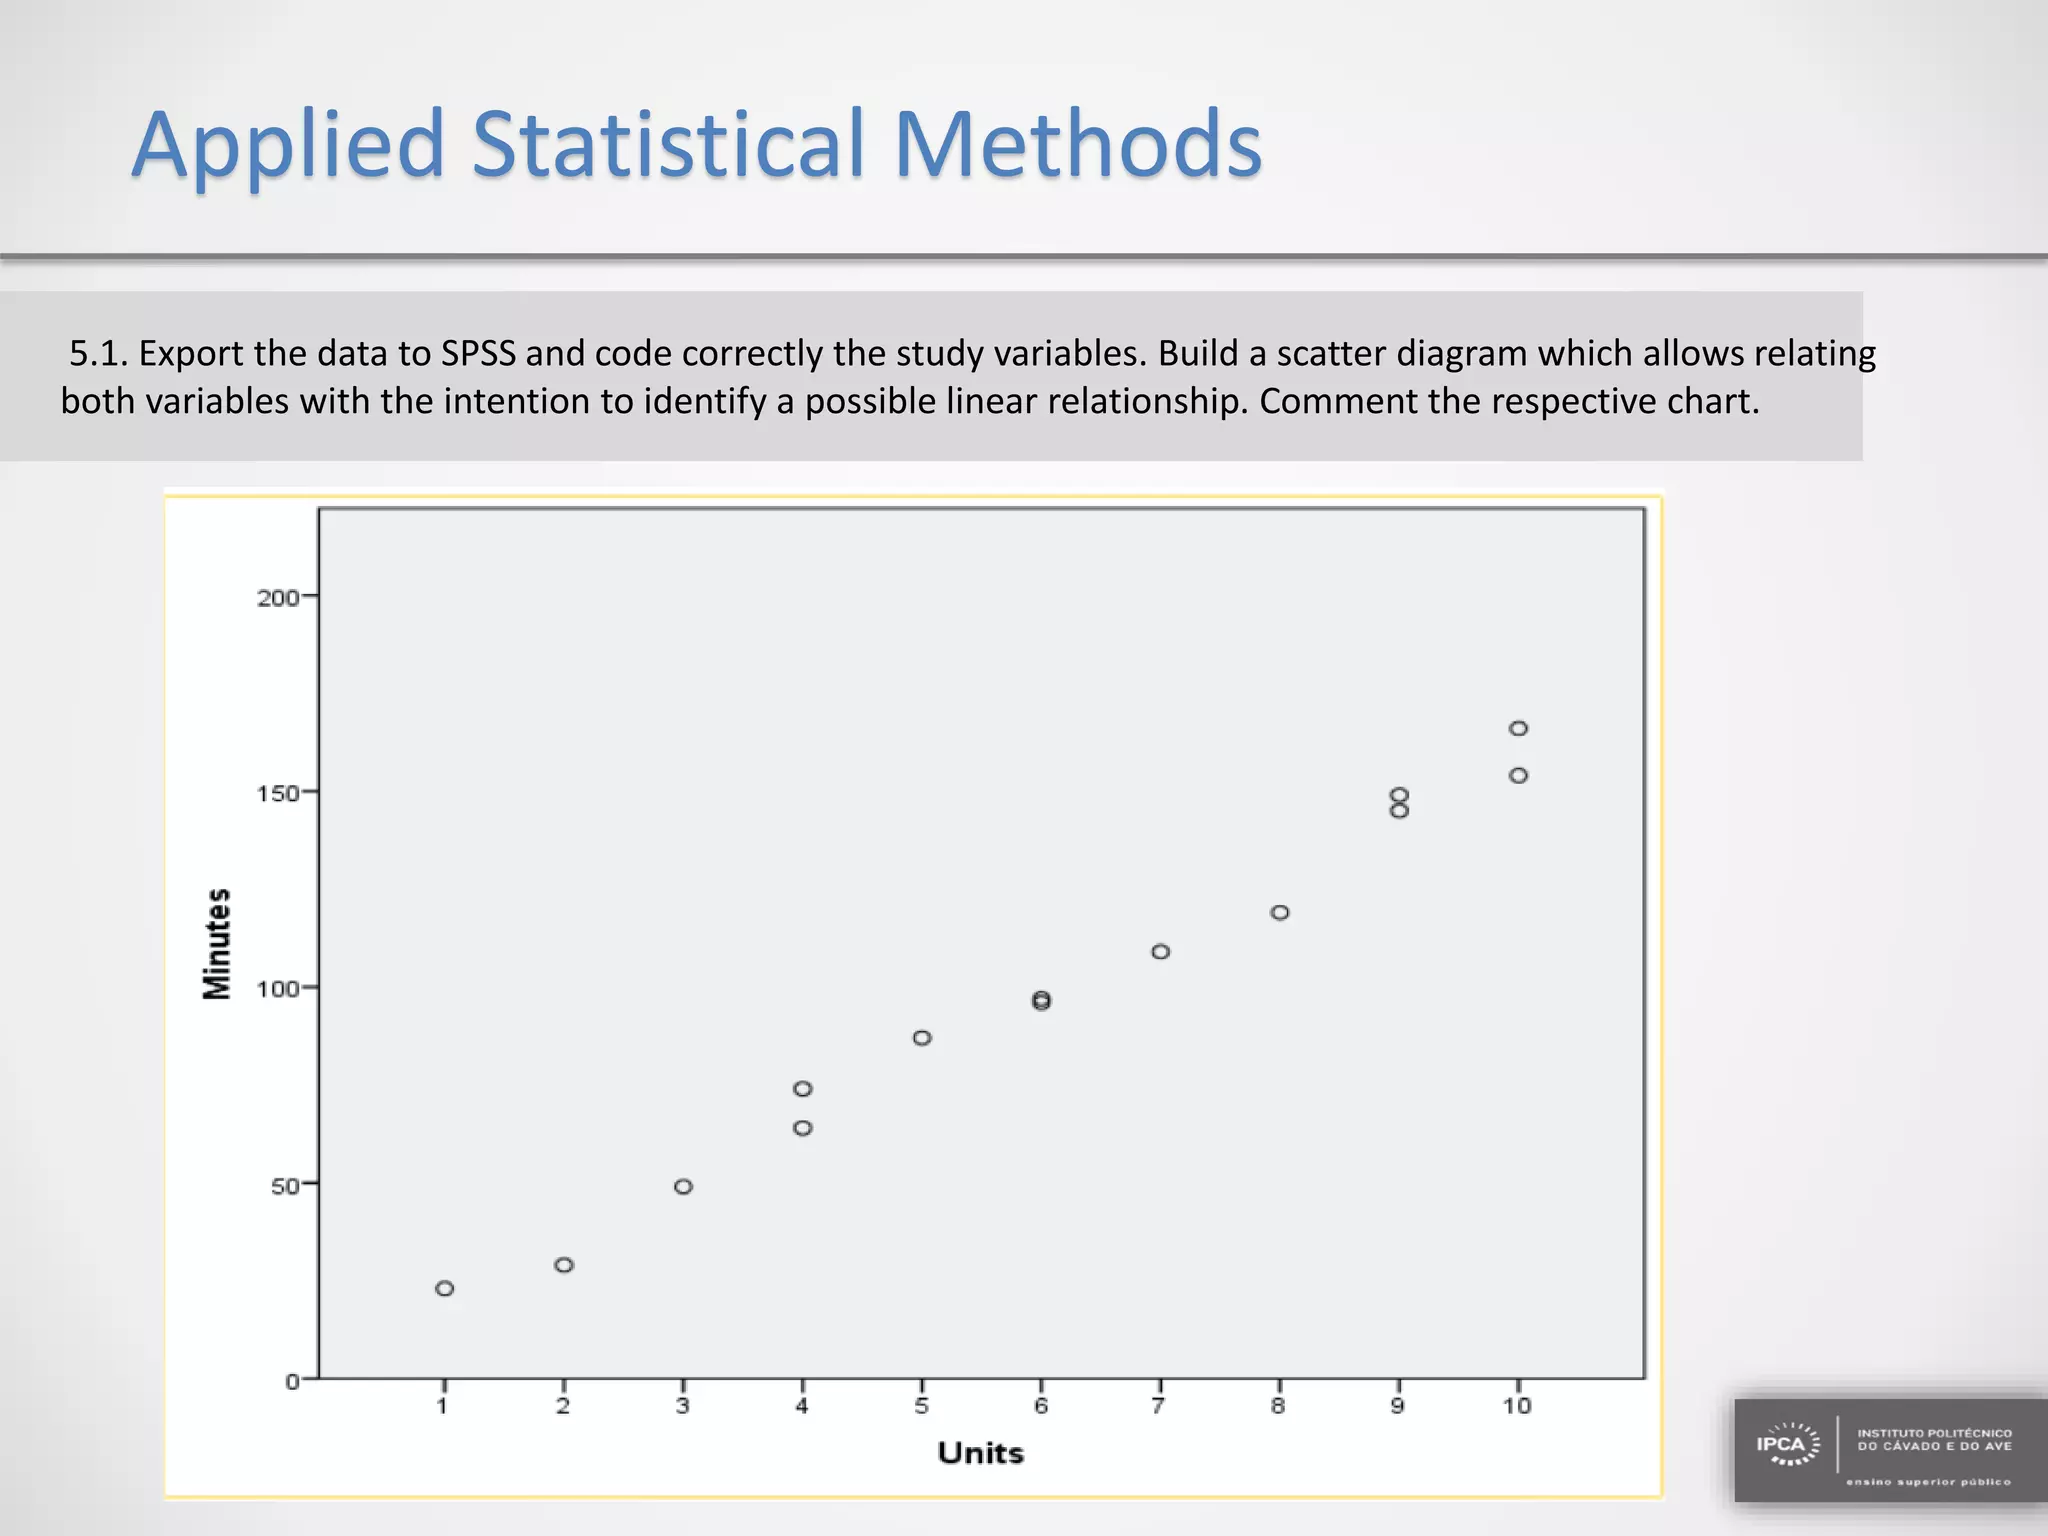
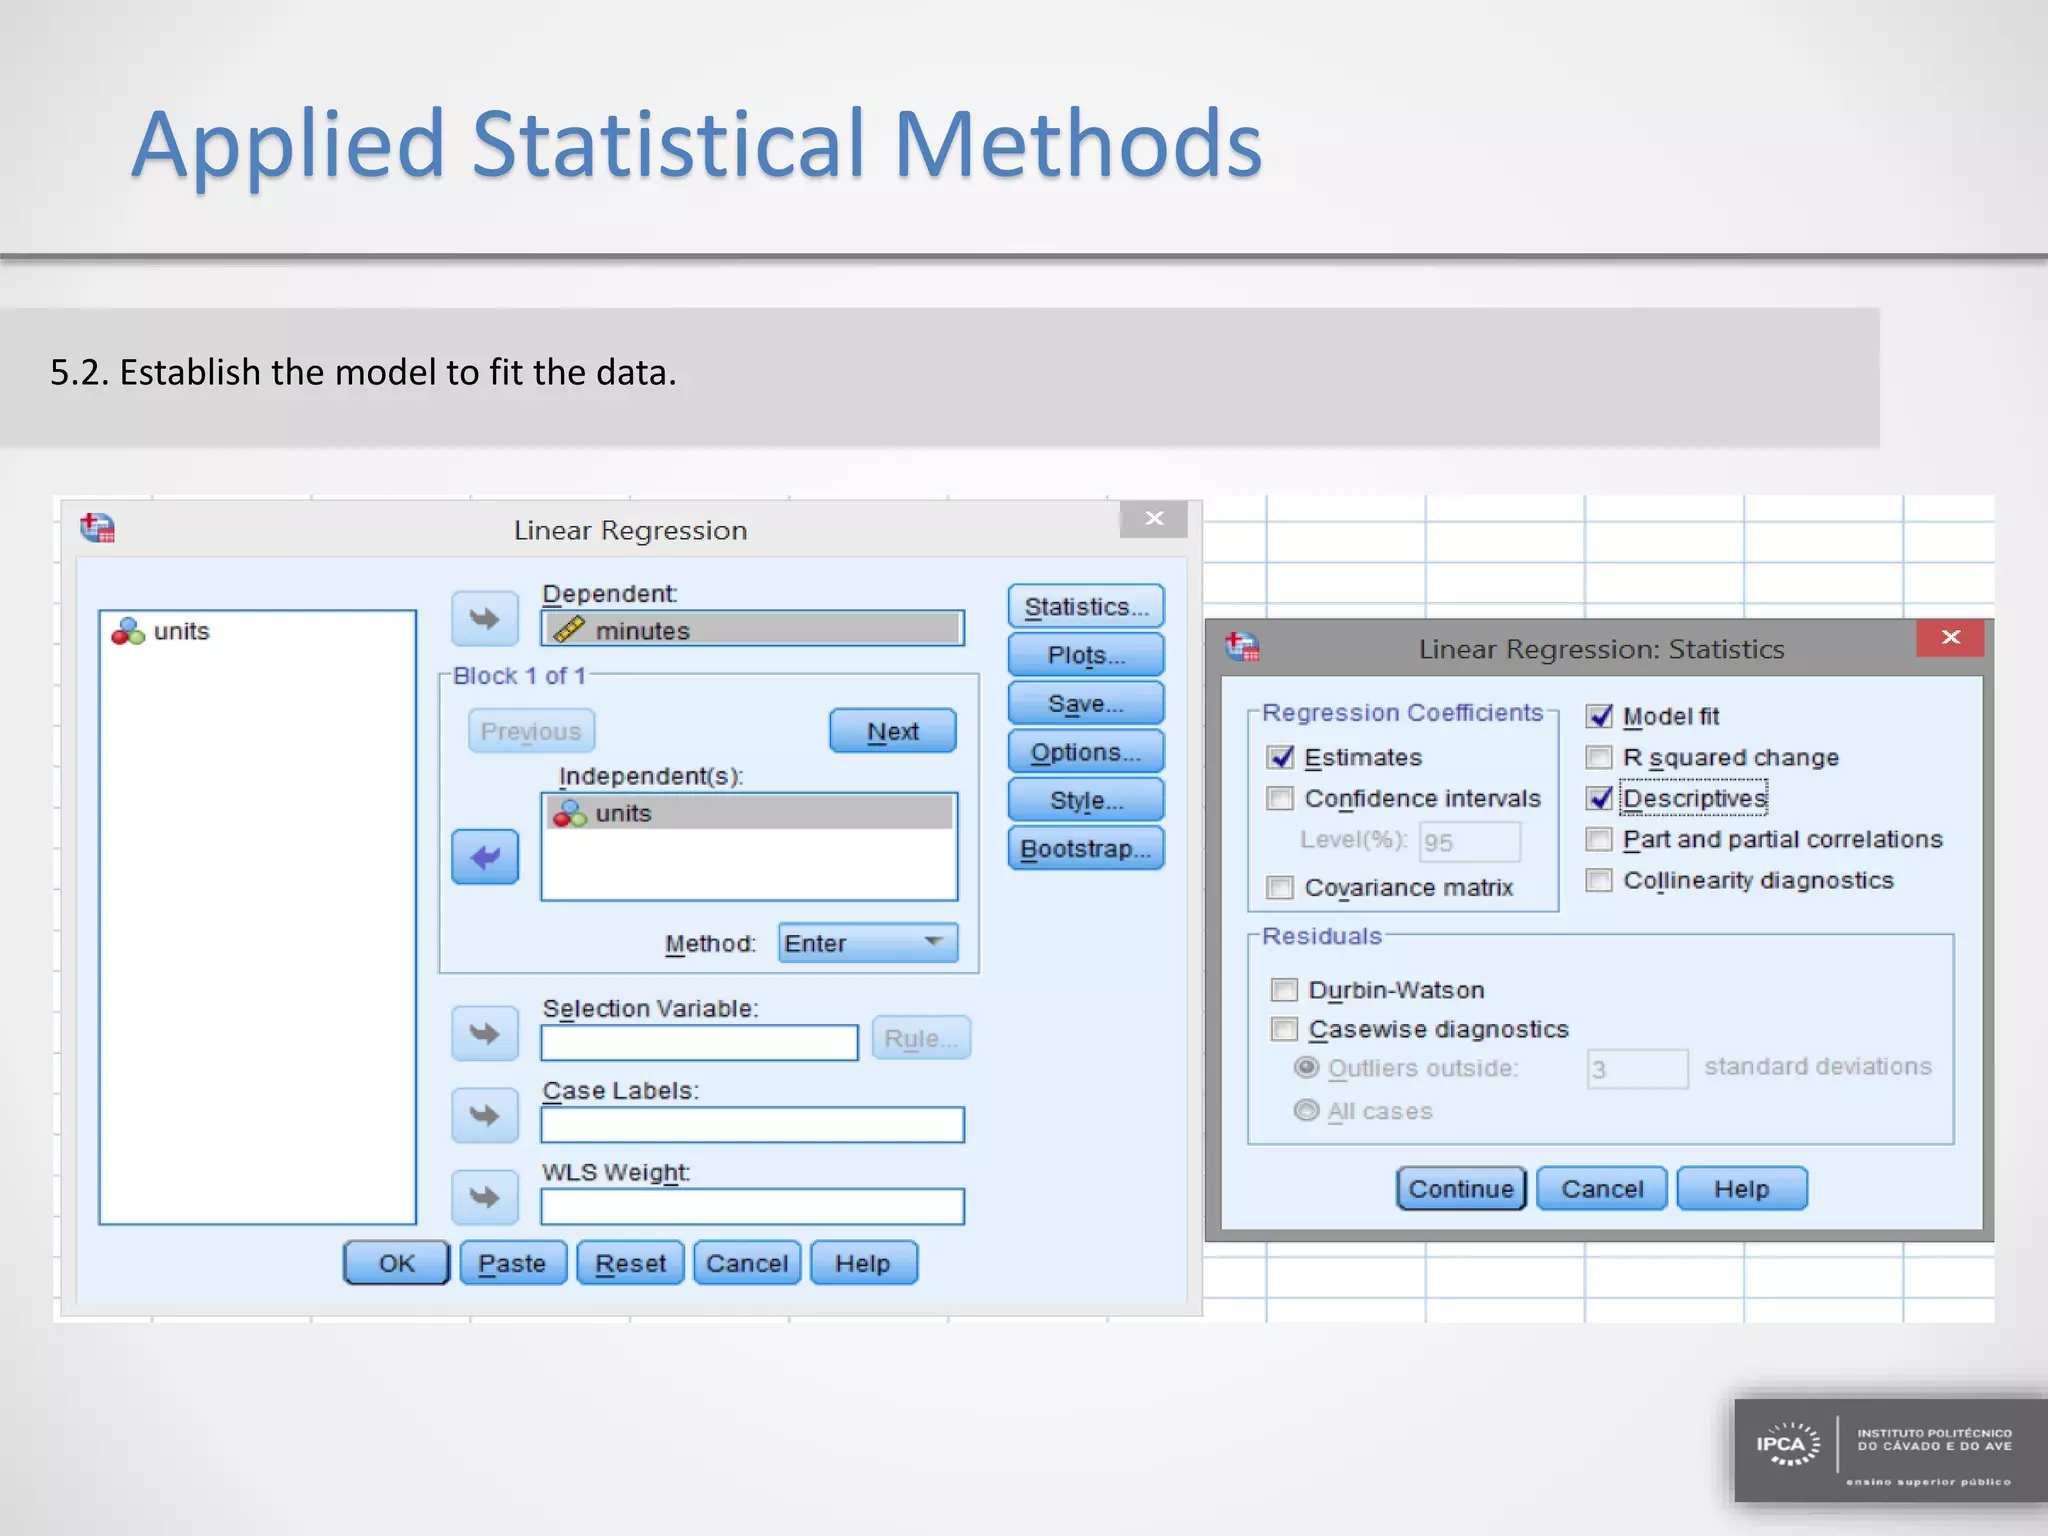
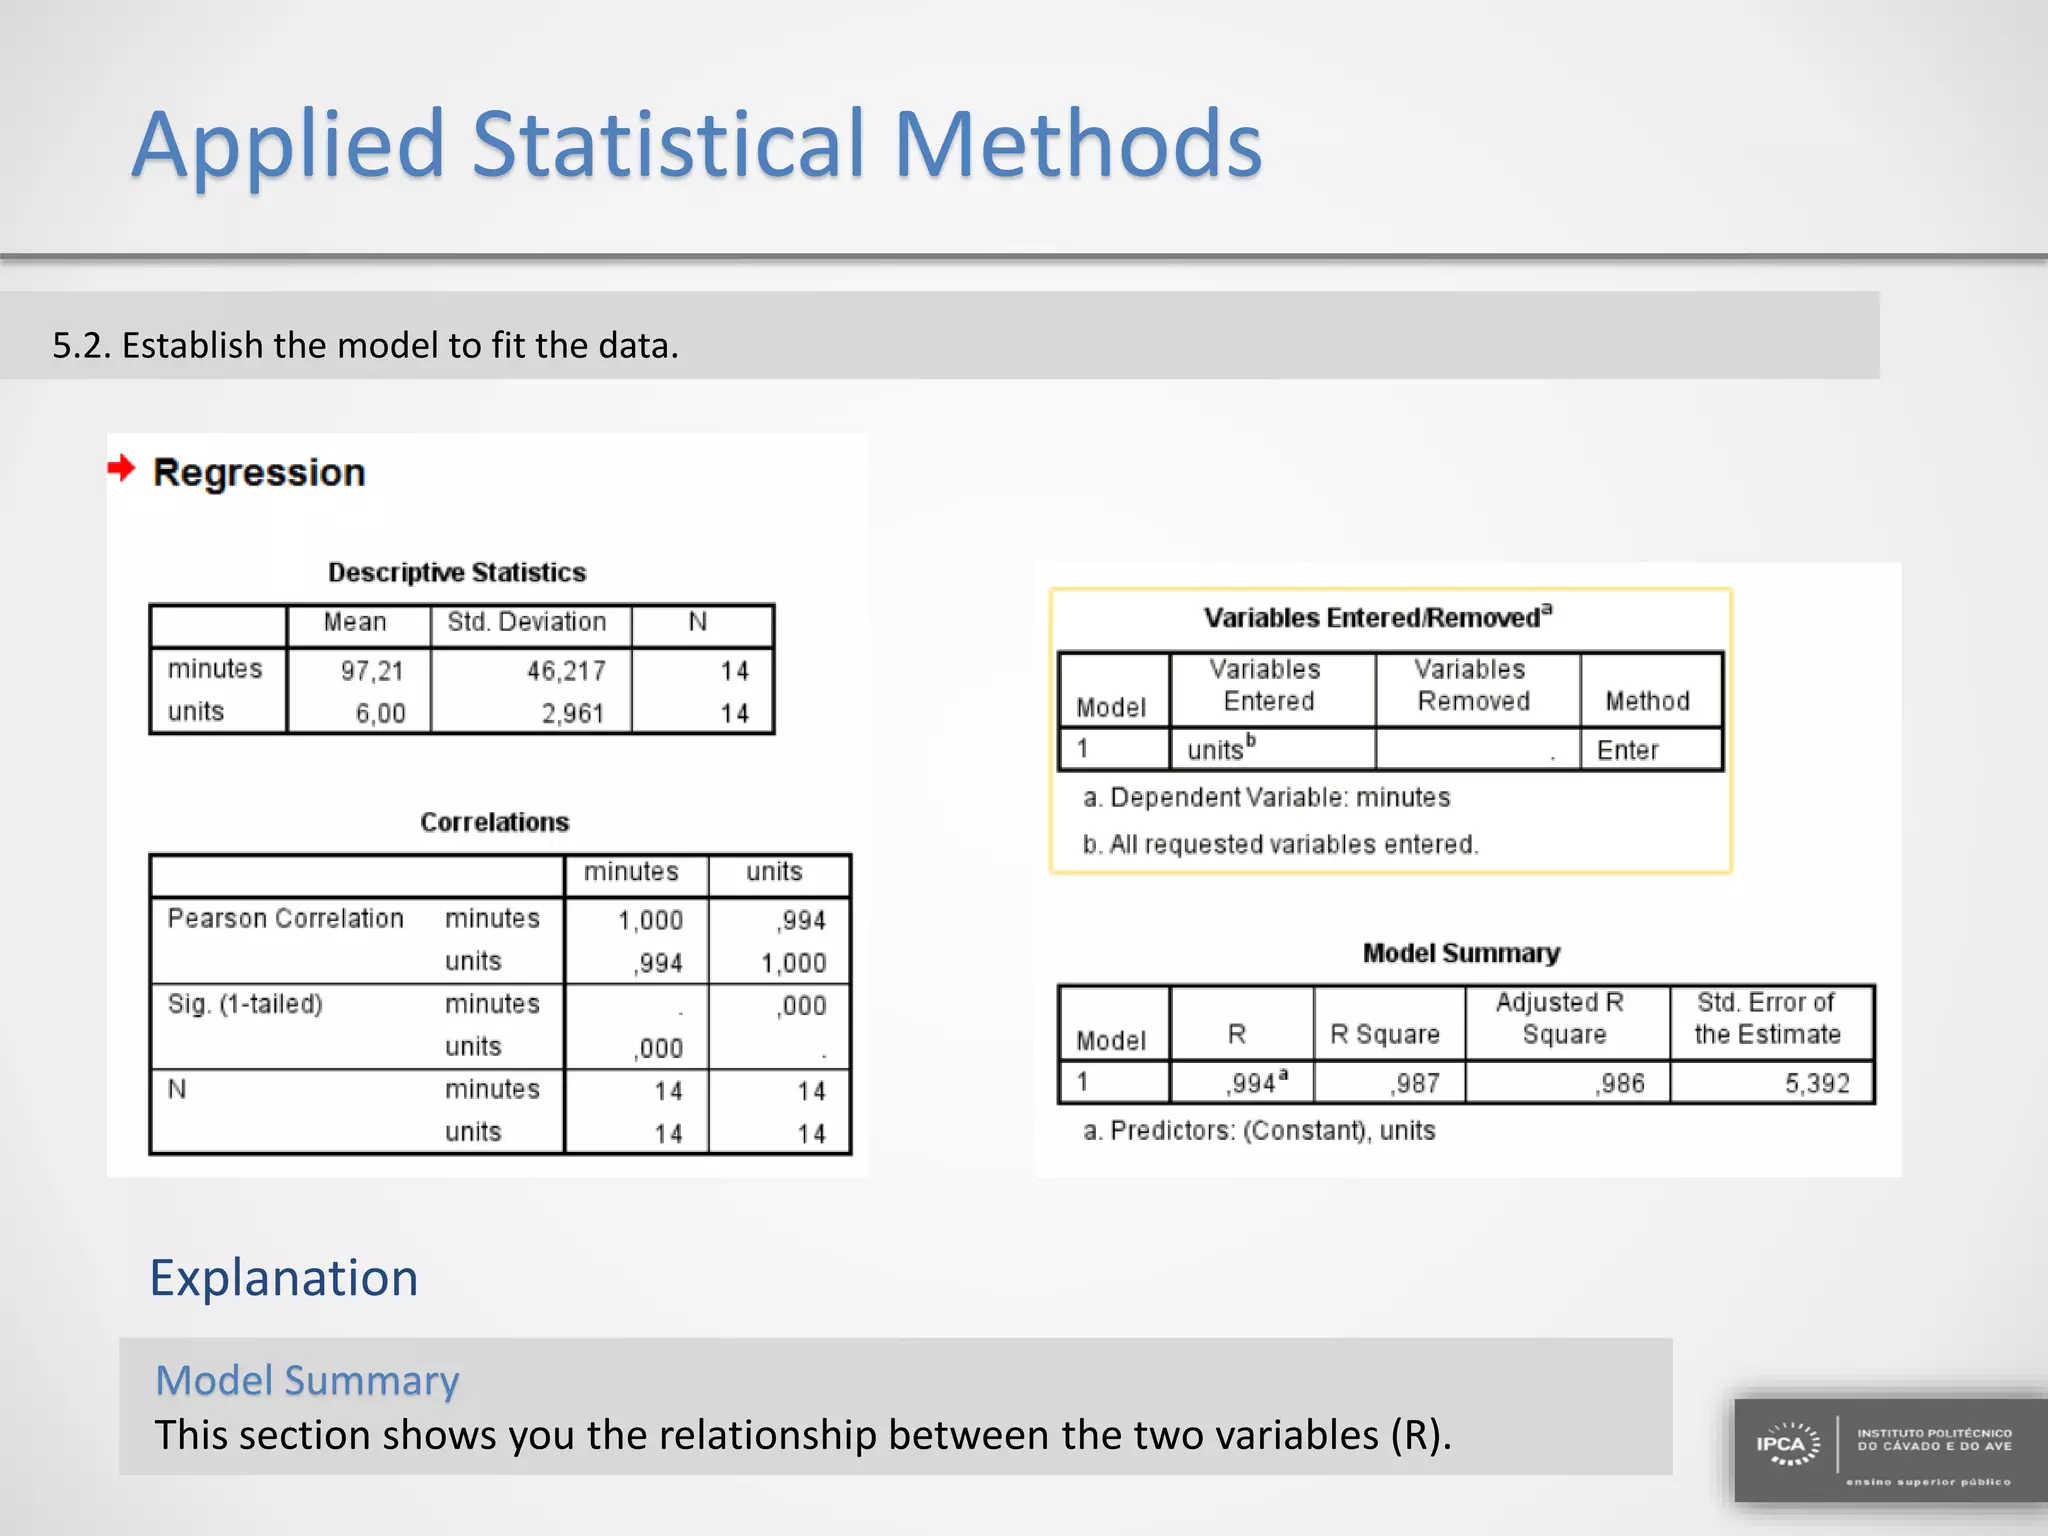
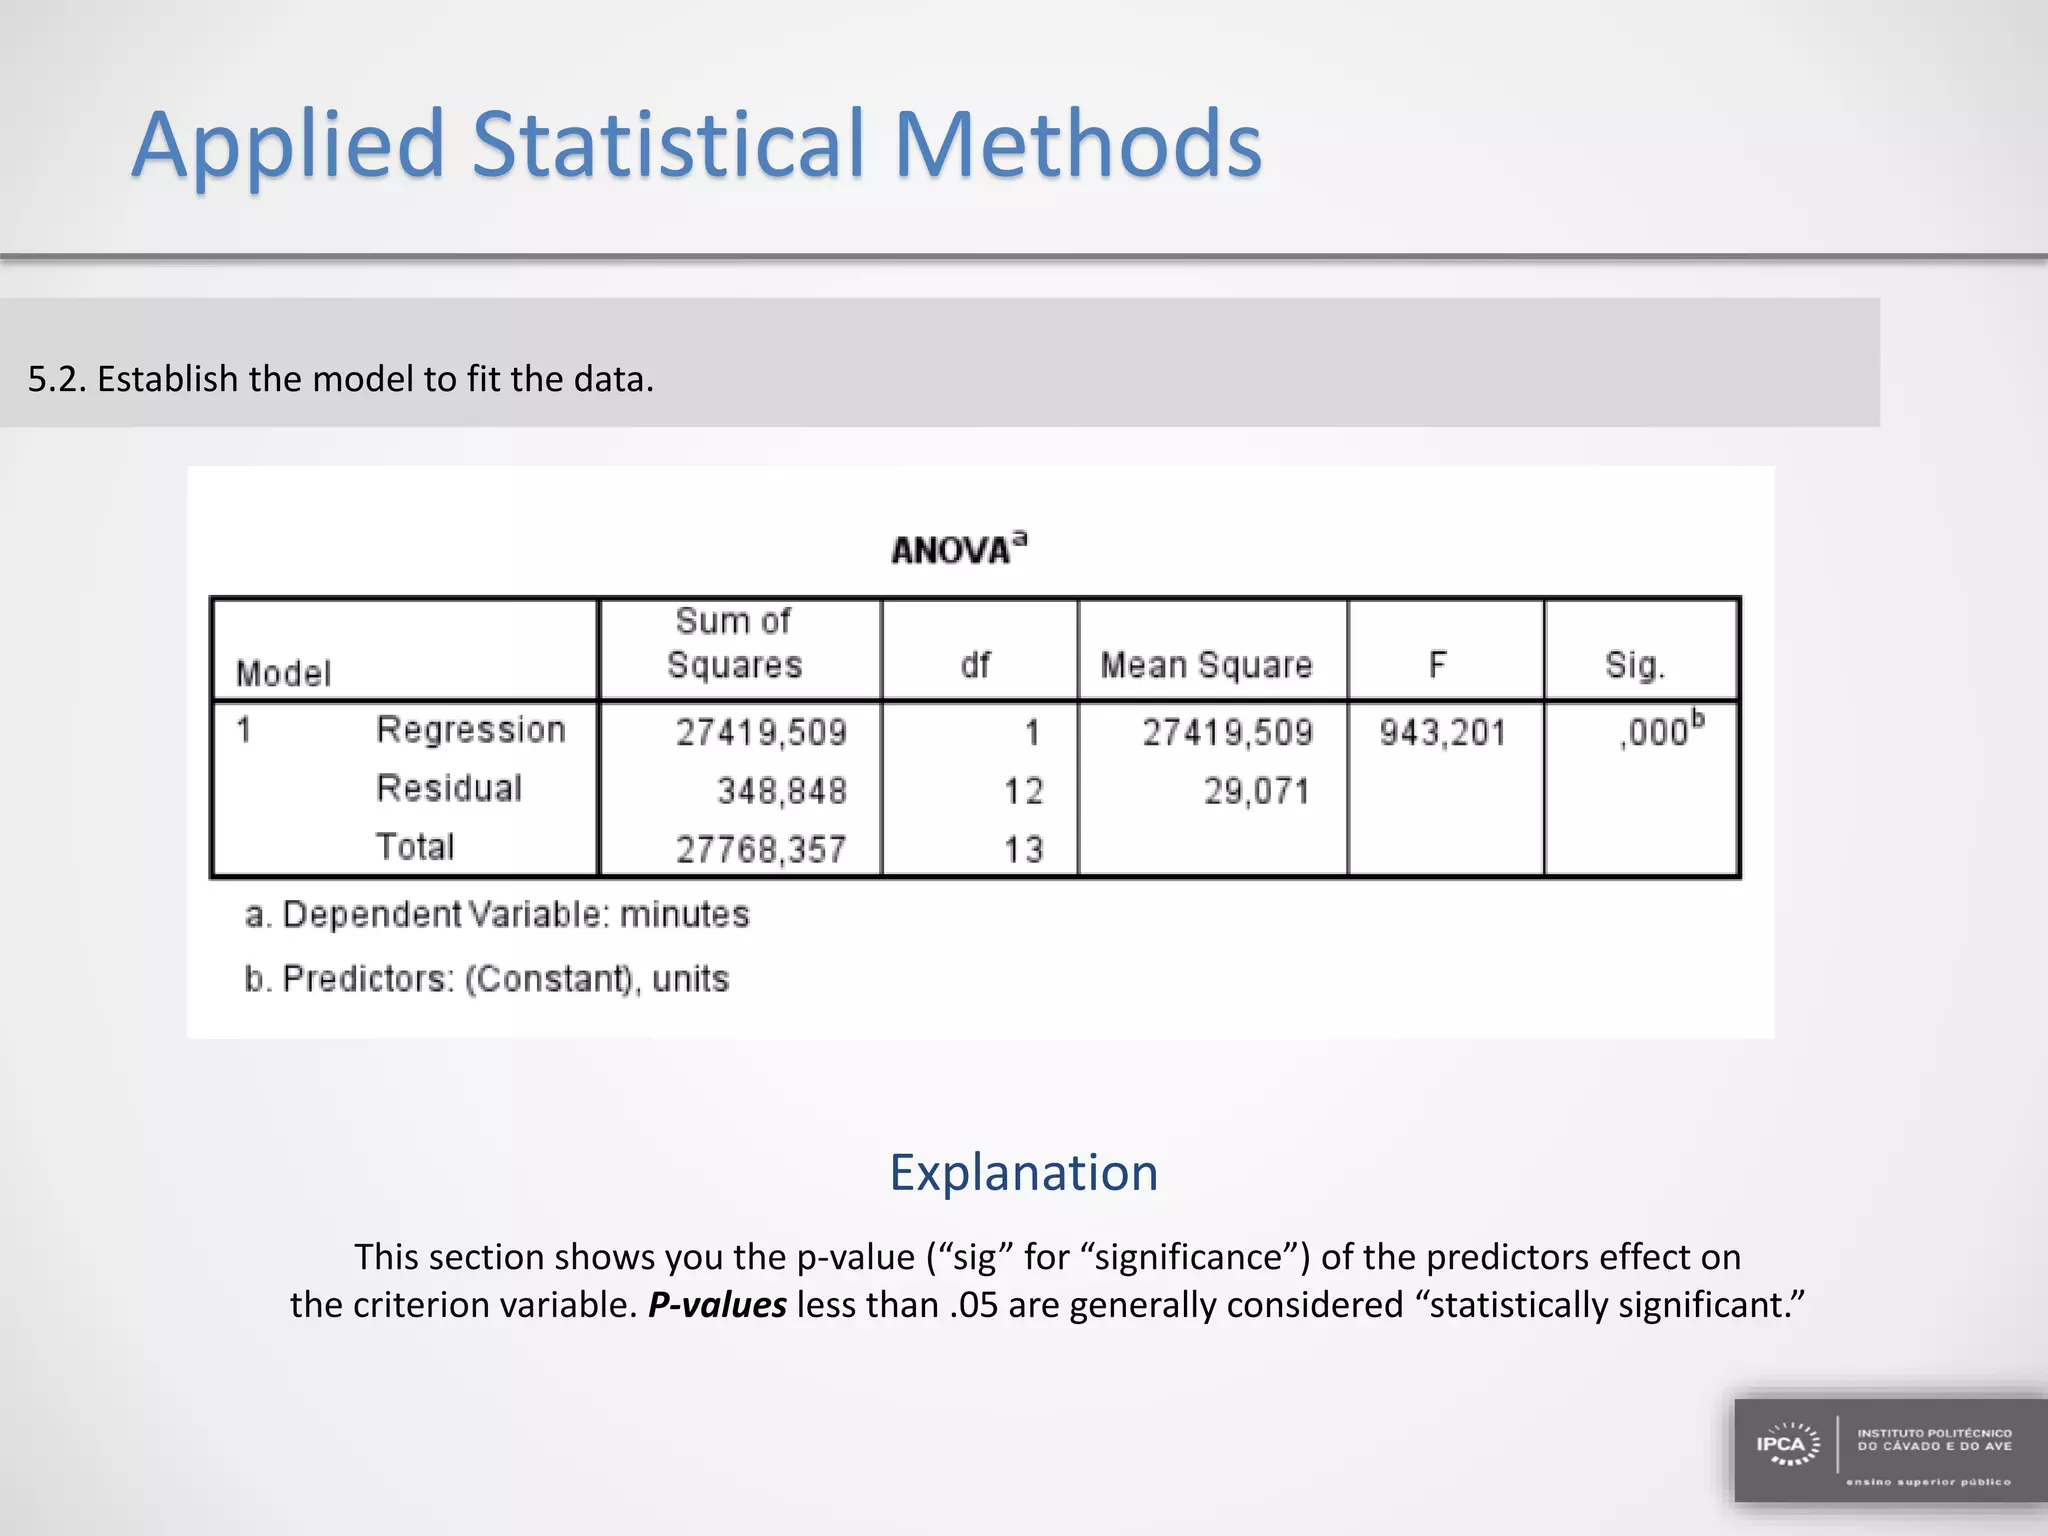
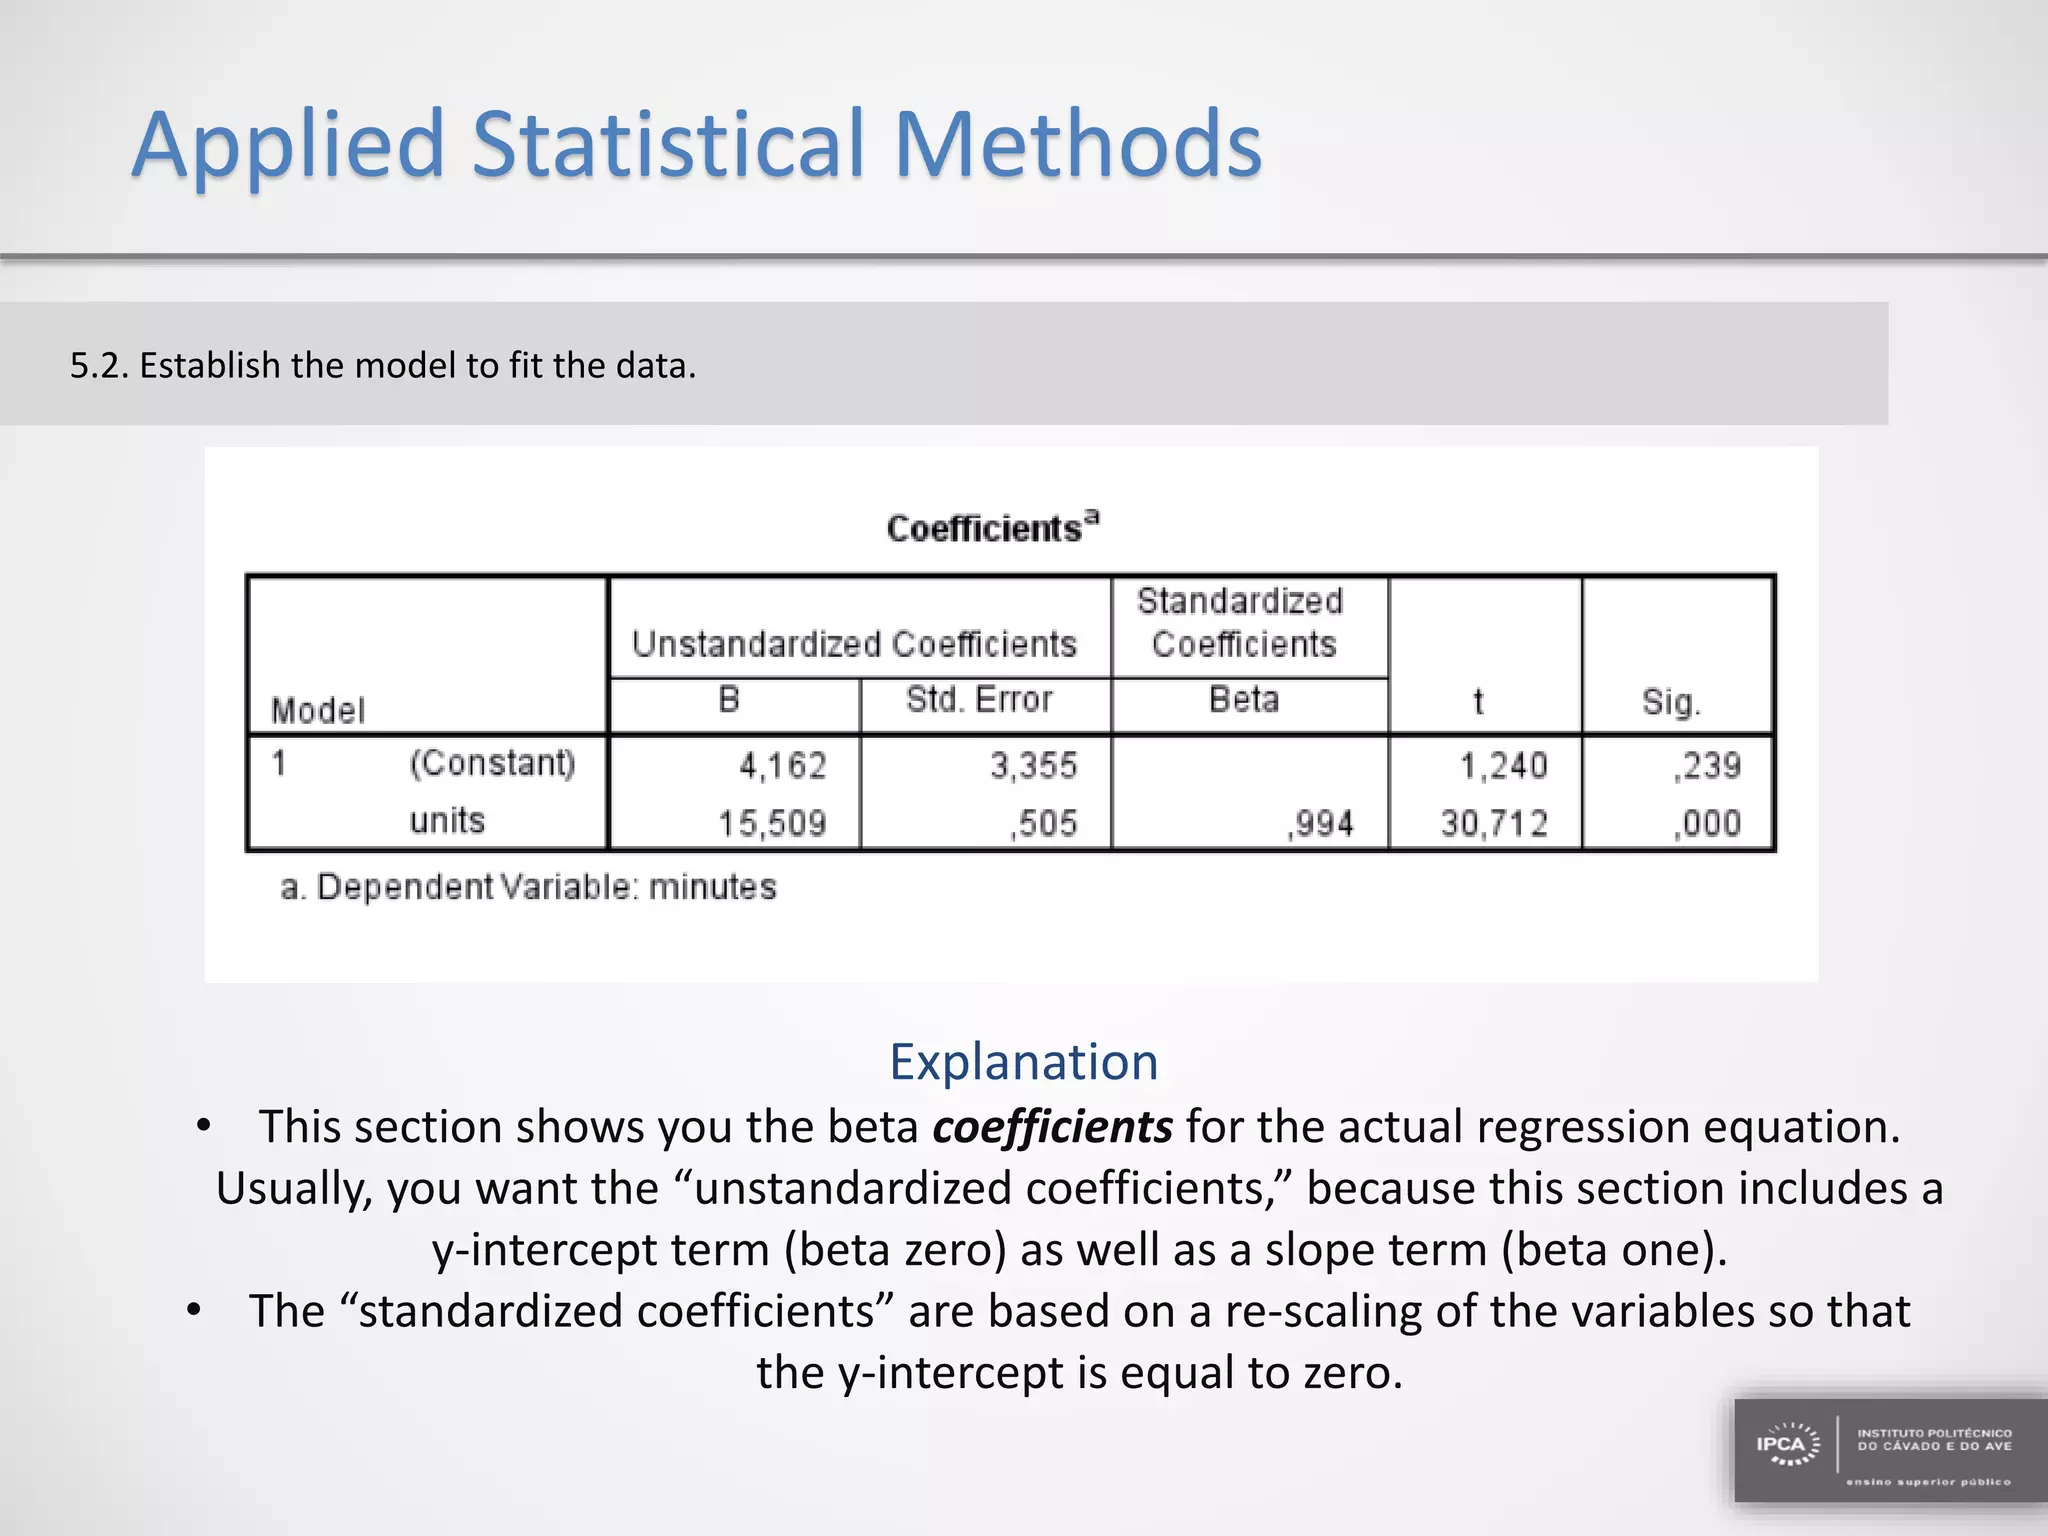
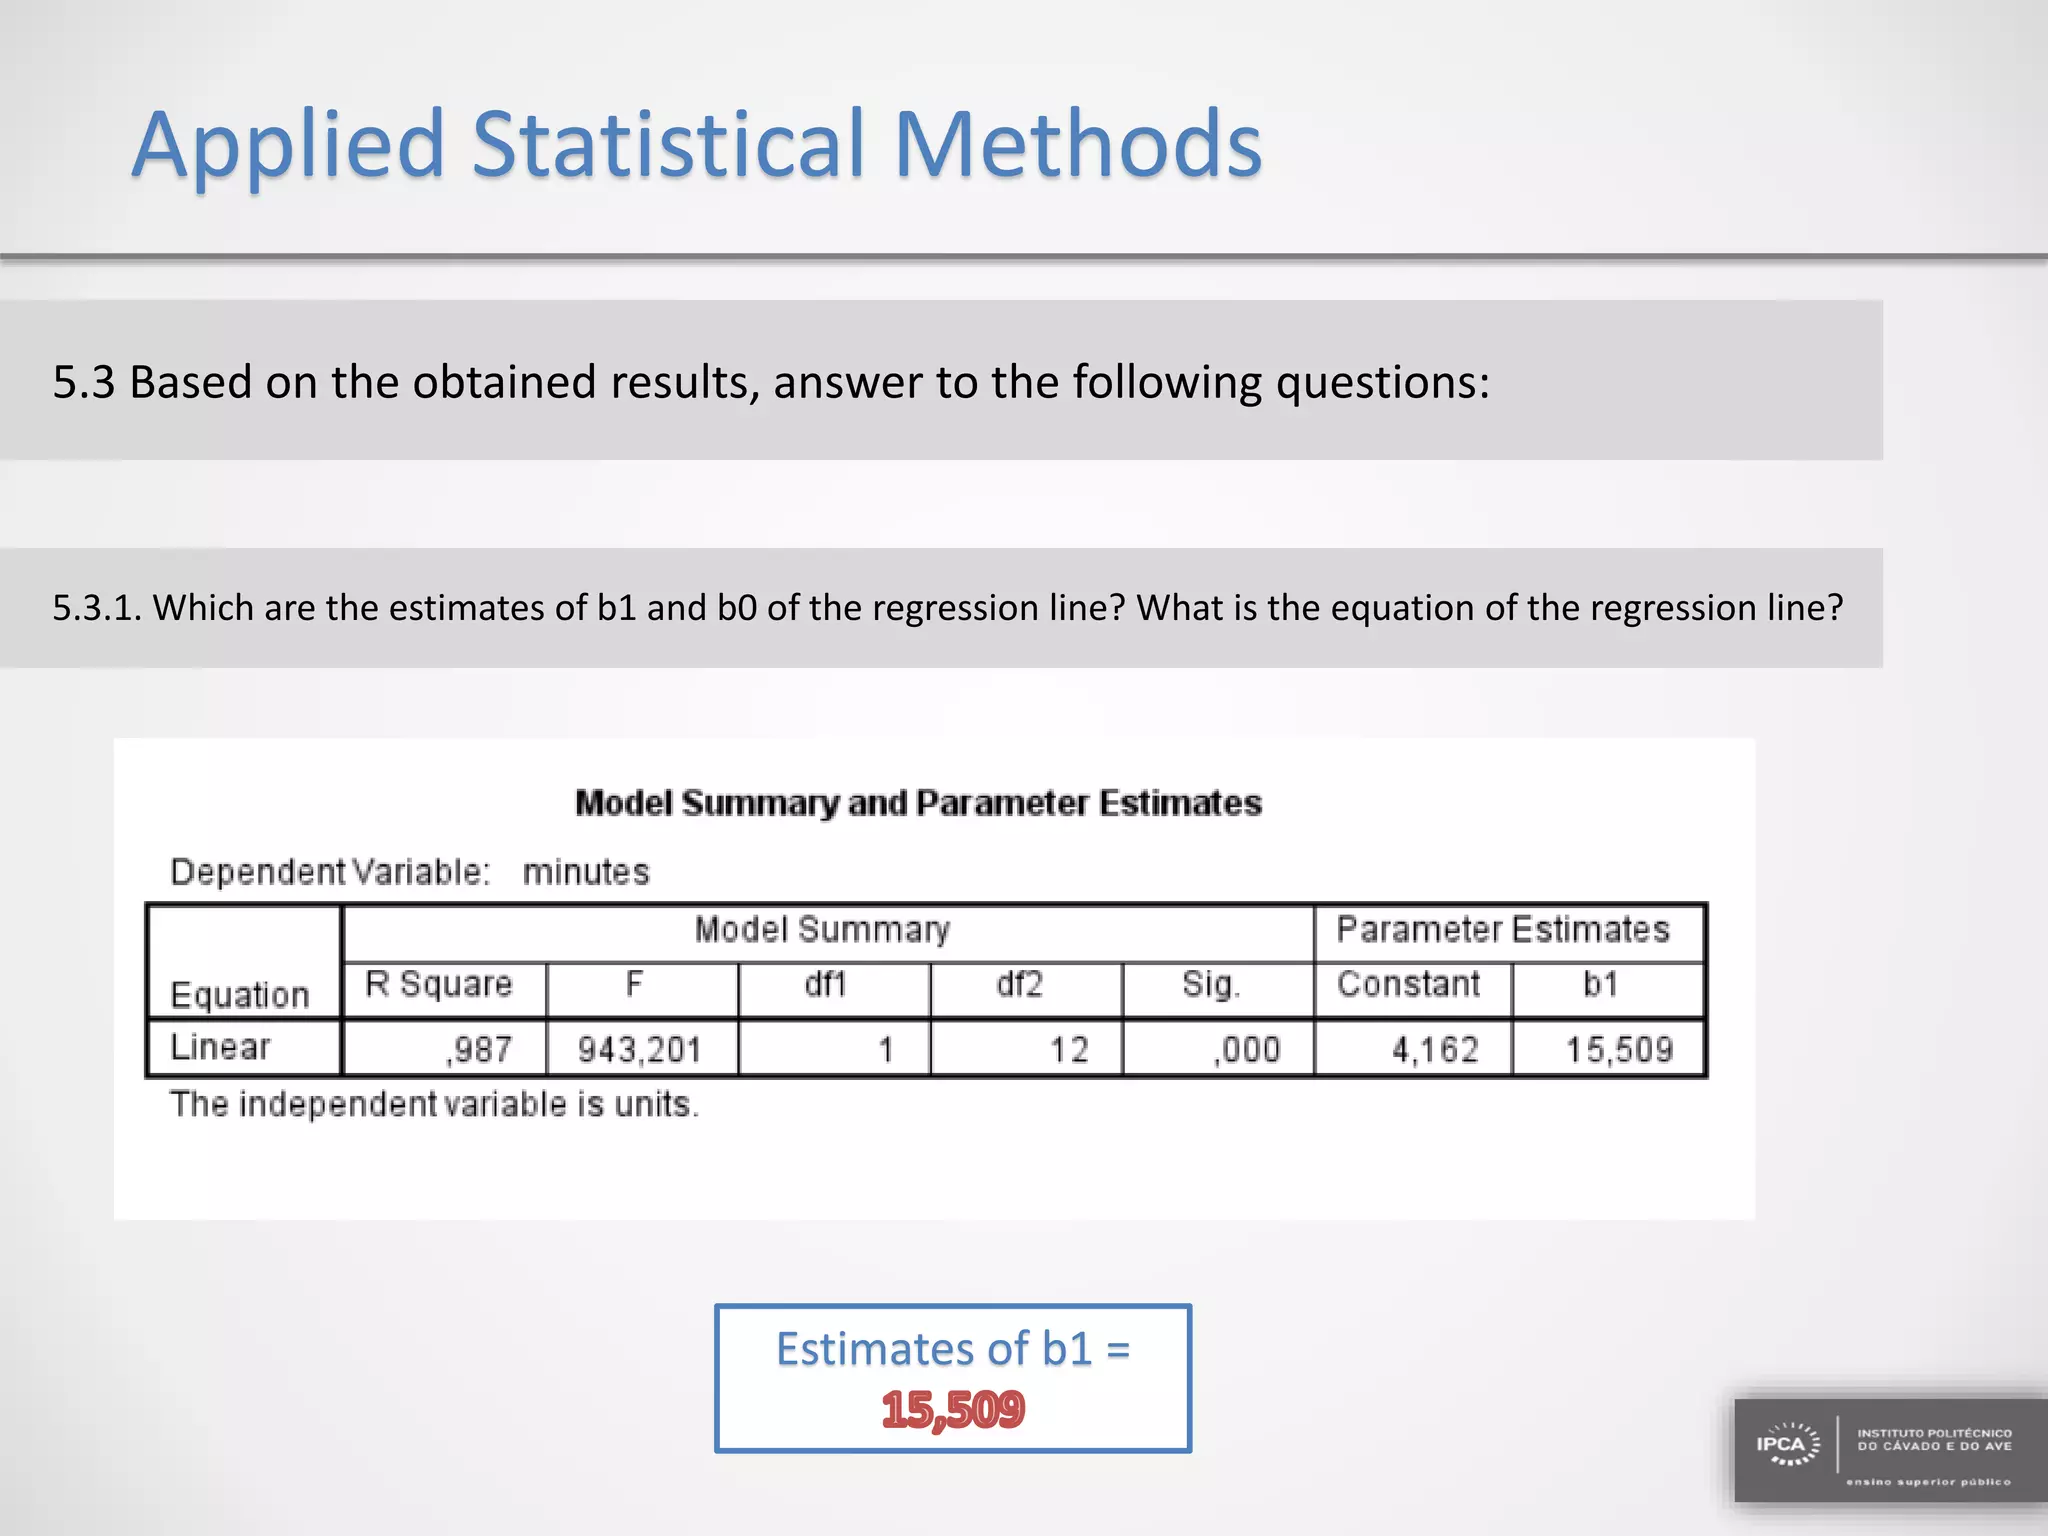
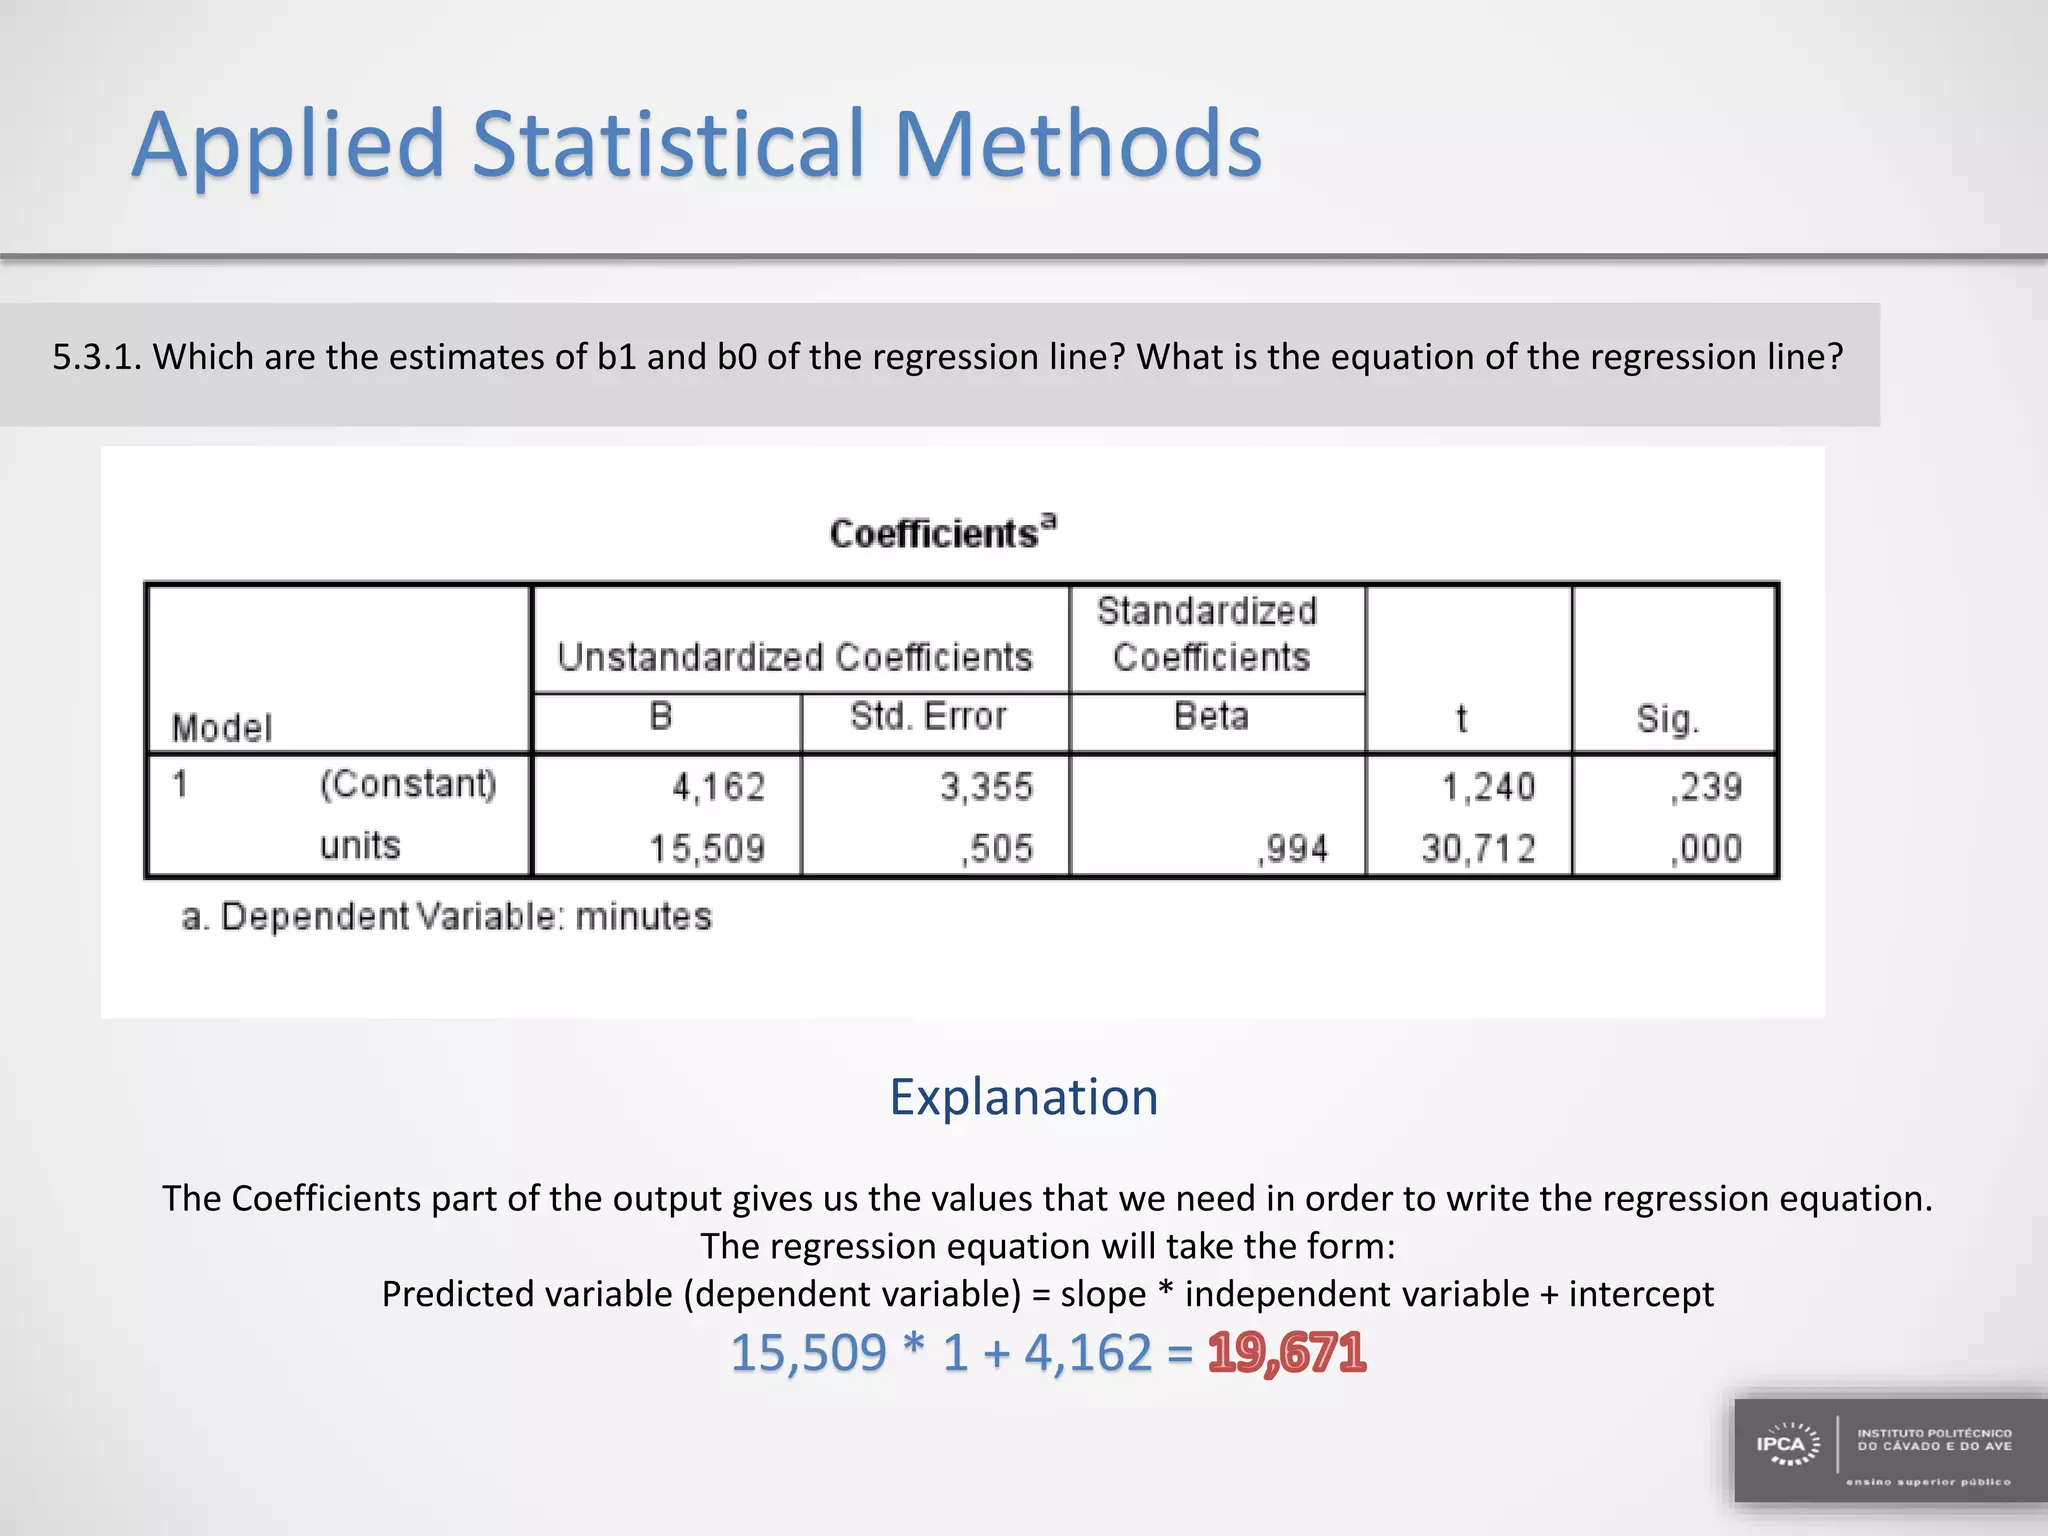
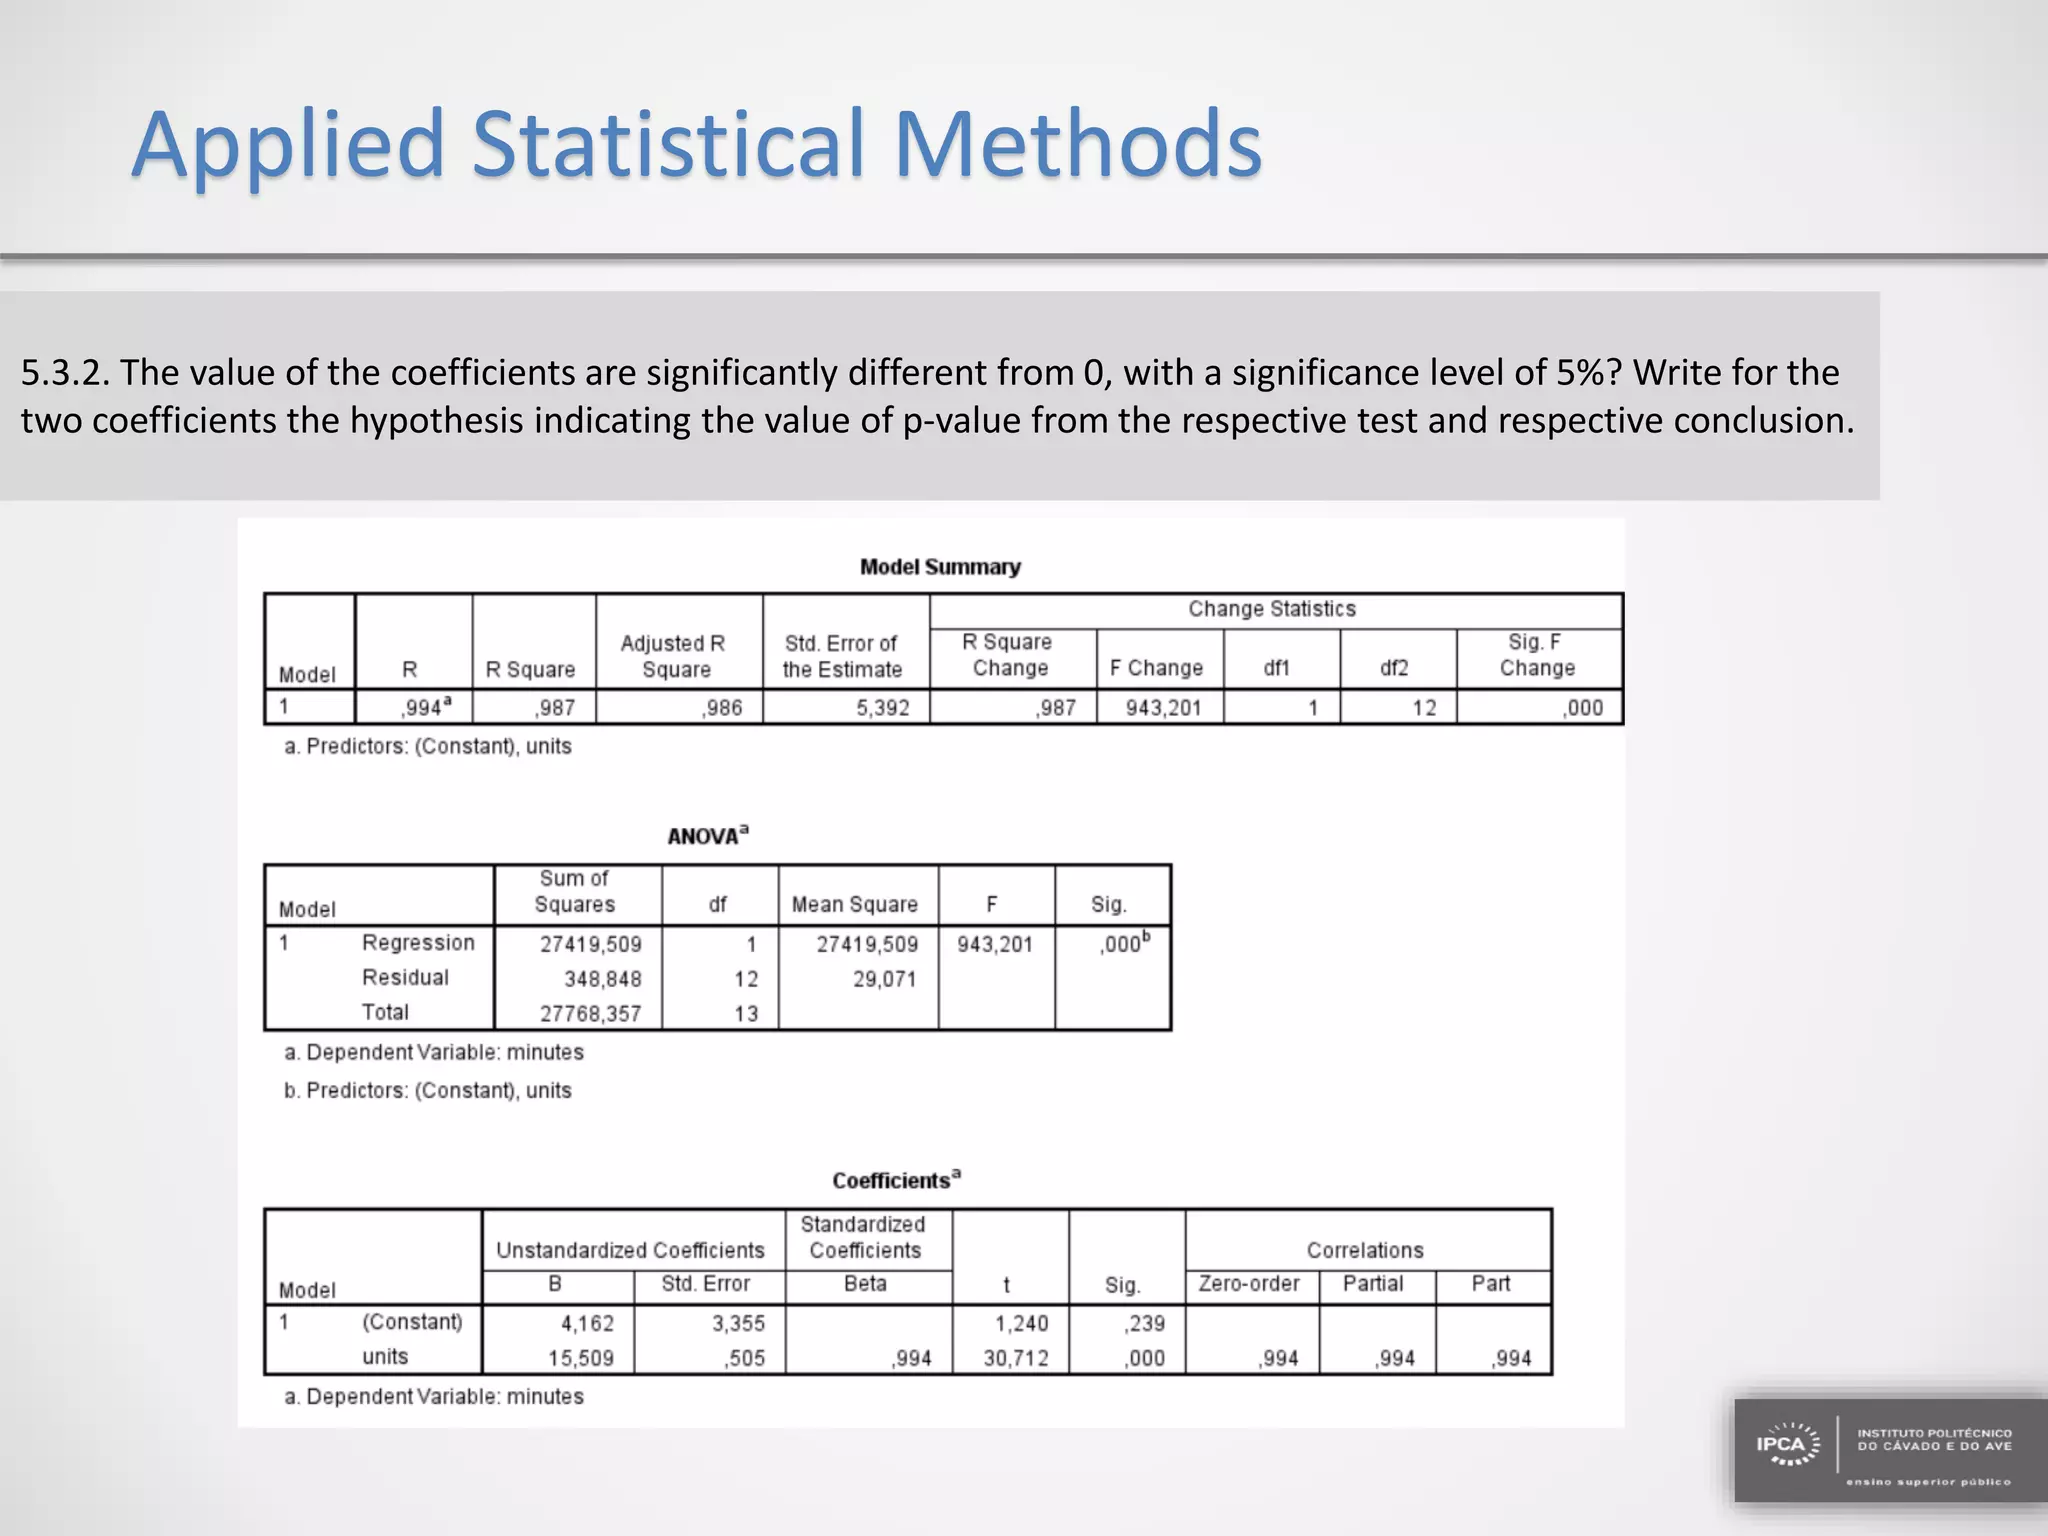
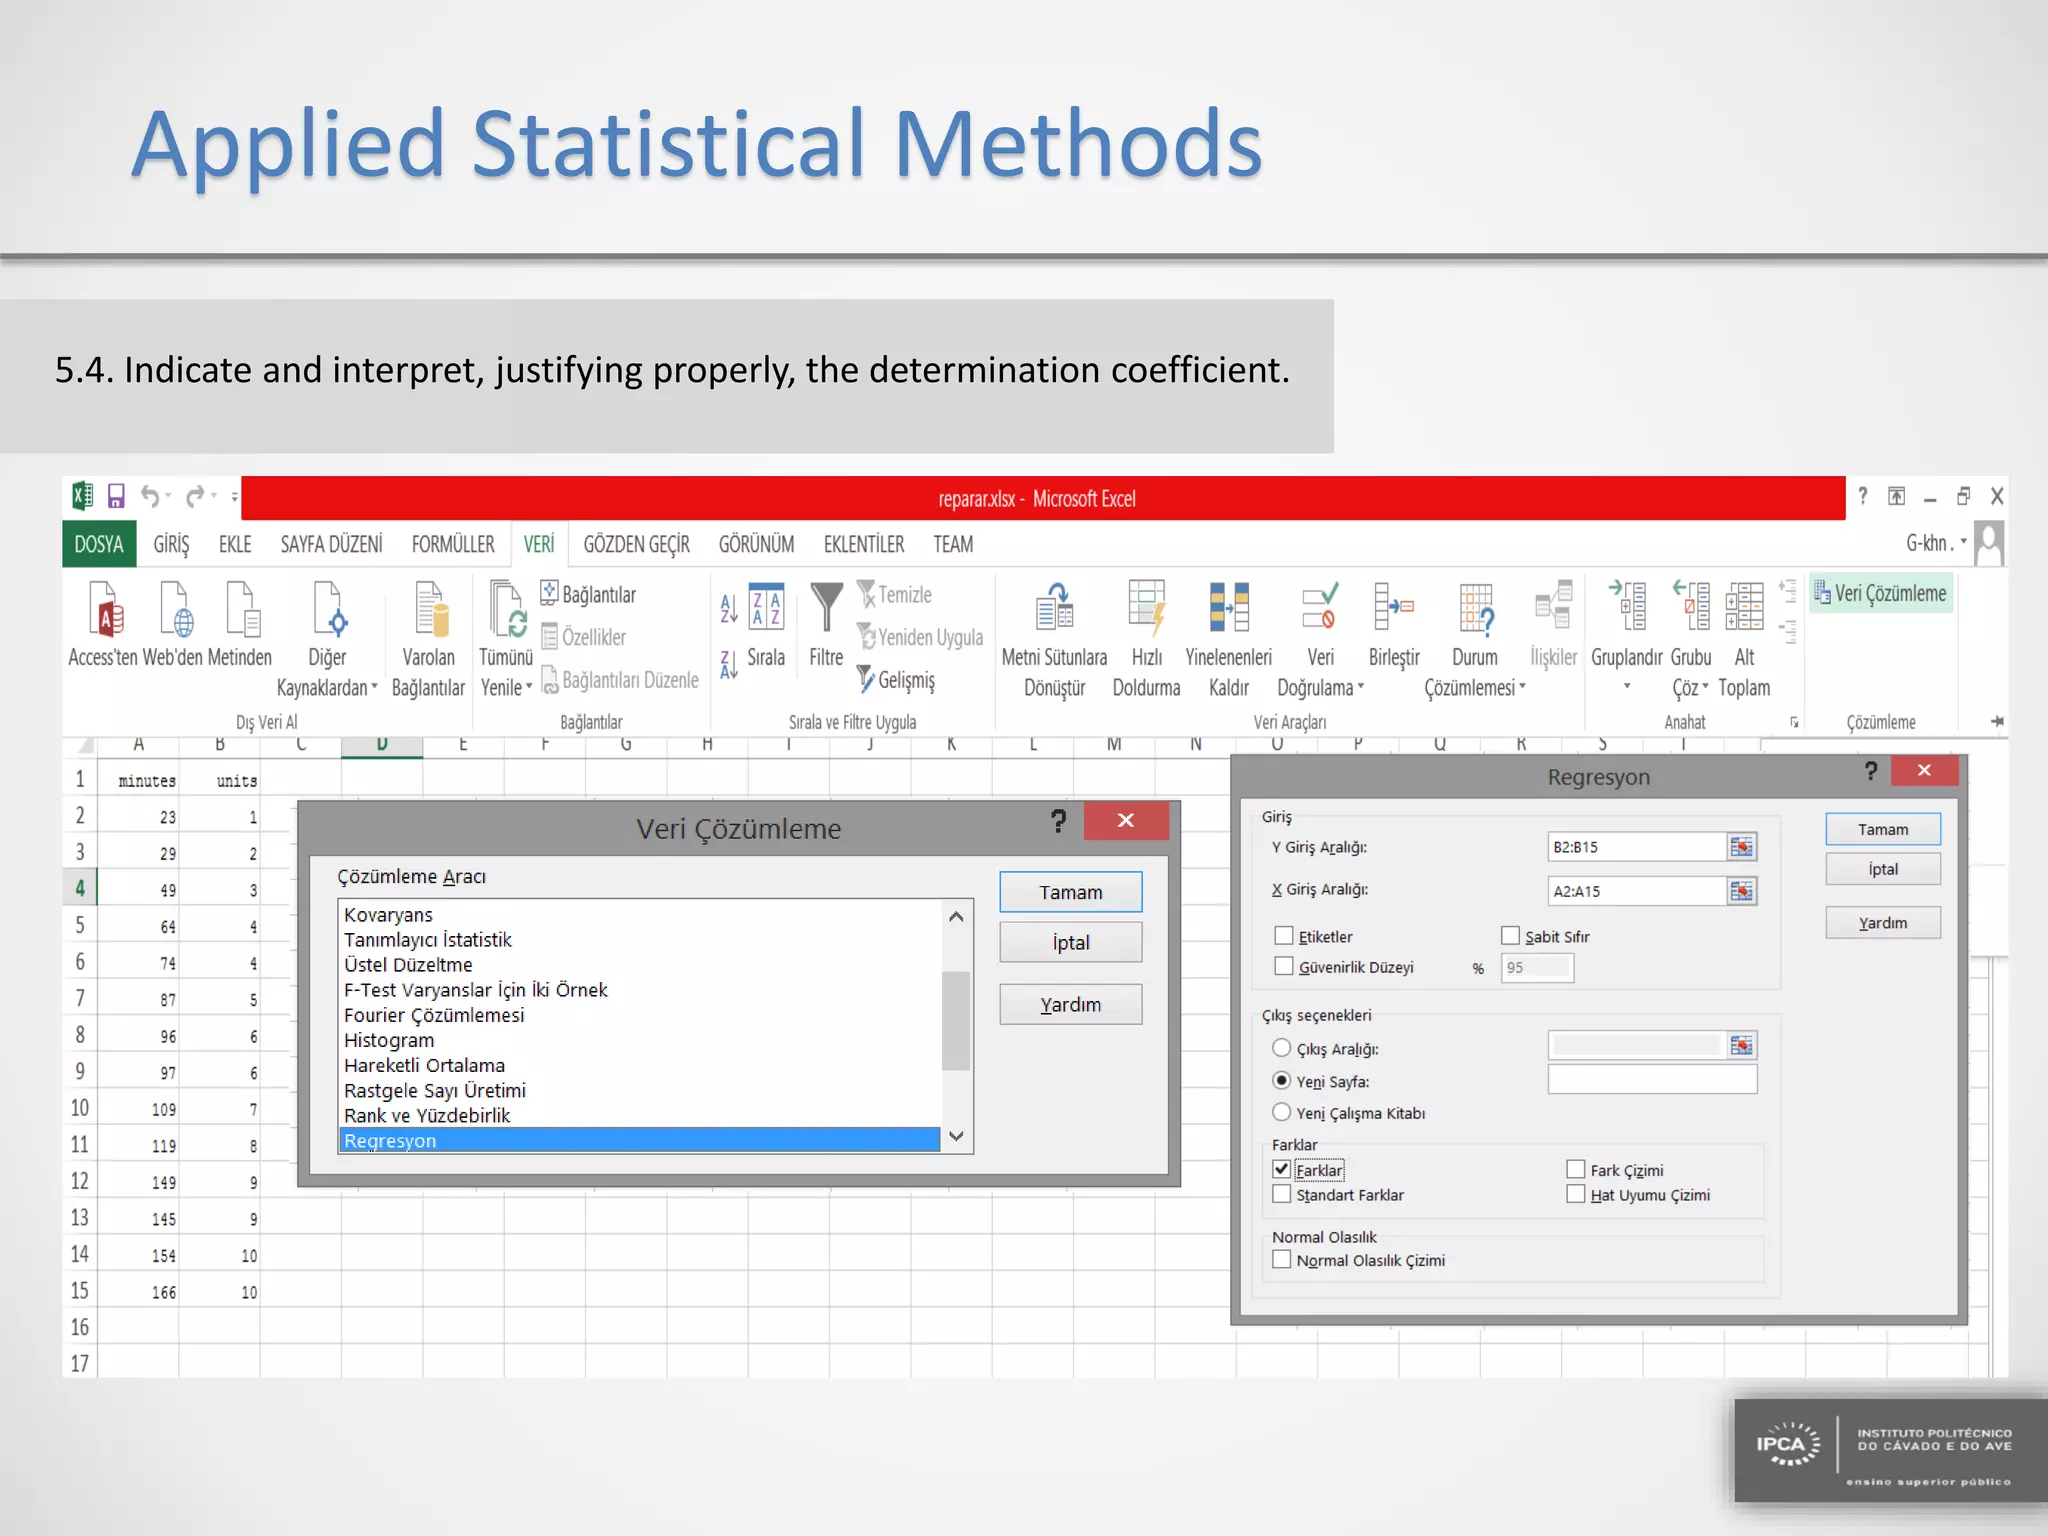
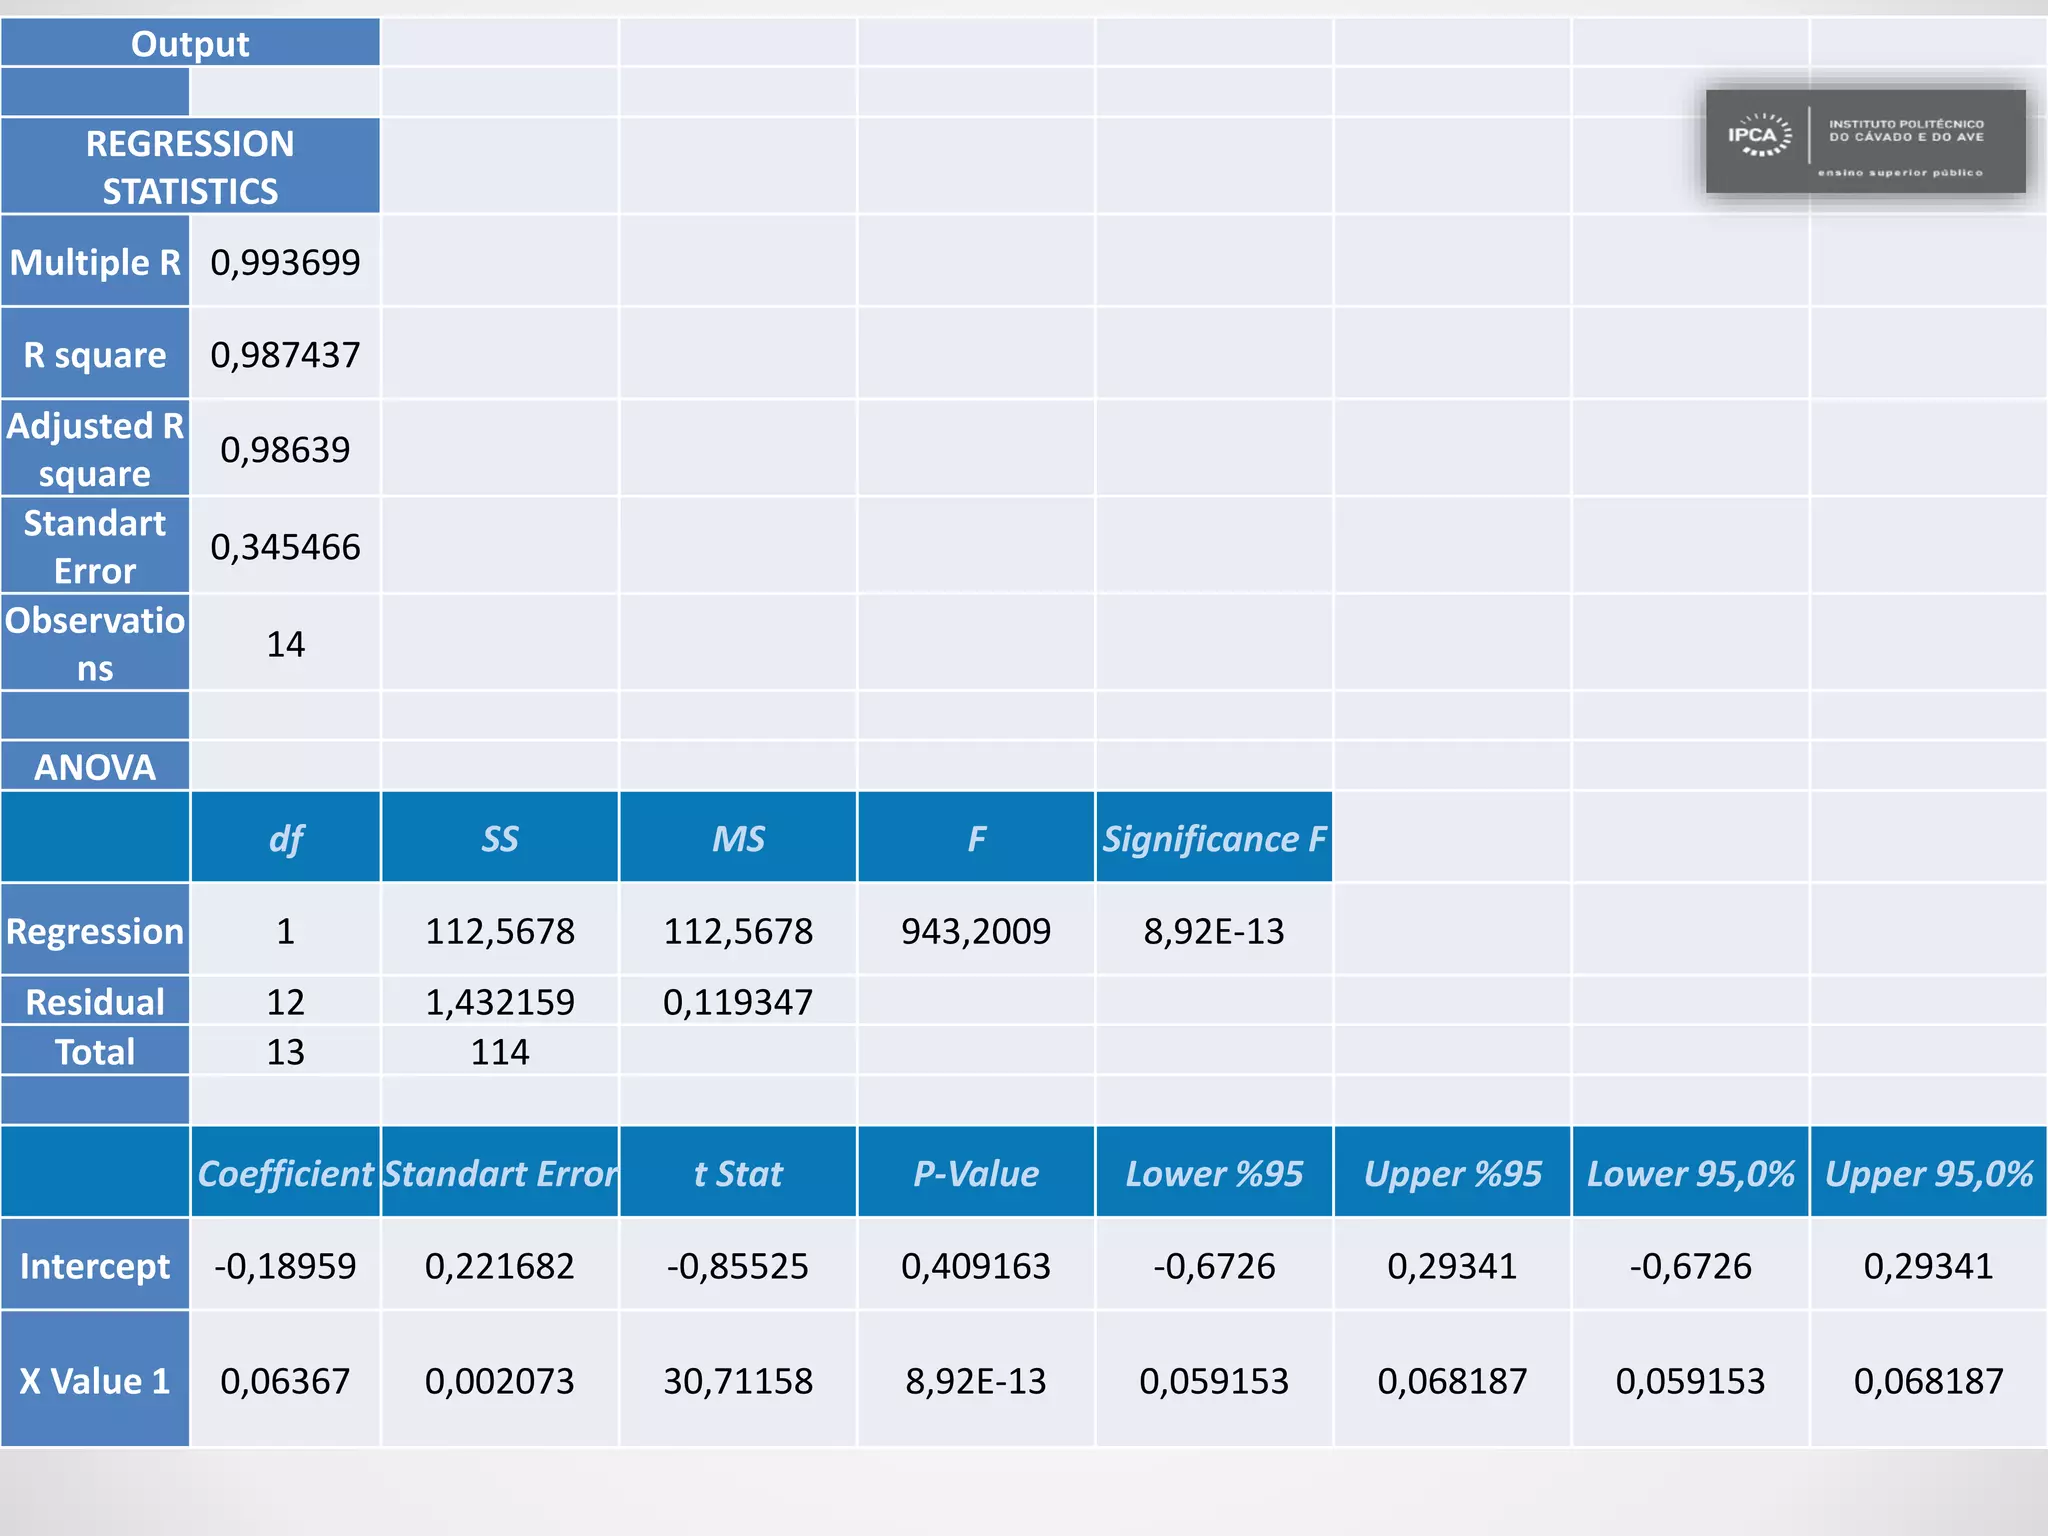
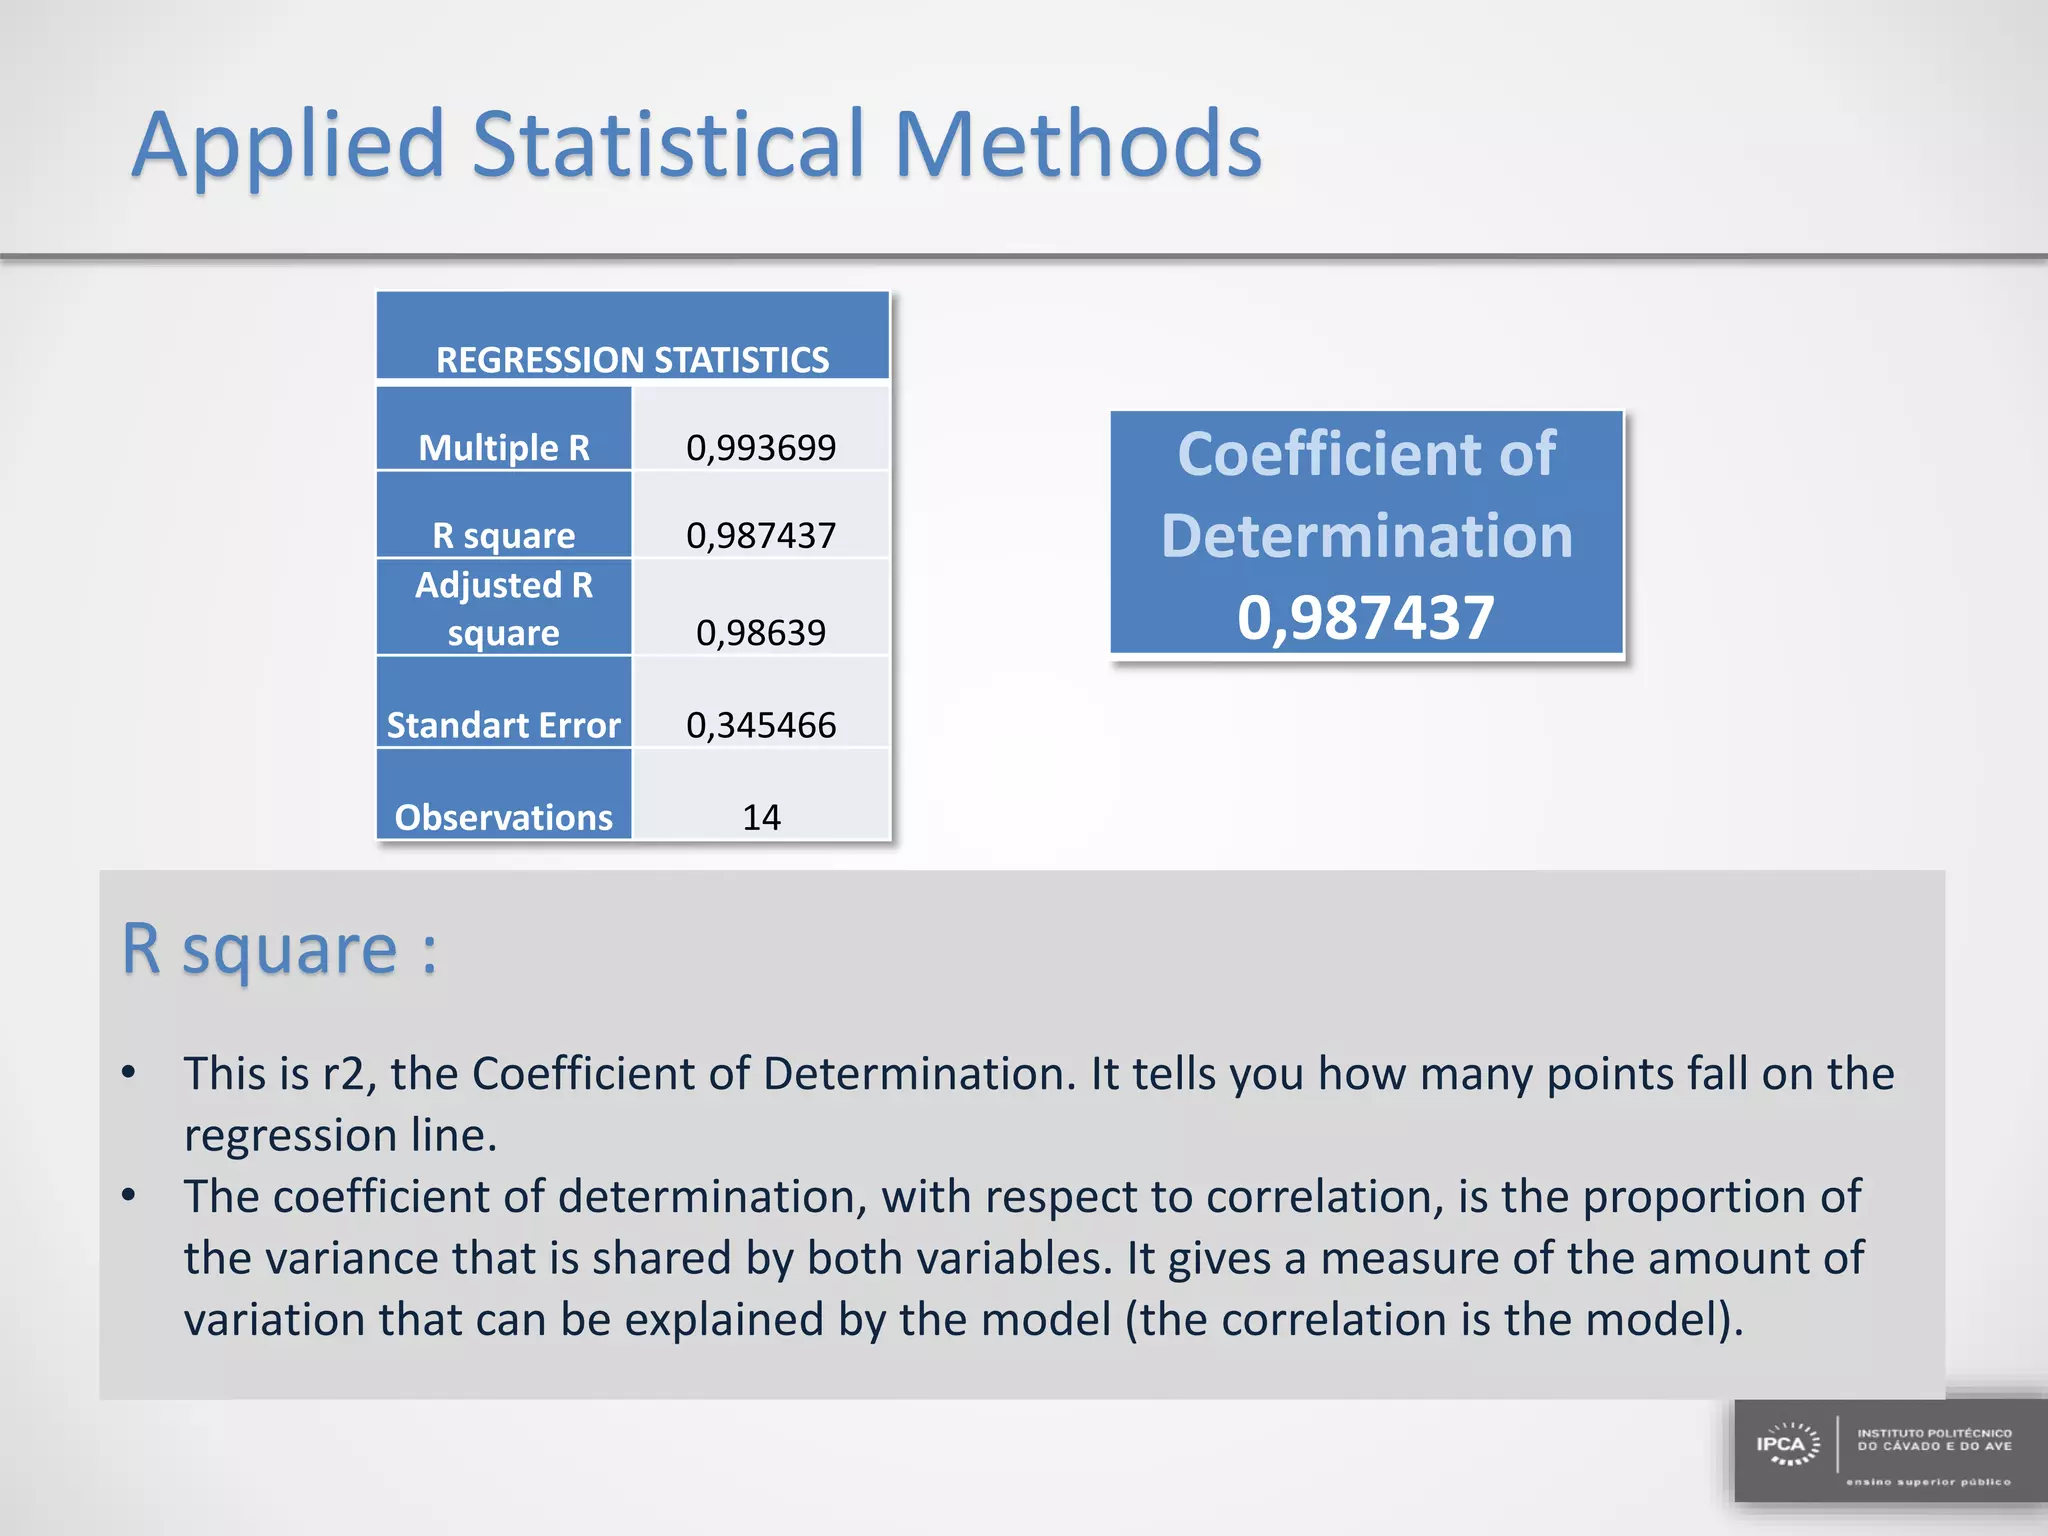

The document discusses the application of statistical methods using SPSS to analyze data from a competition and academic tests. It includes various analyses such as calculating frequencies, central tendency measures, hypothesis testing, and regression analysis to assess relationships between variables. Additionally, it explores probability problems related to defective items from suppliers.