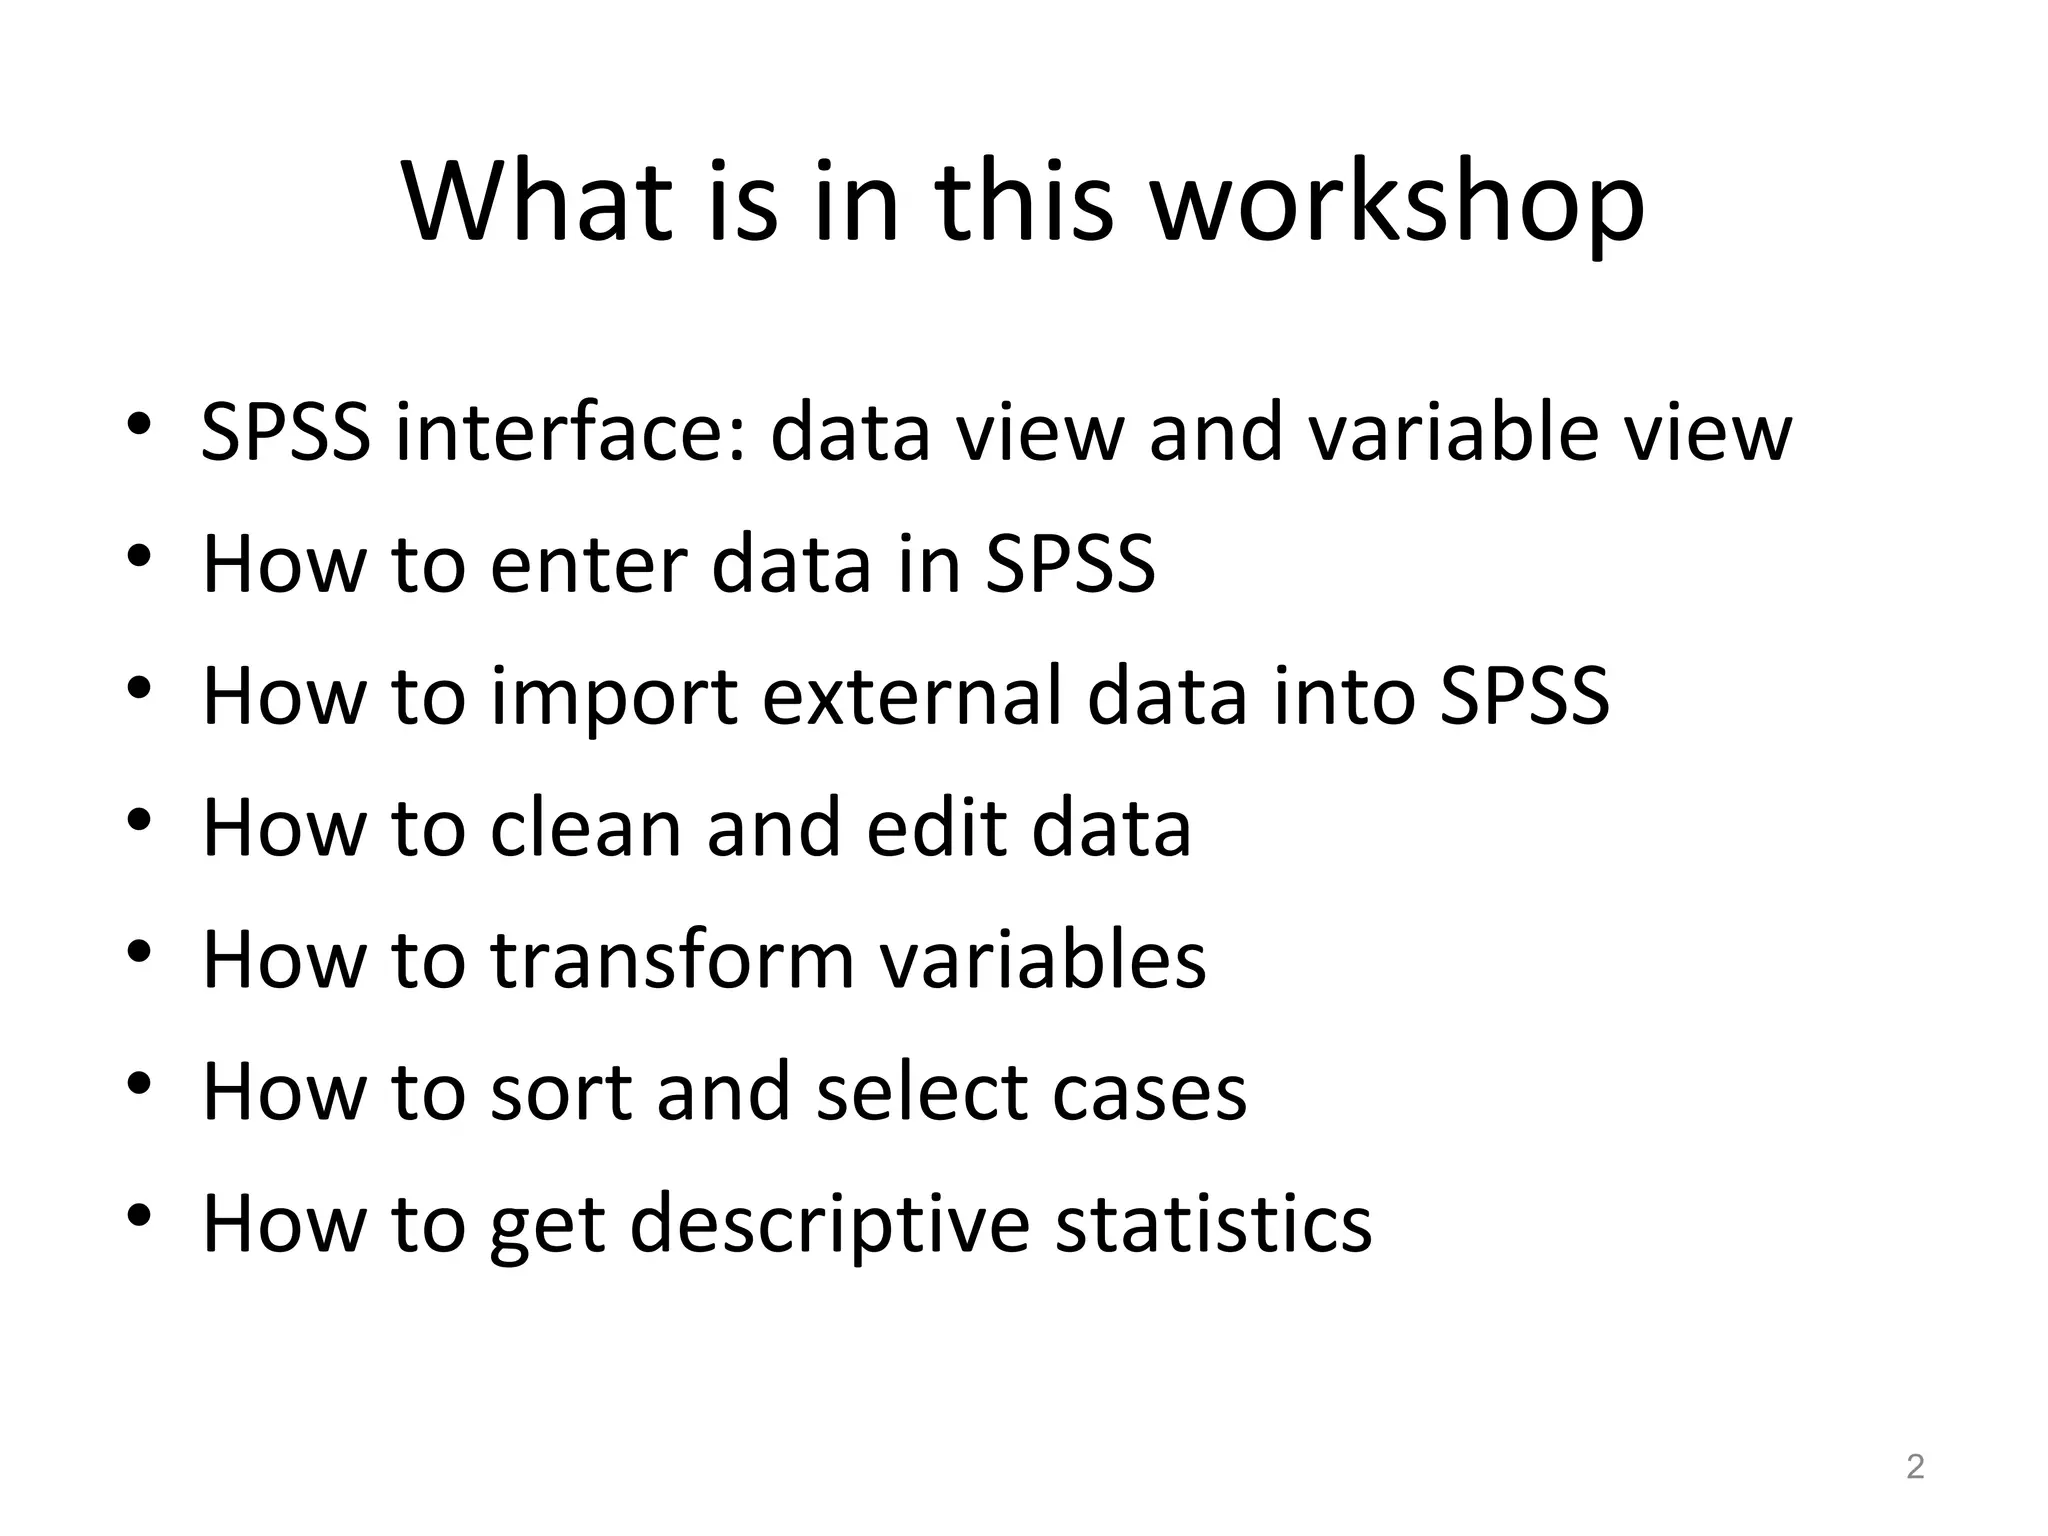
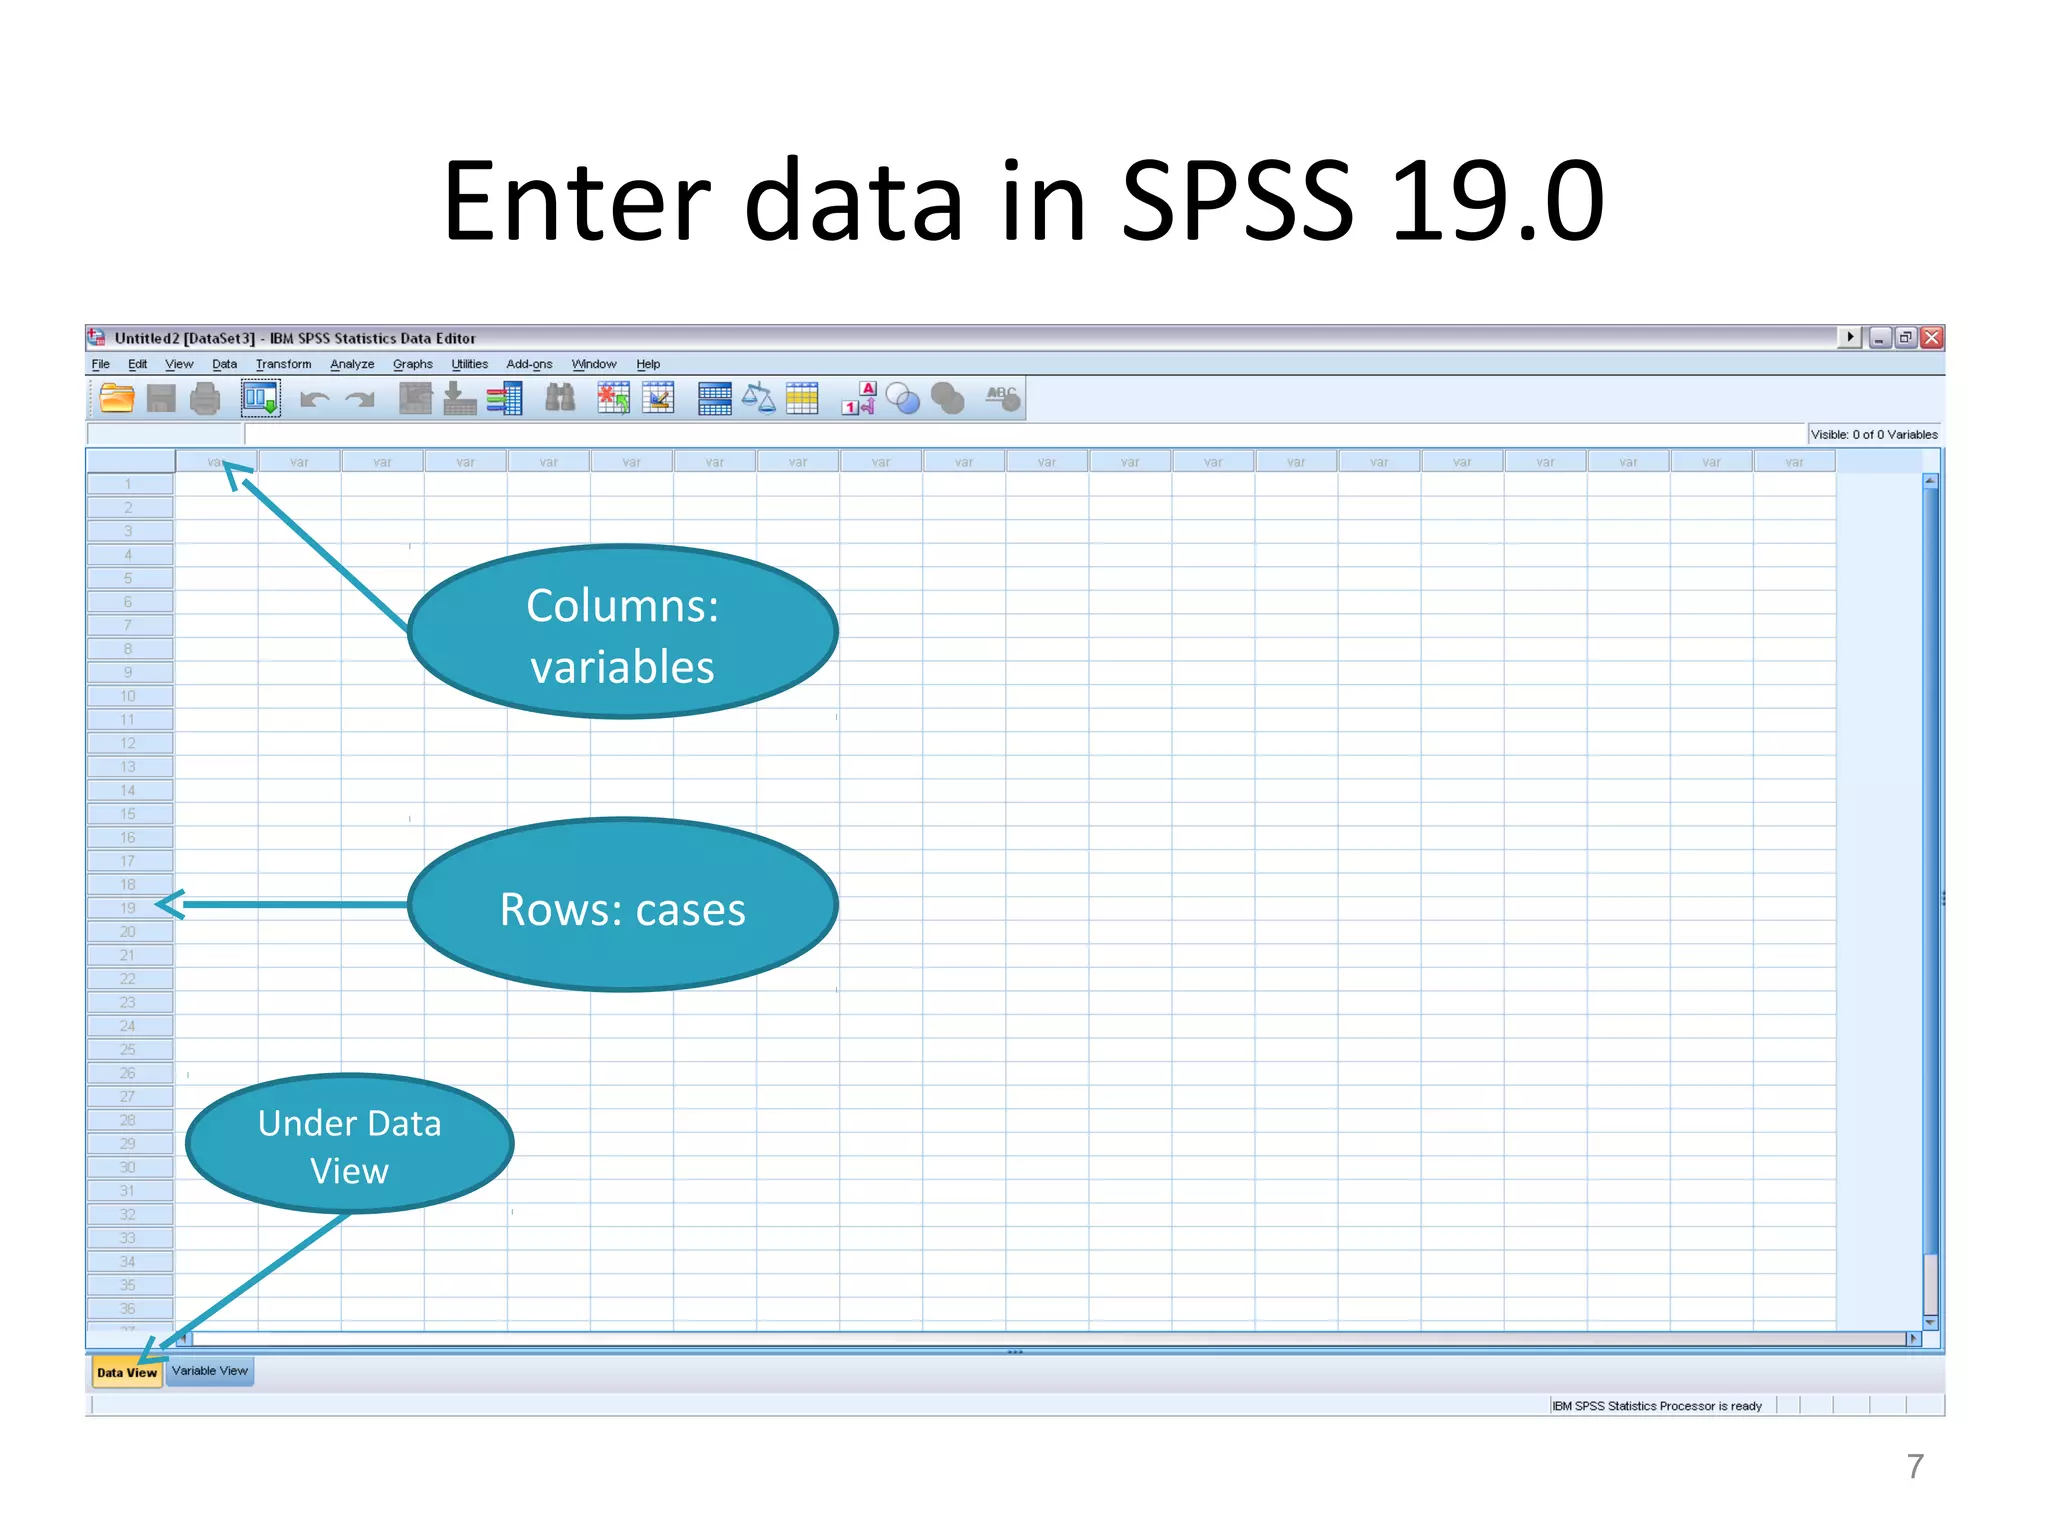
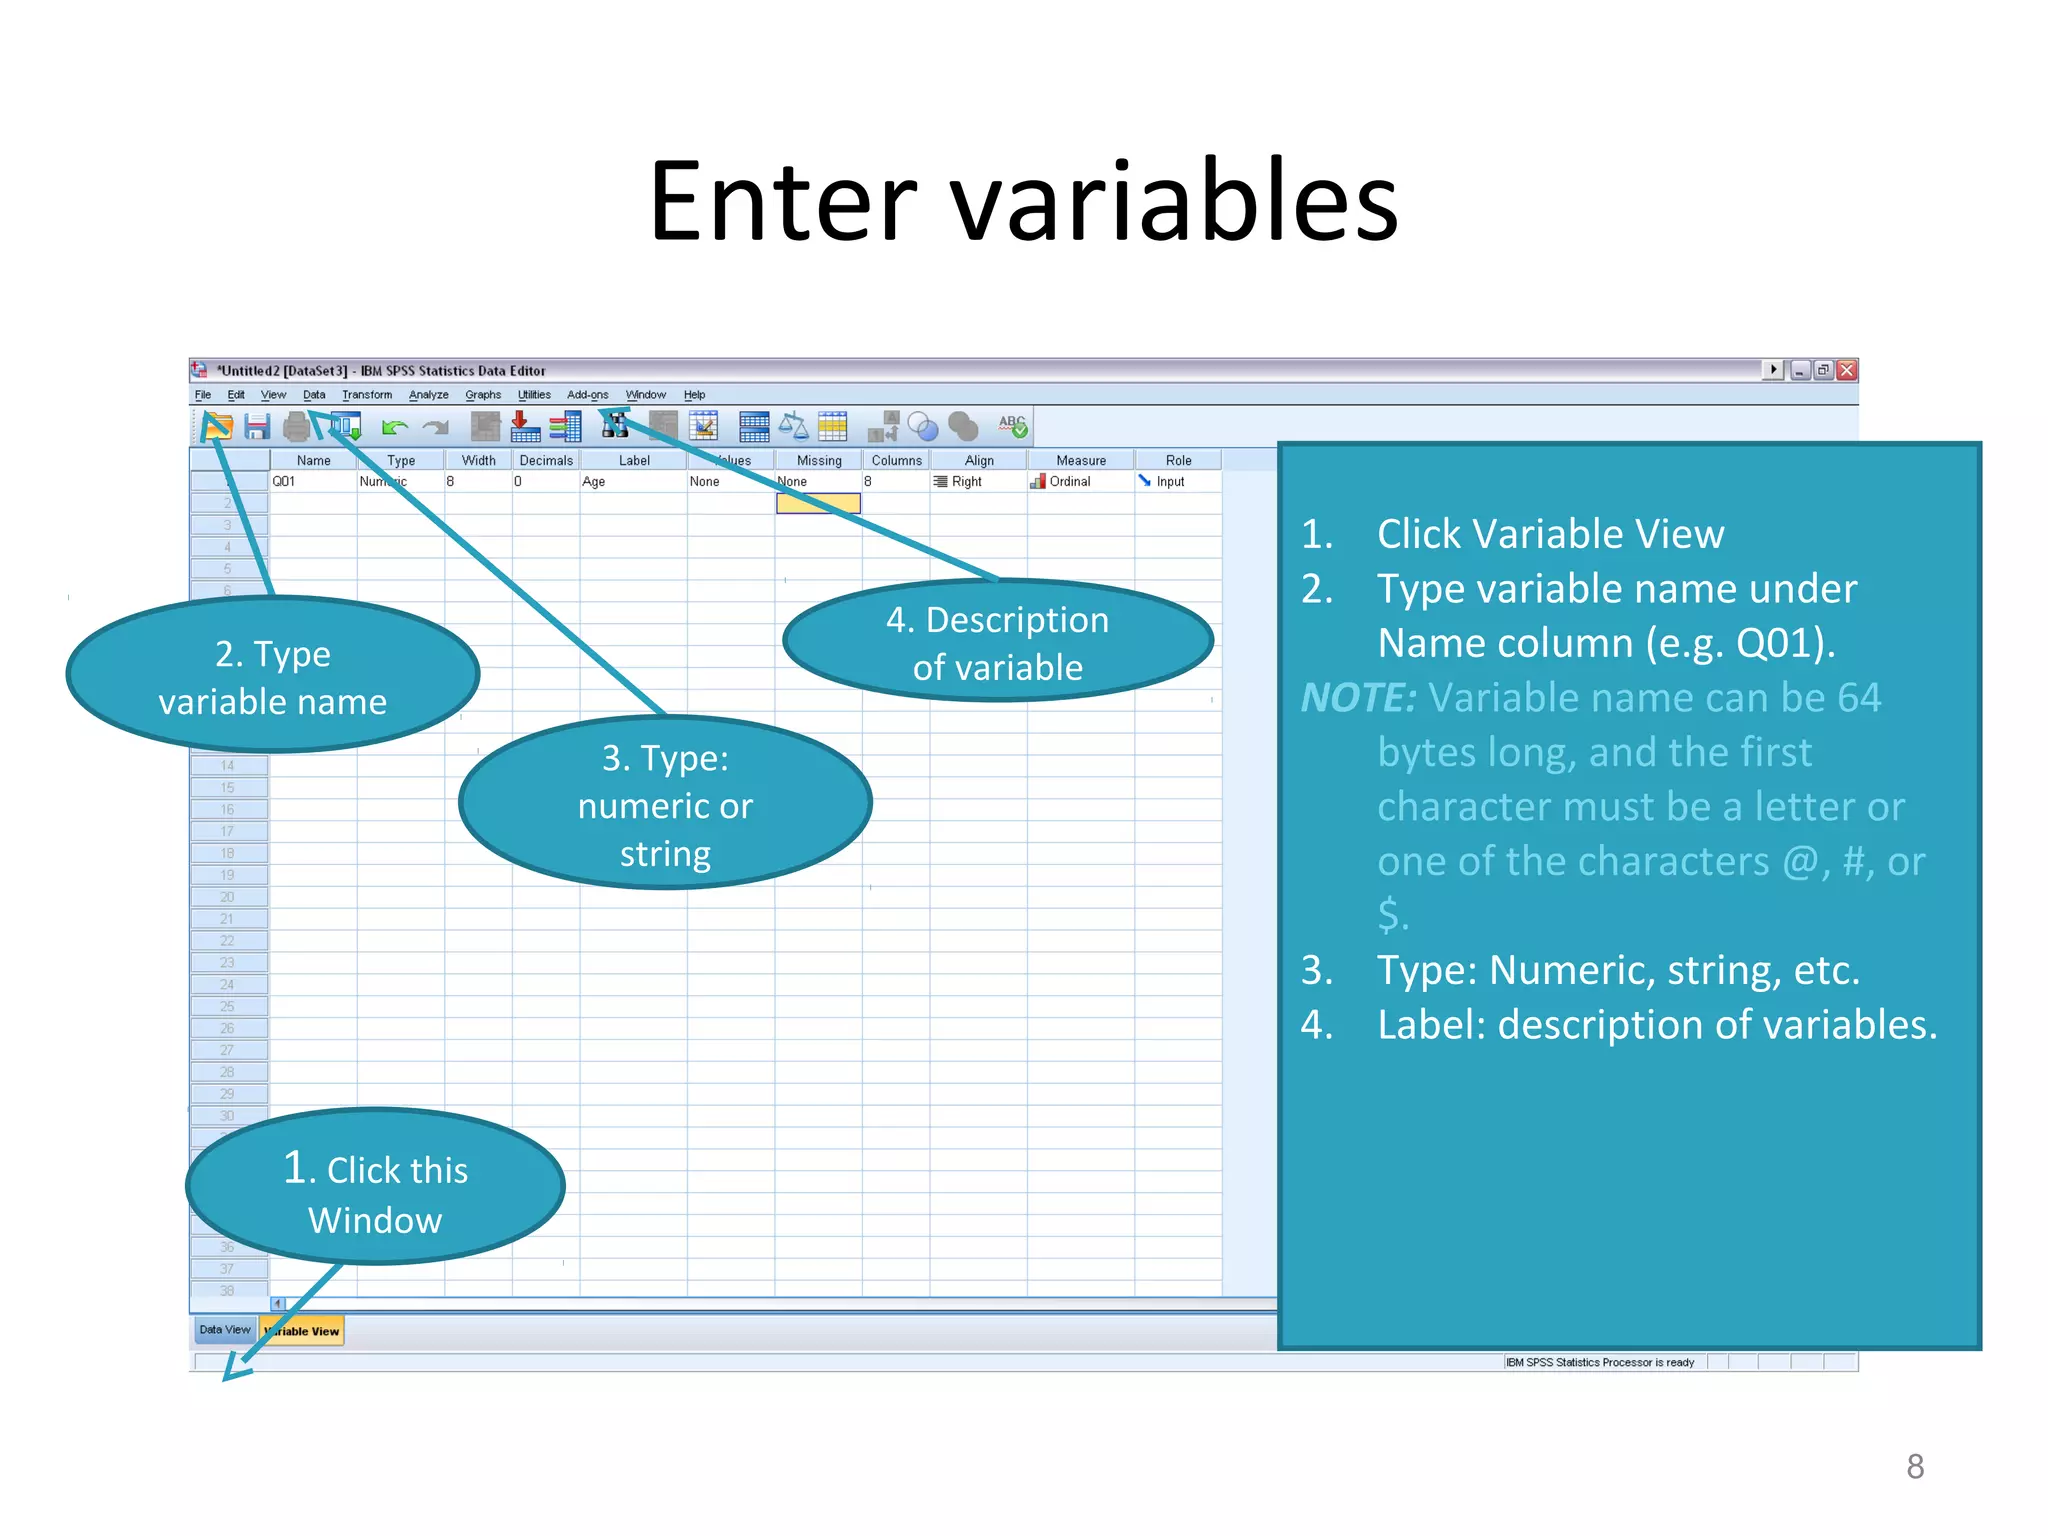
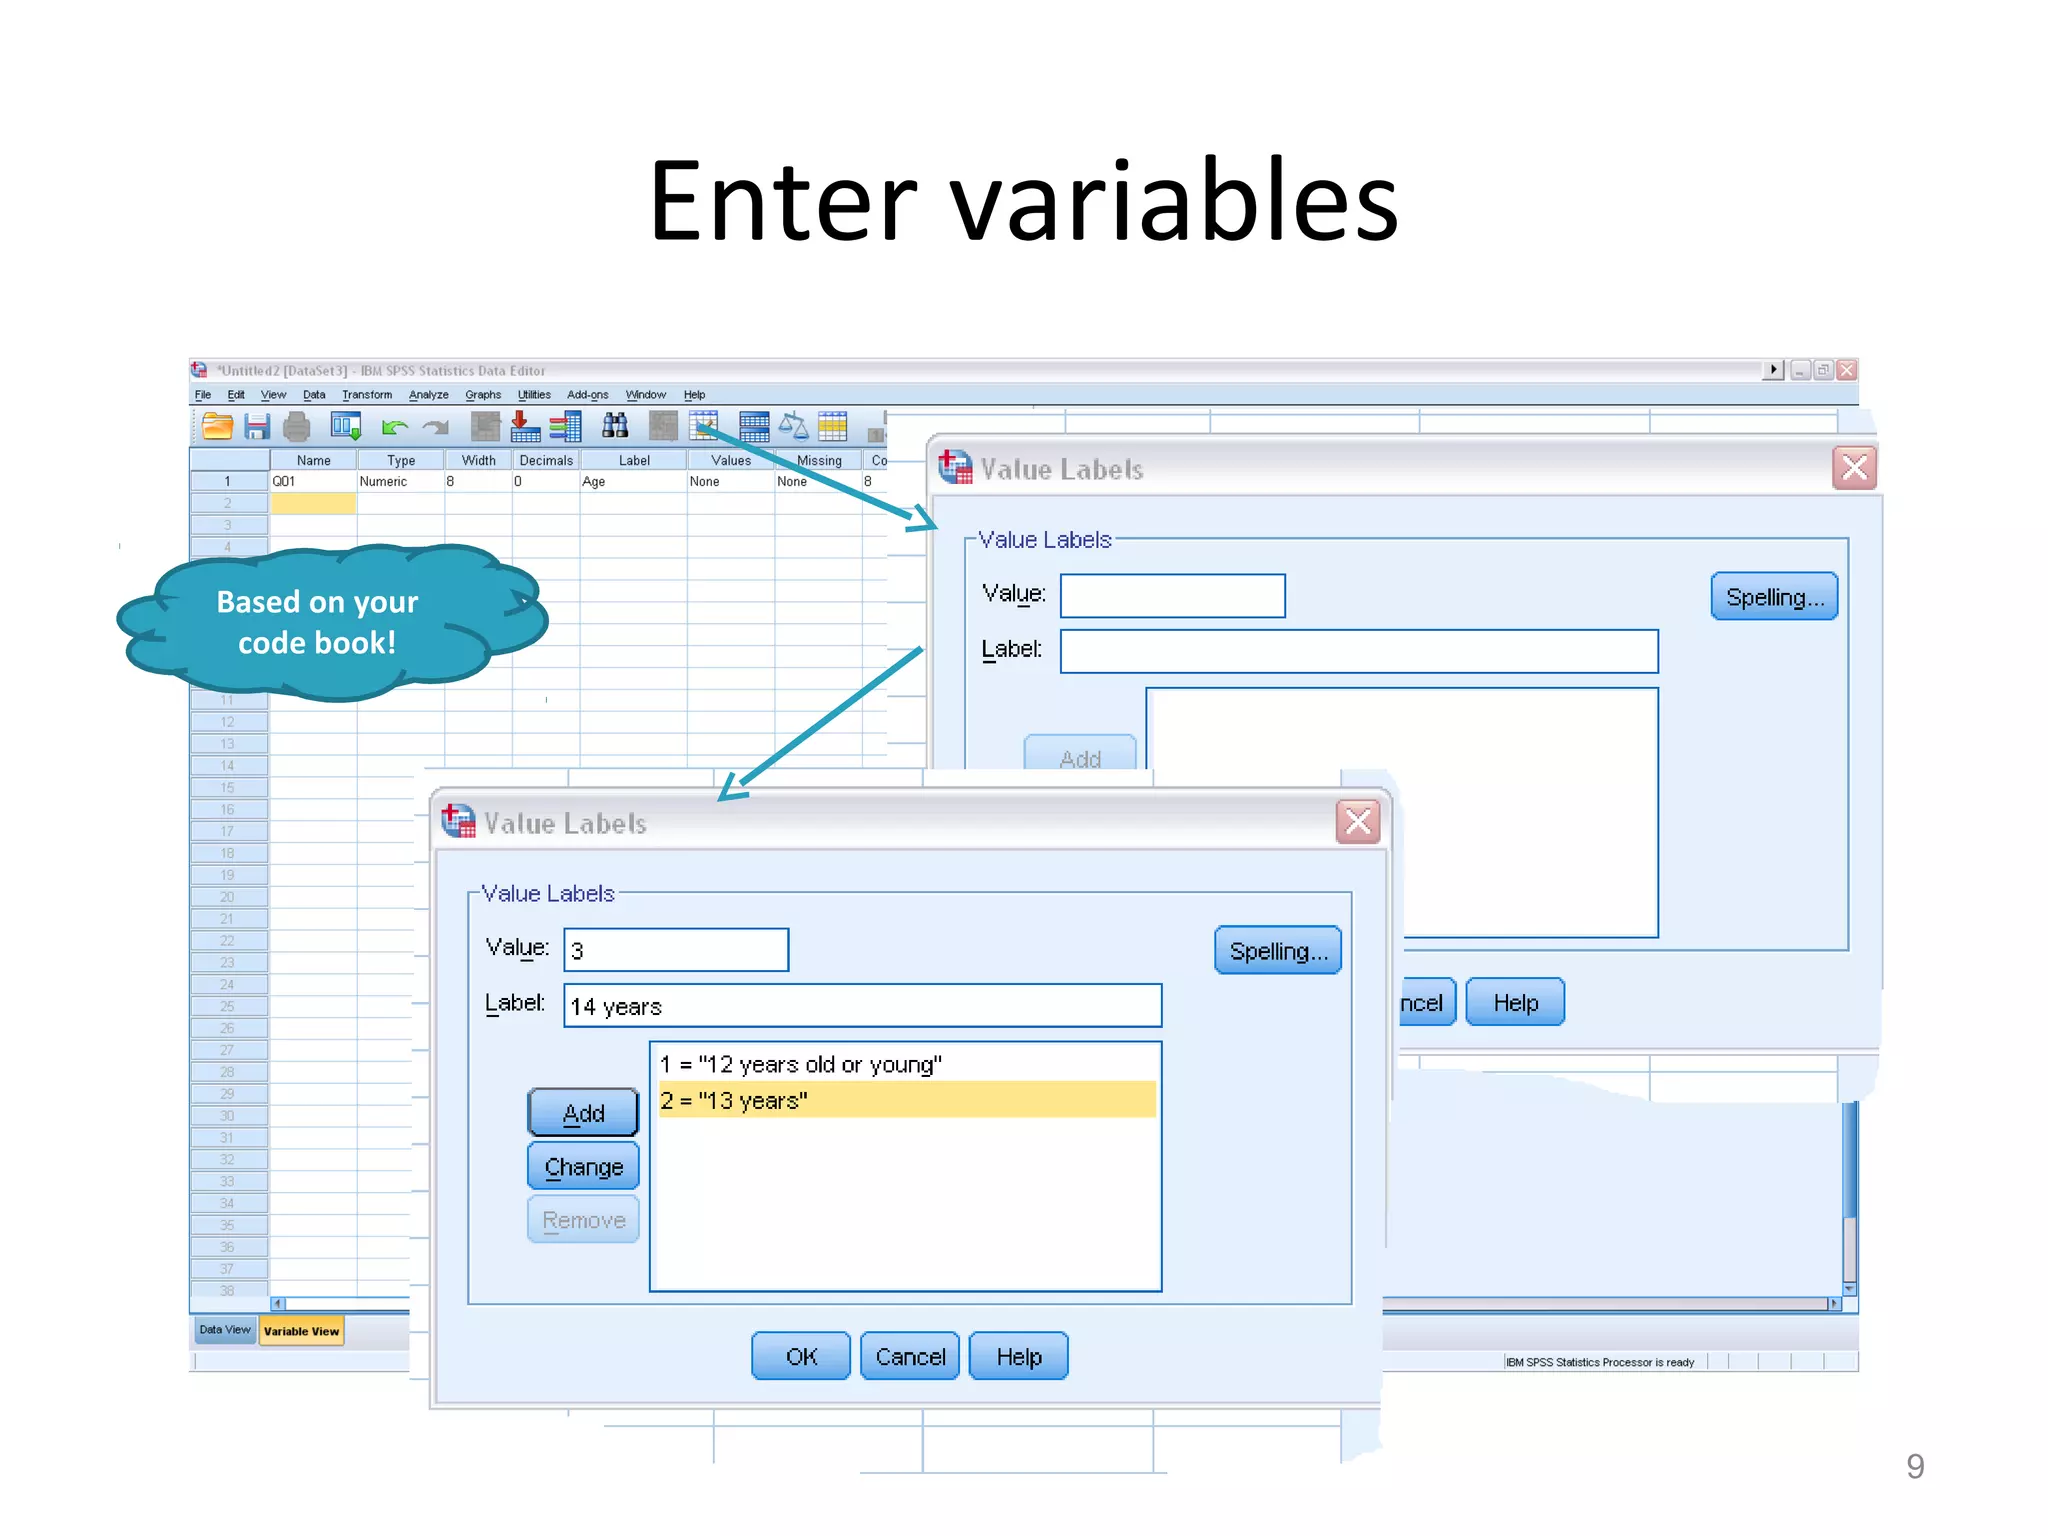
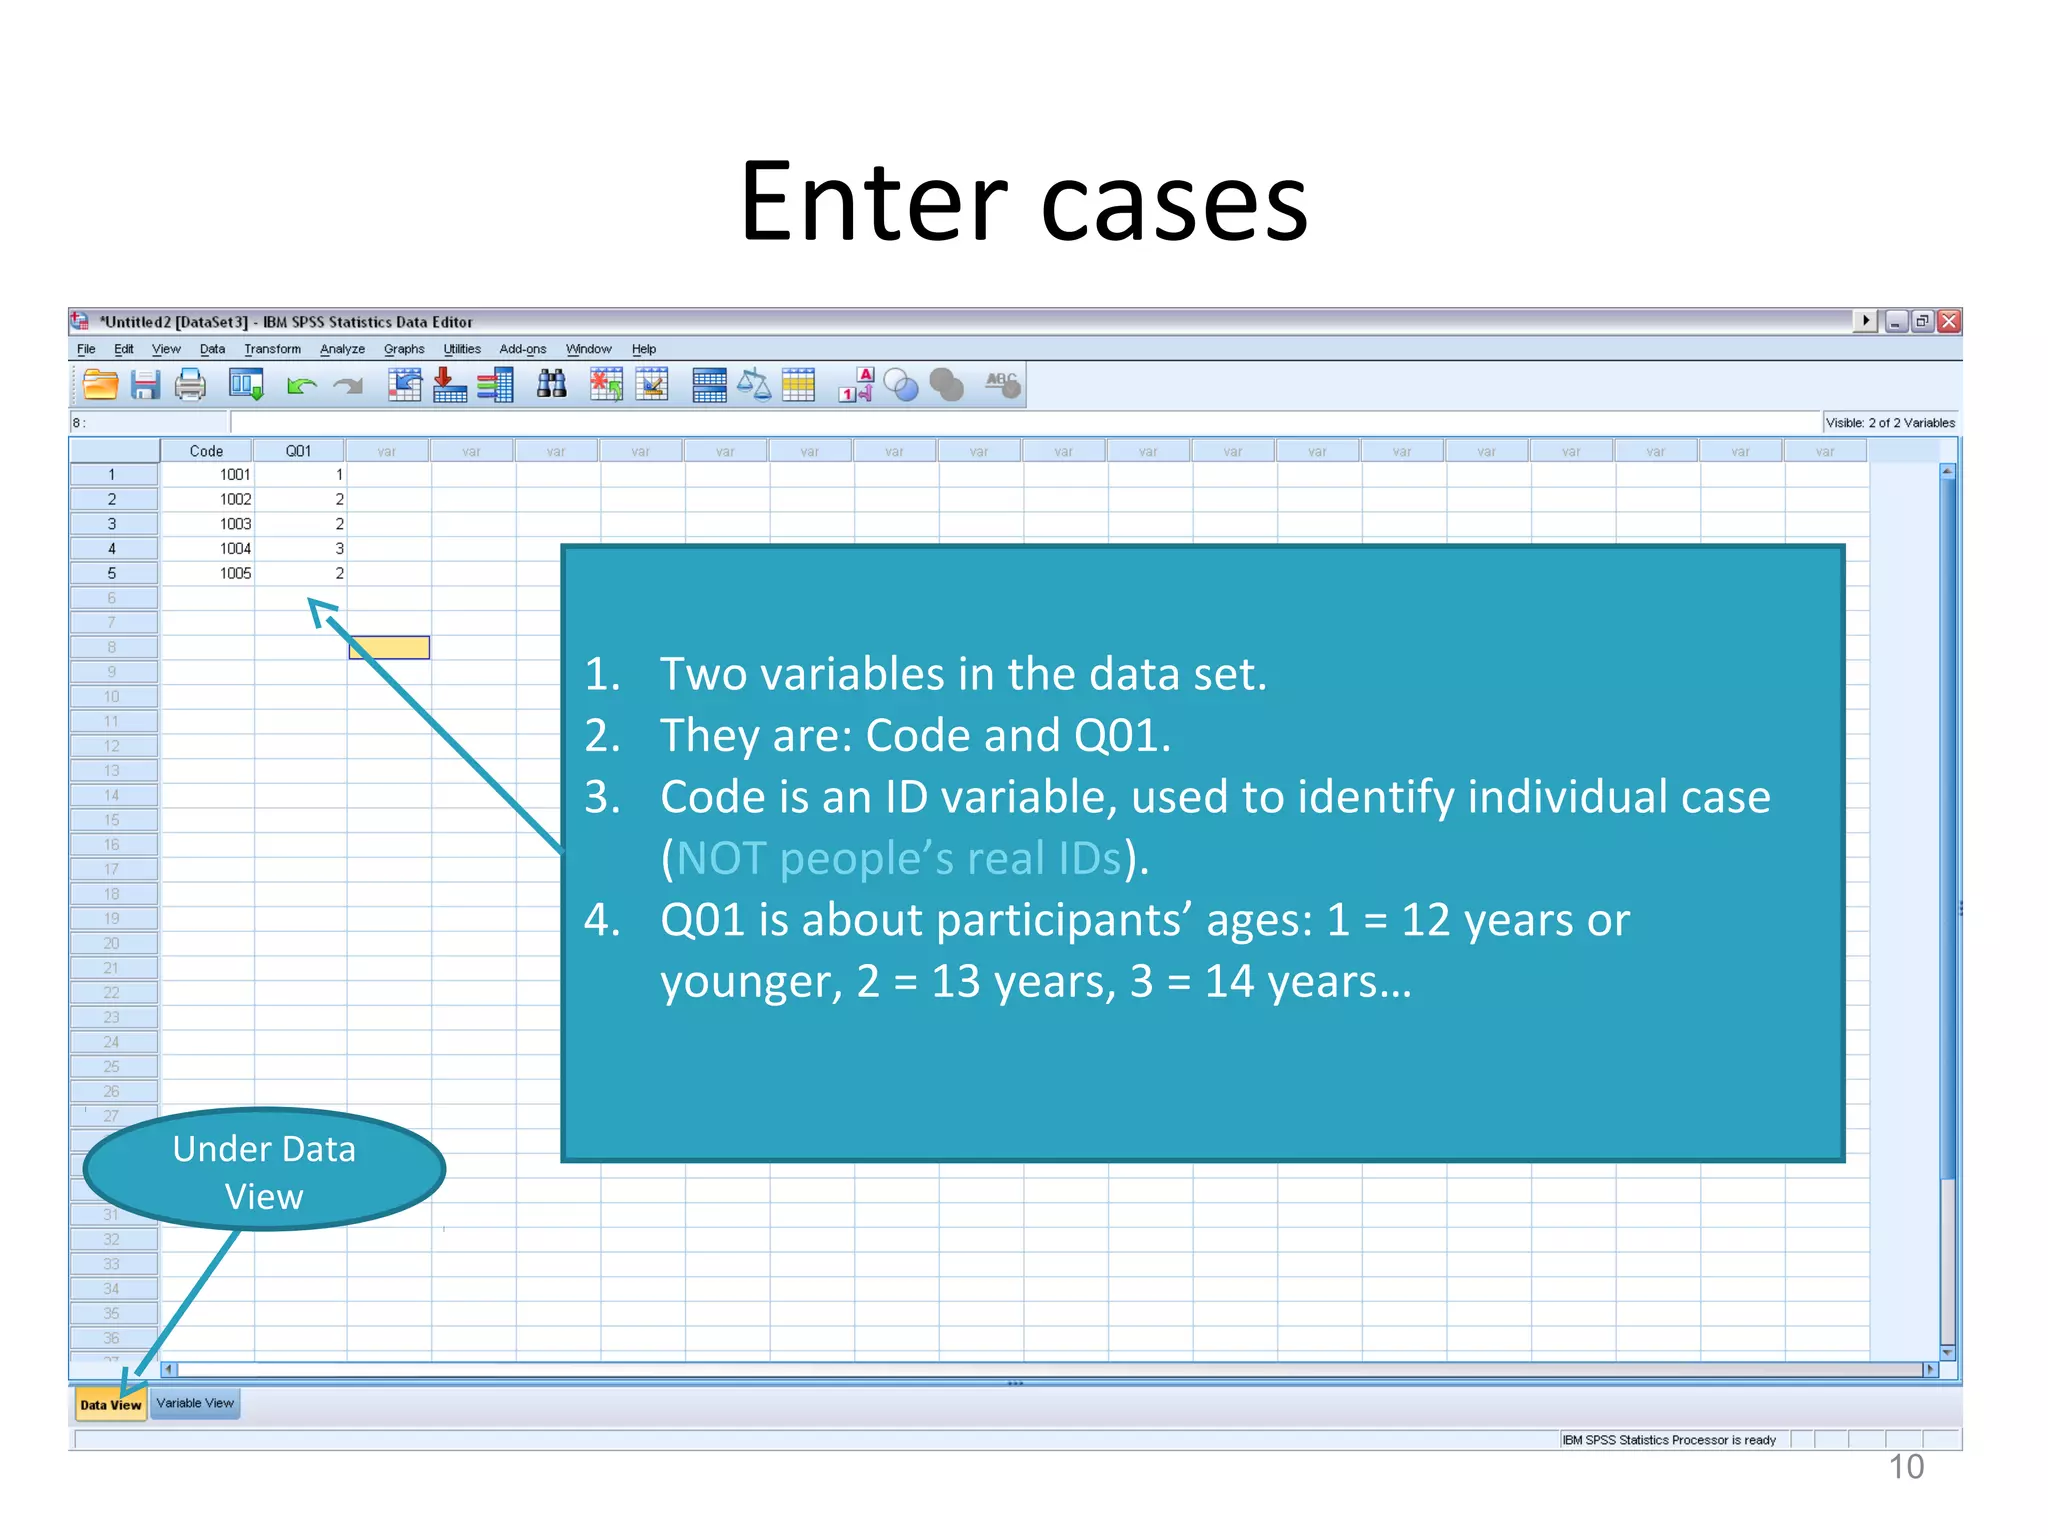
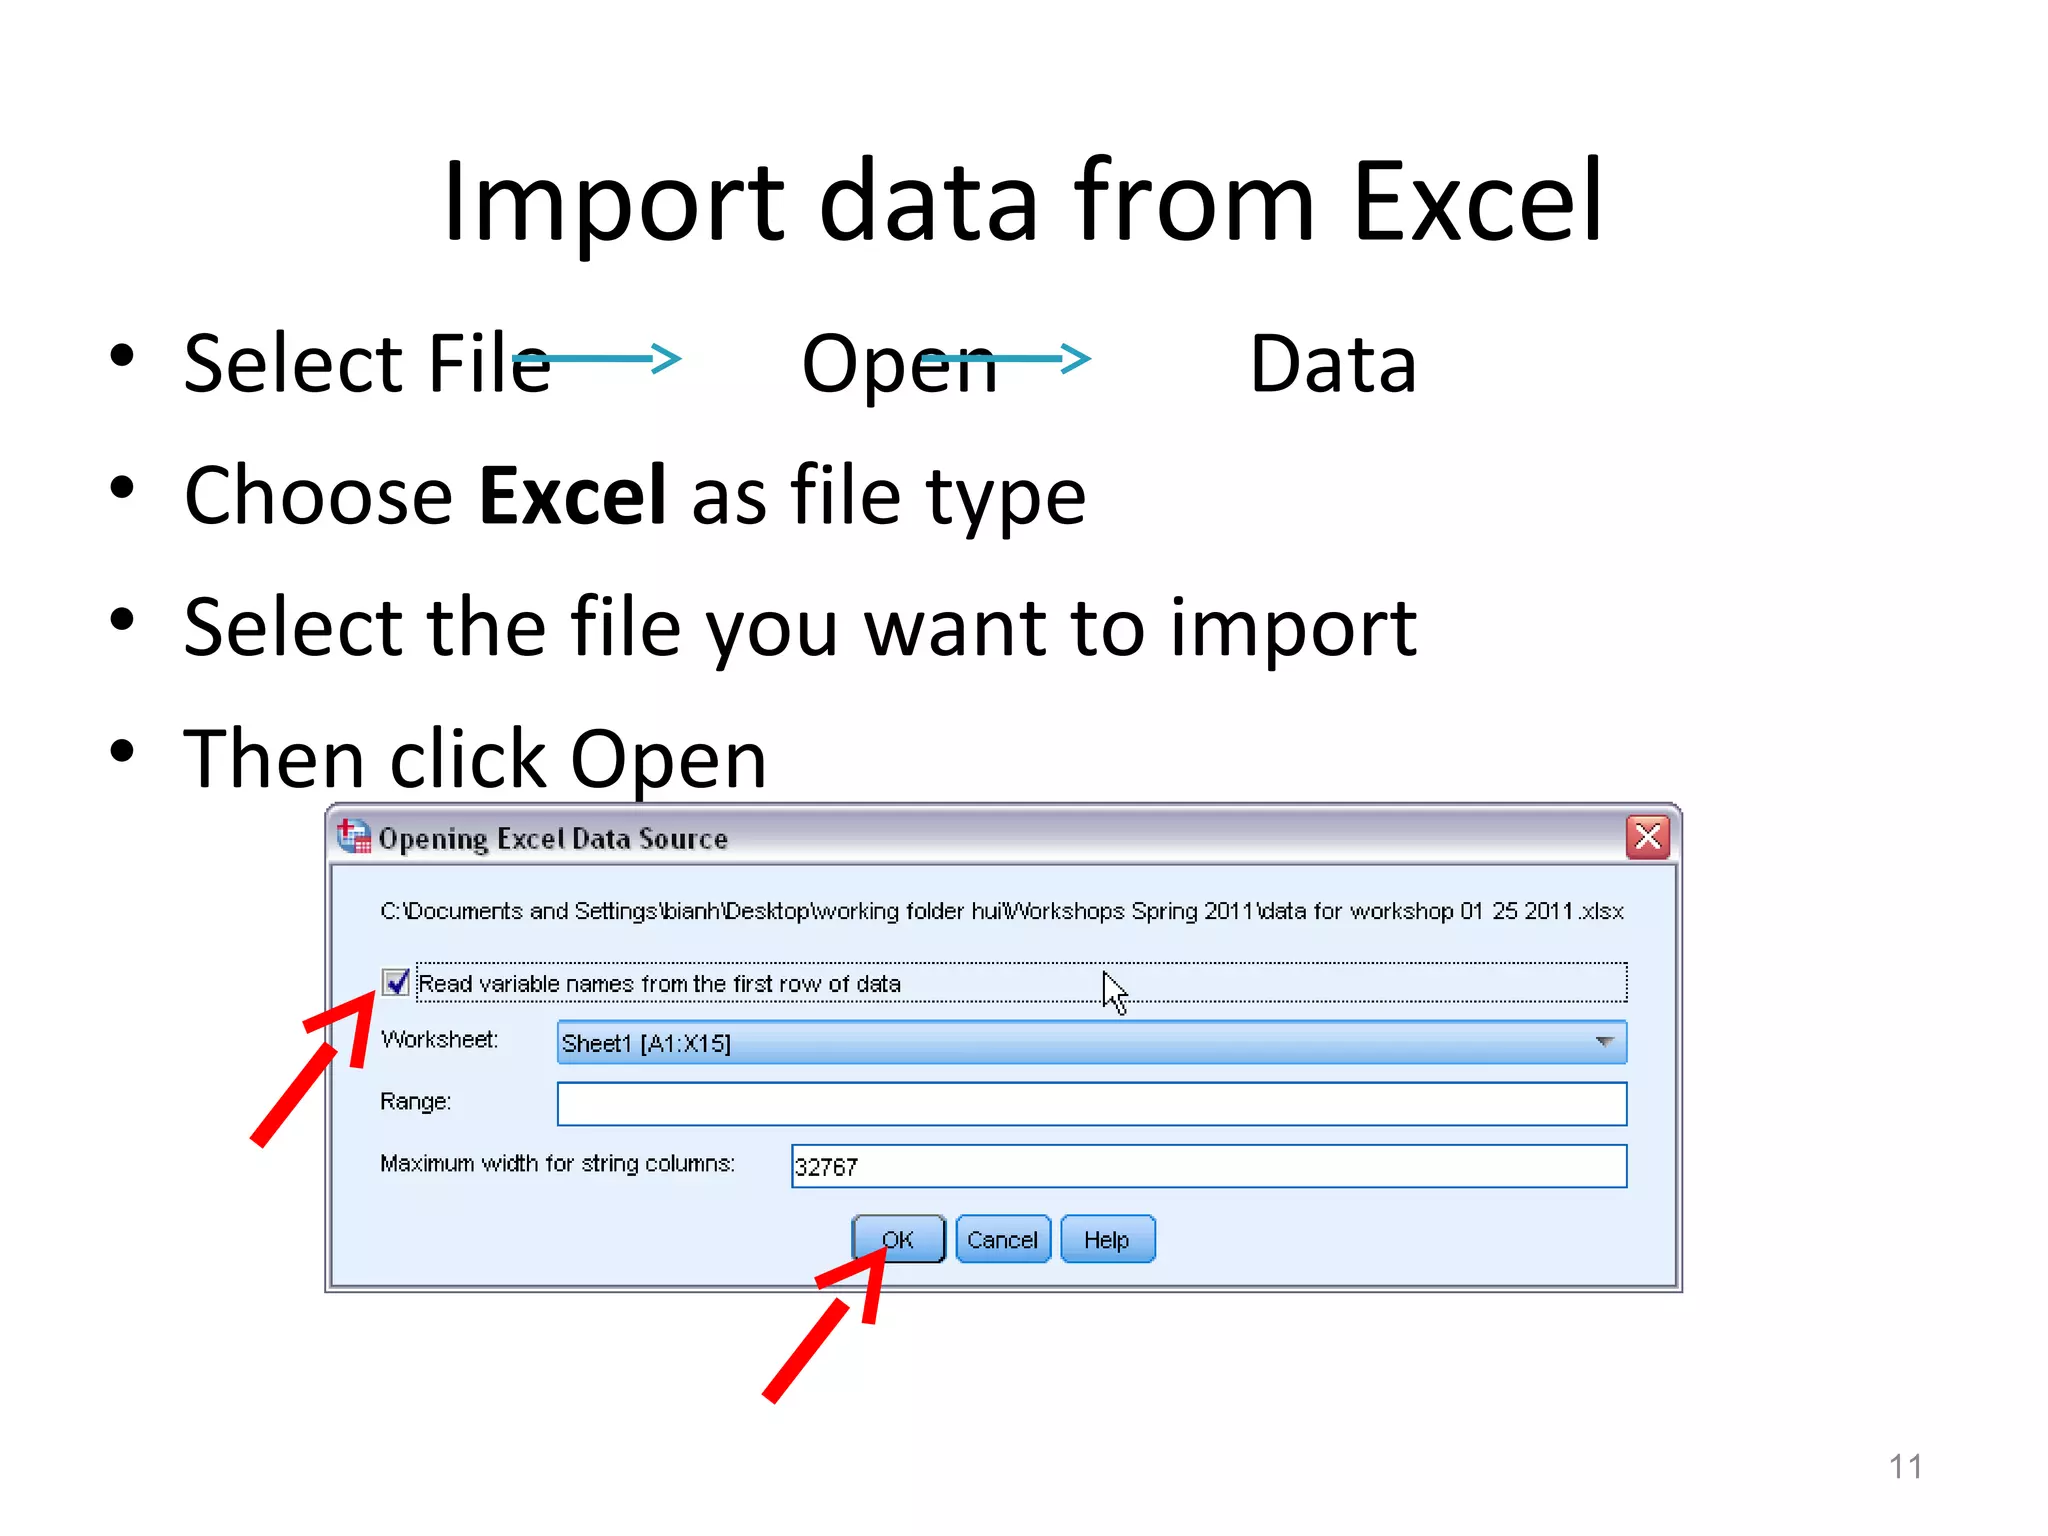
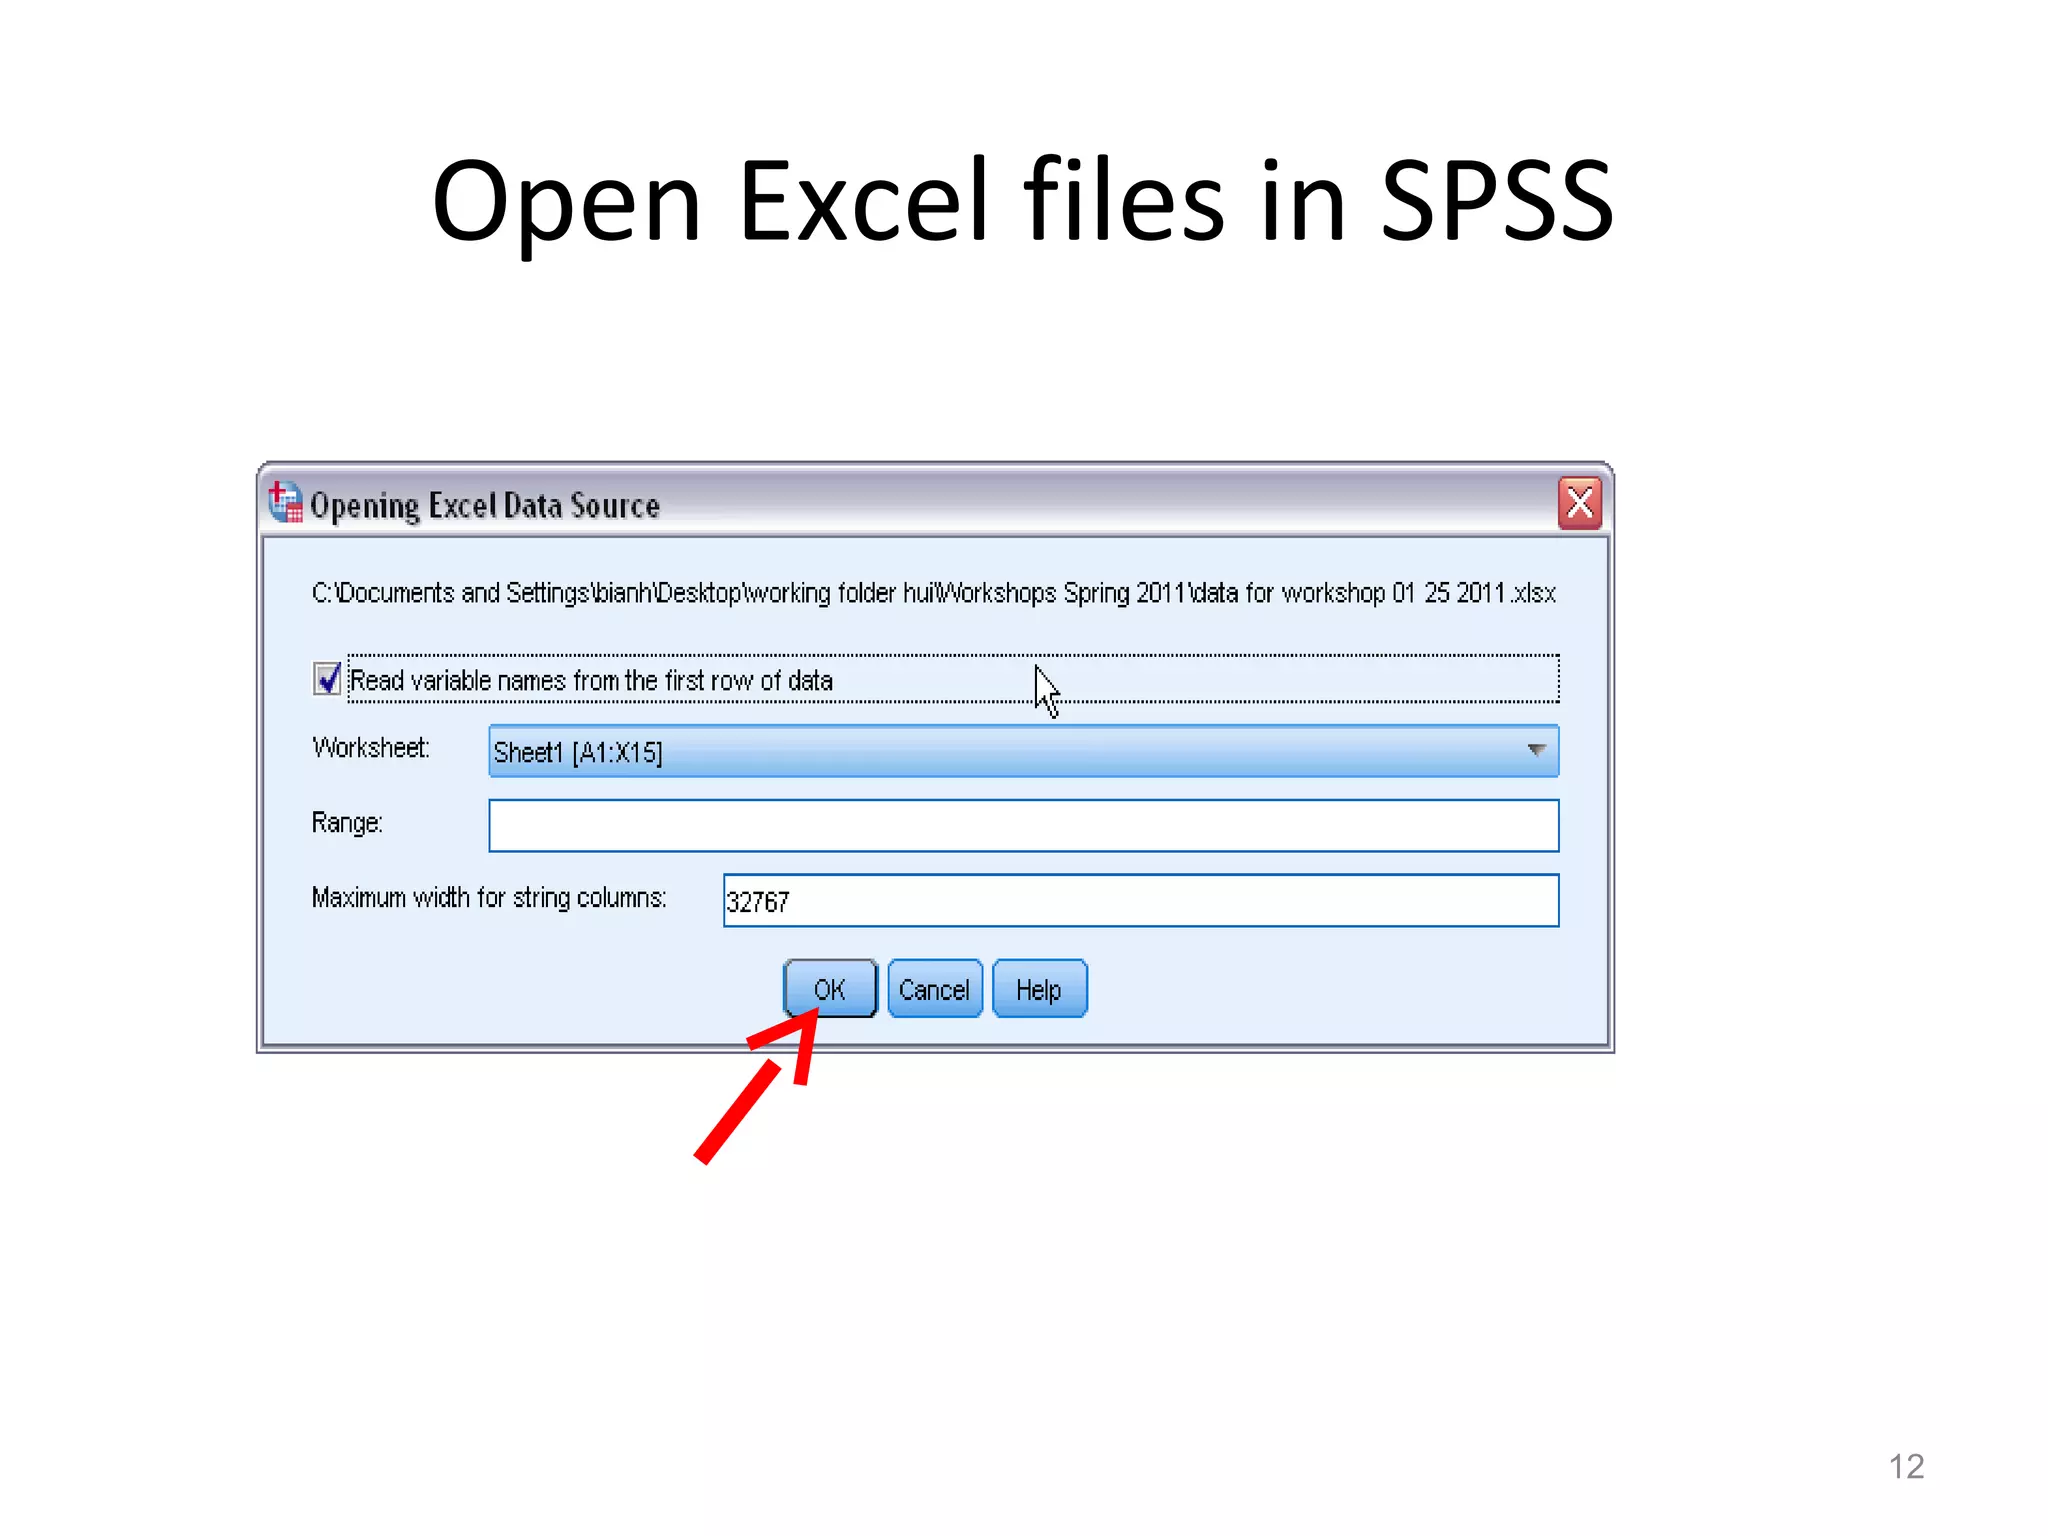
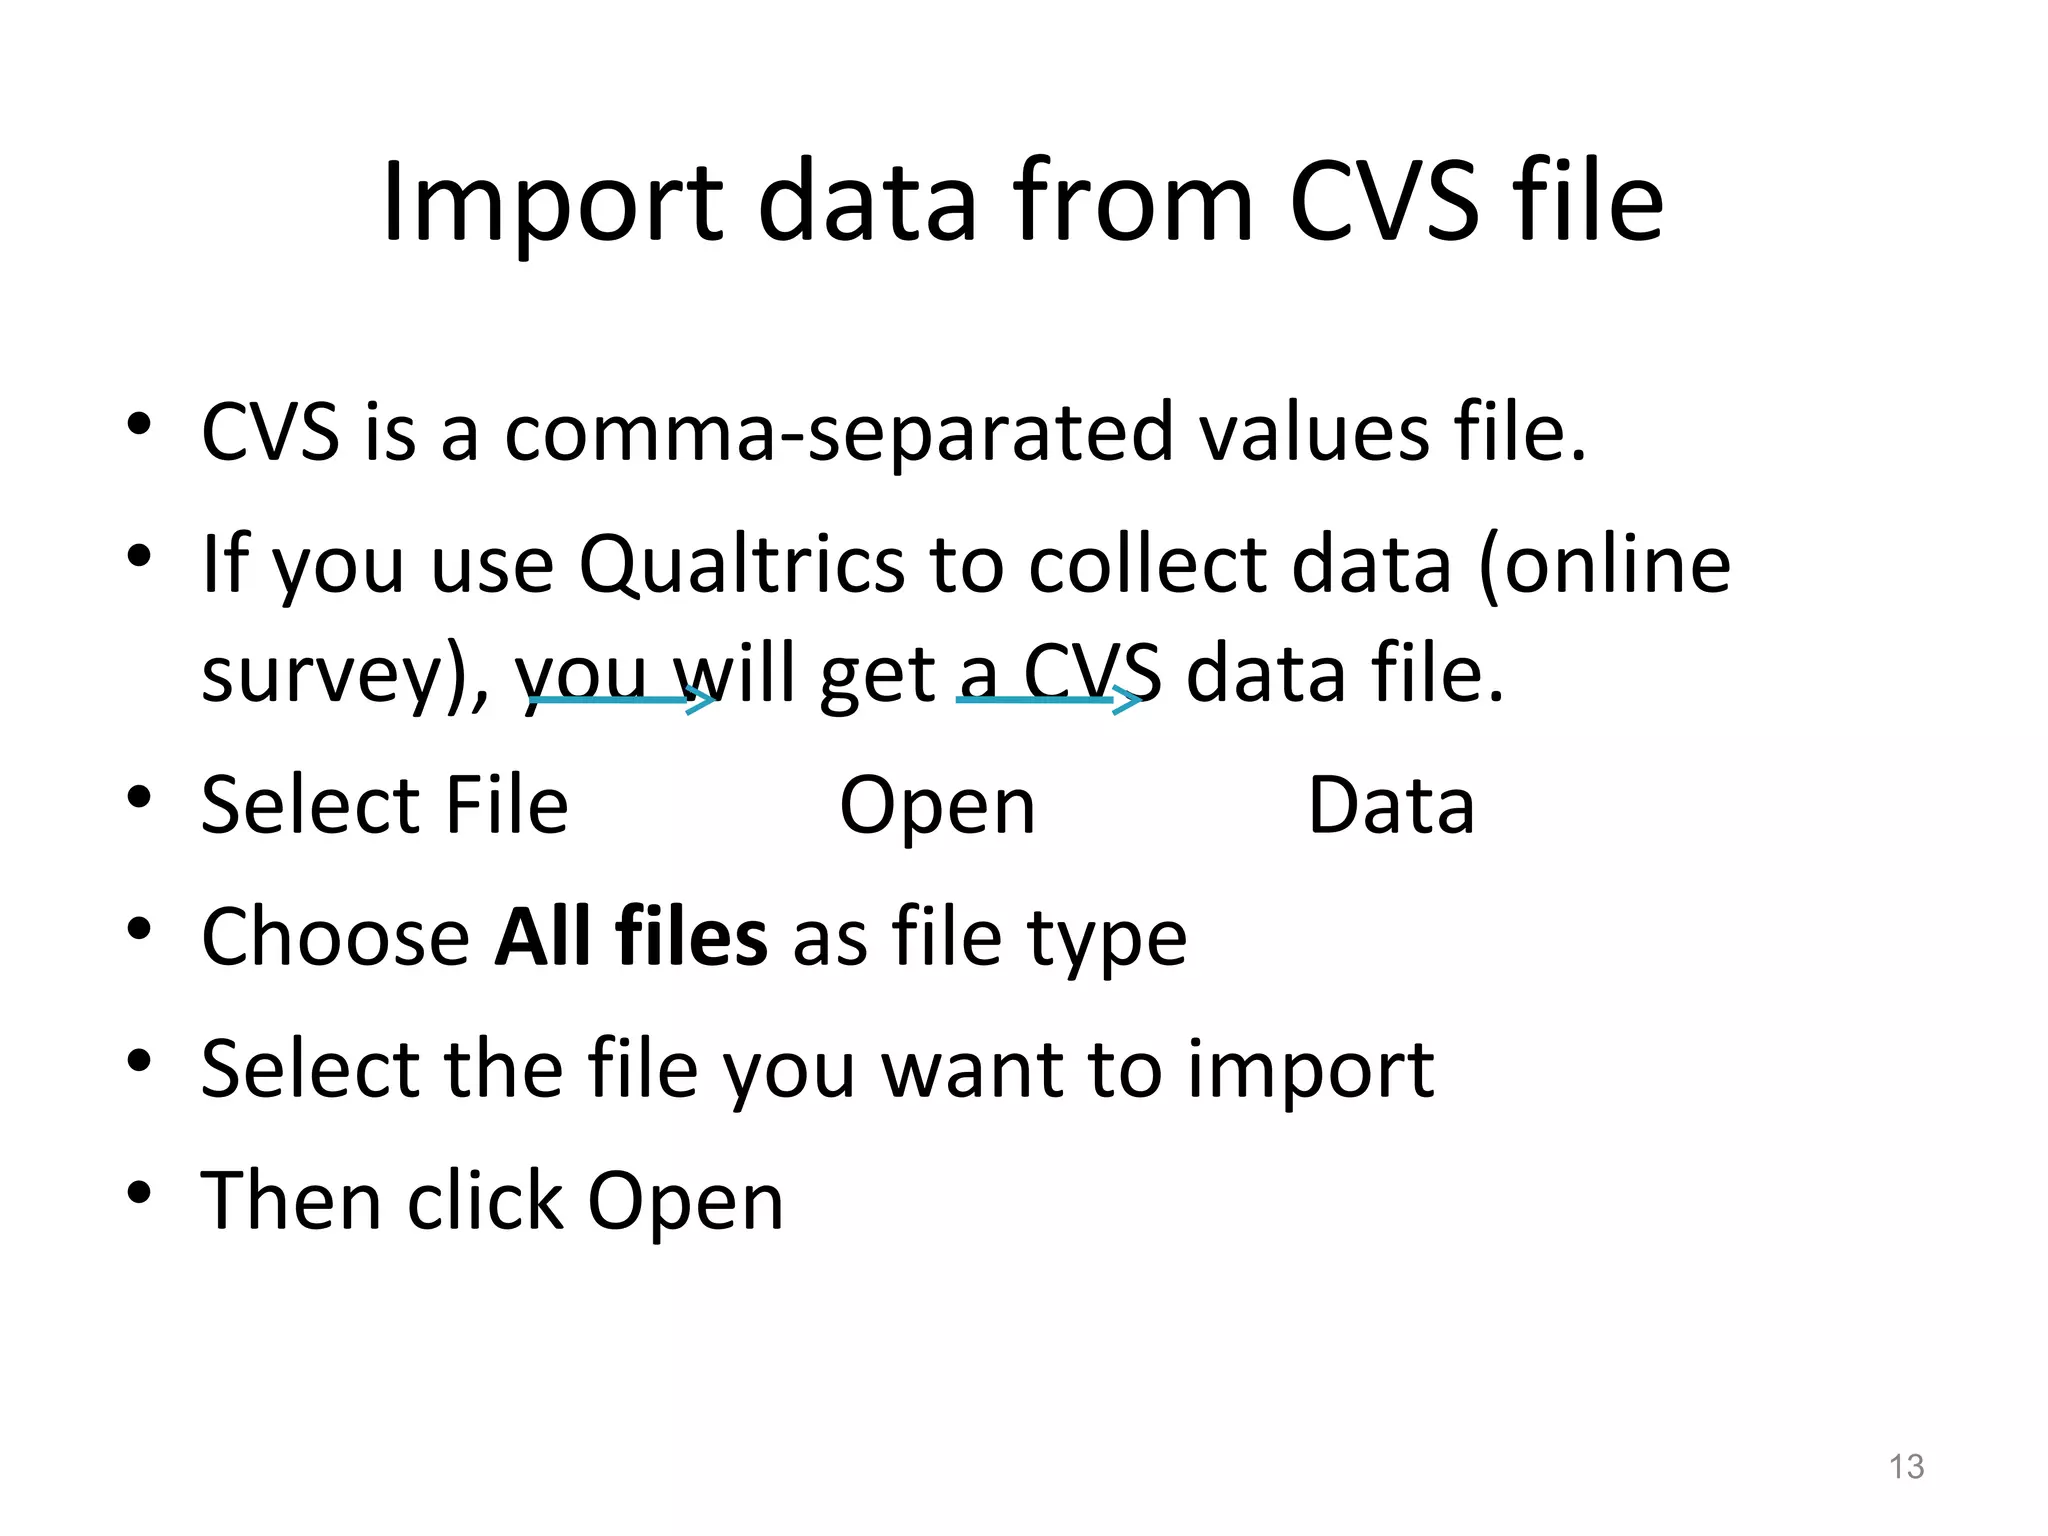
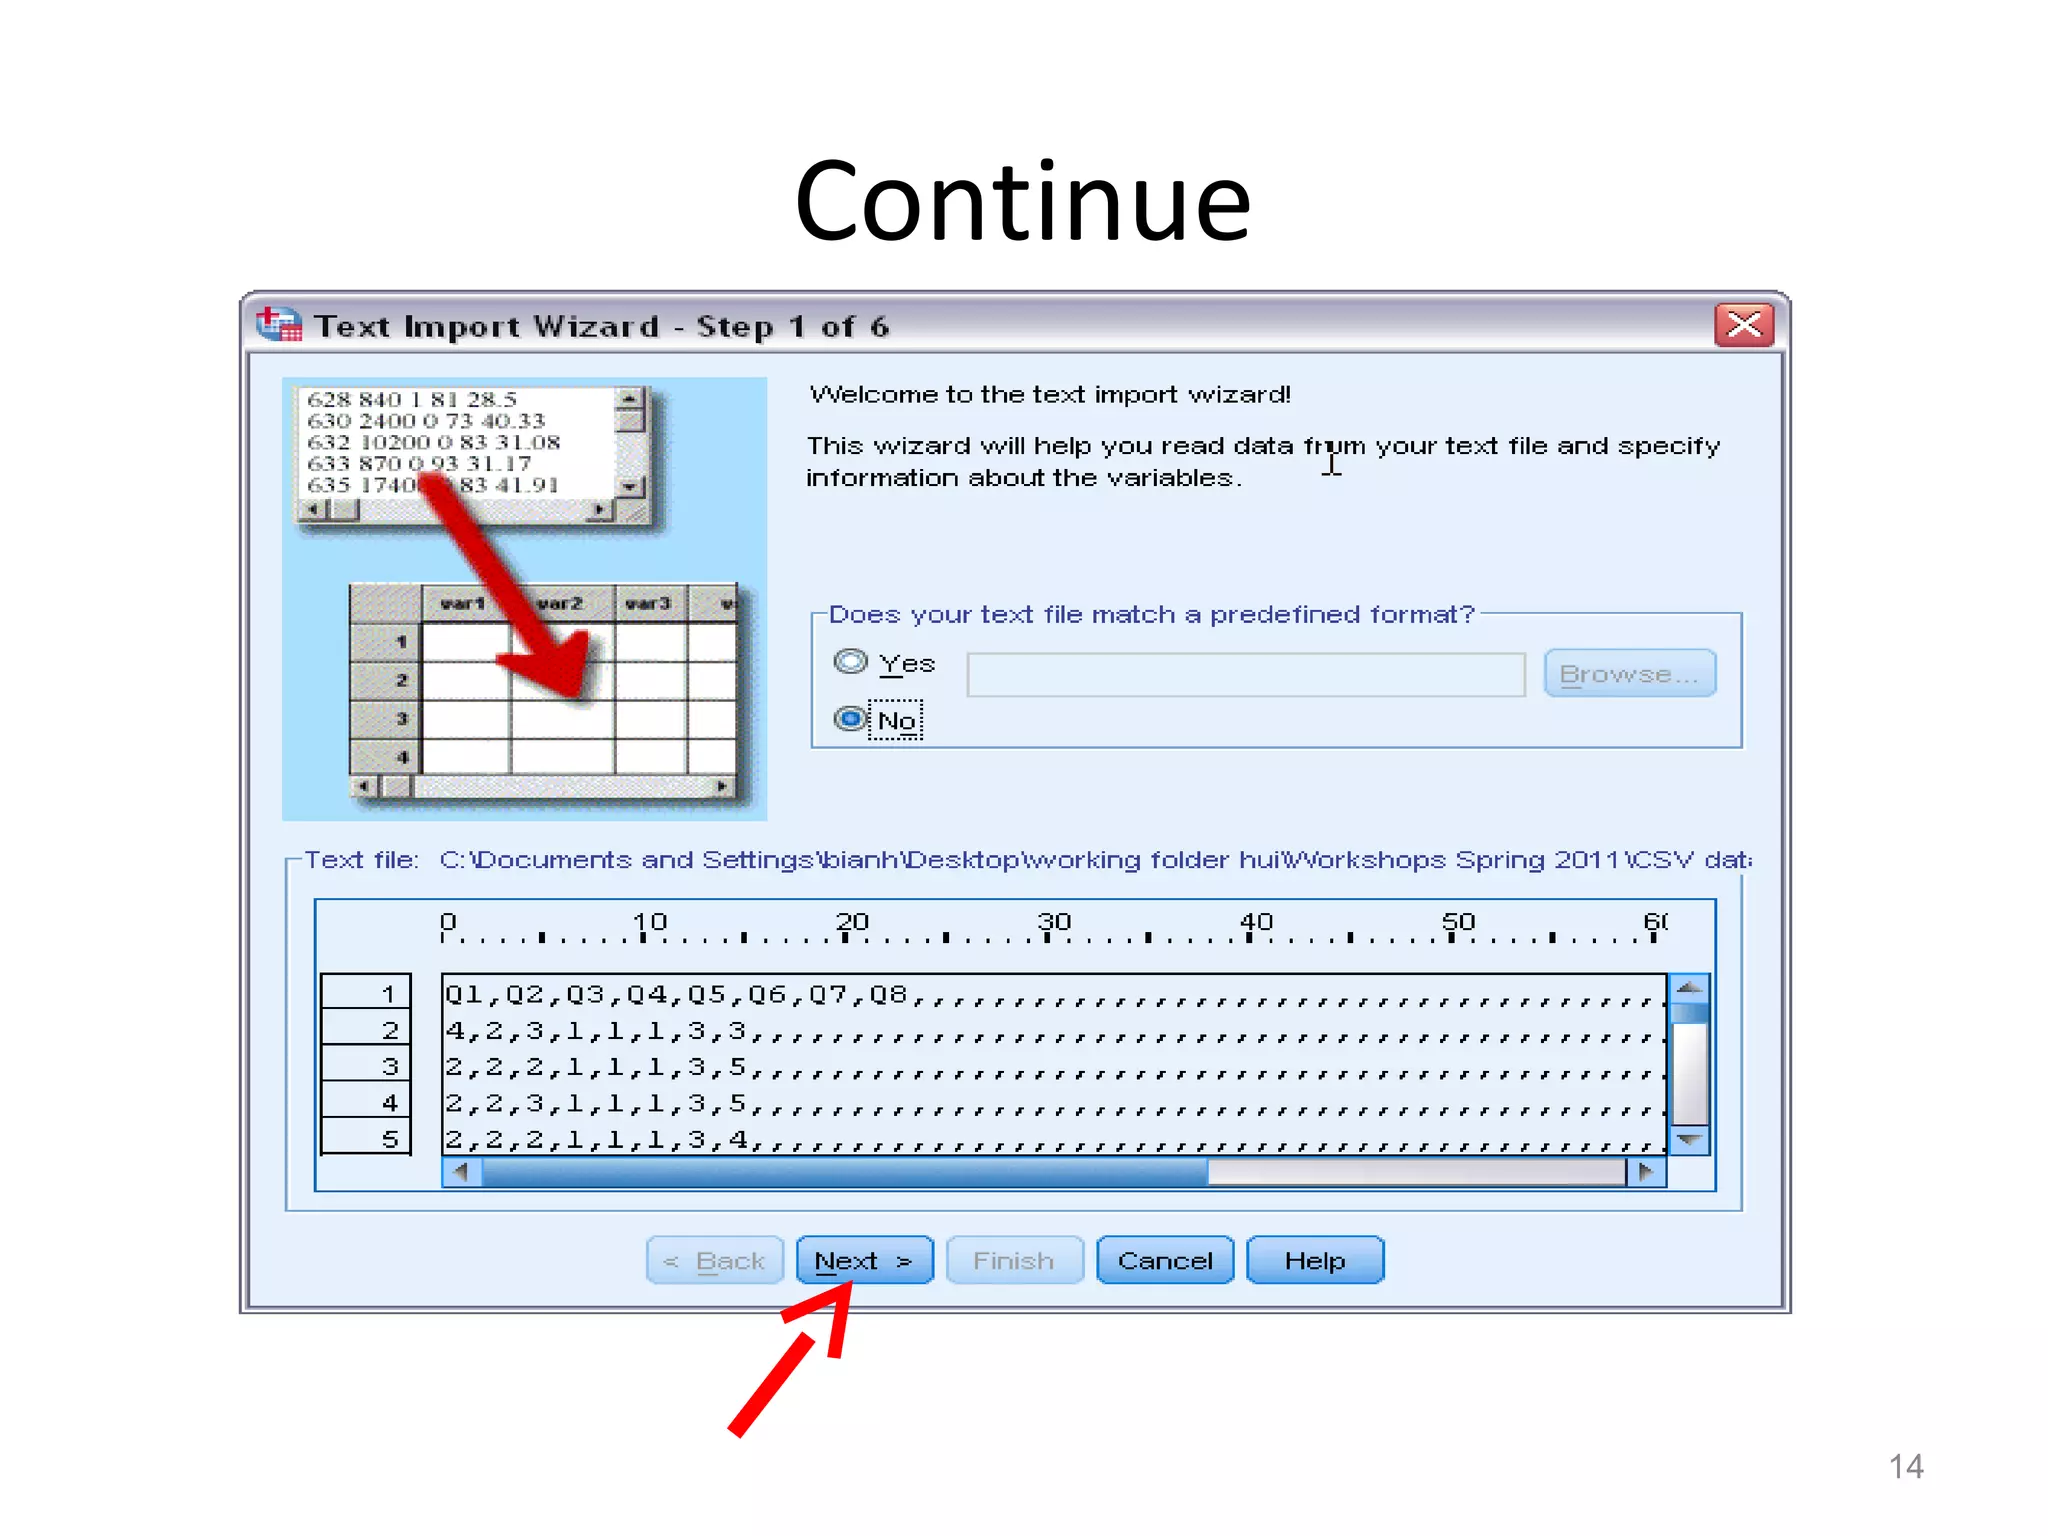
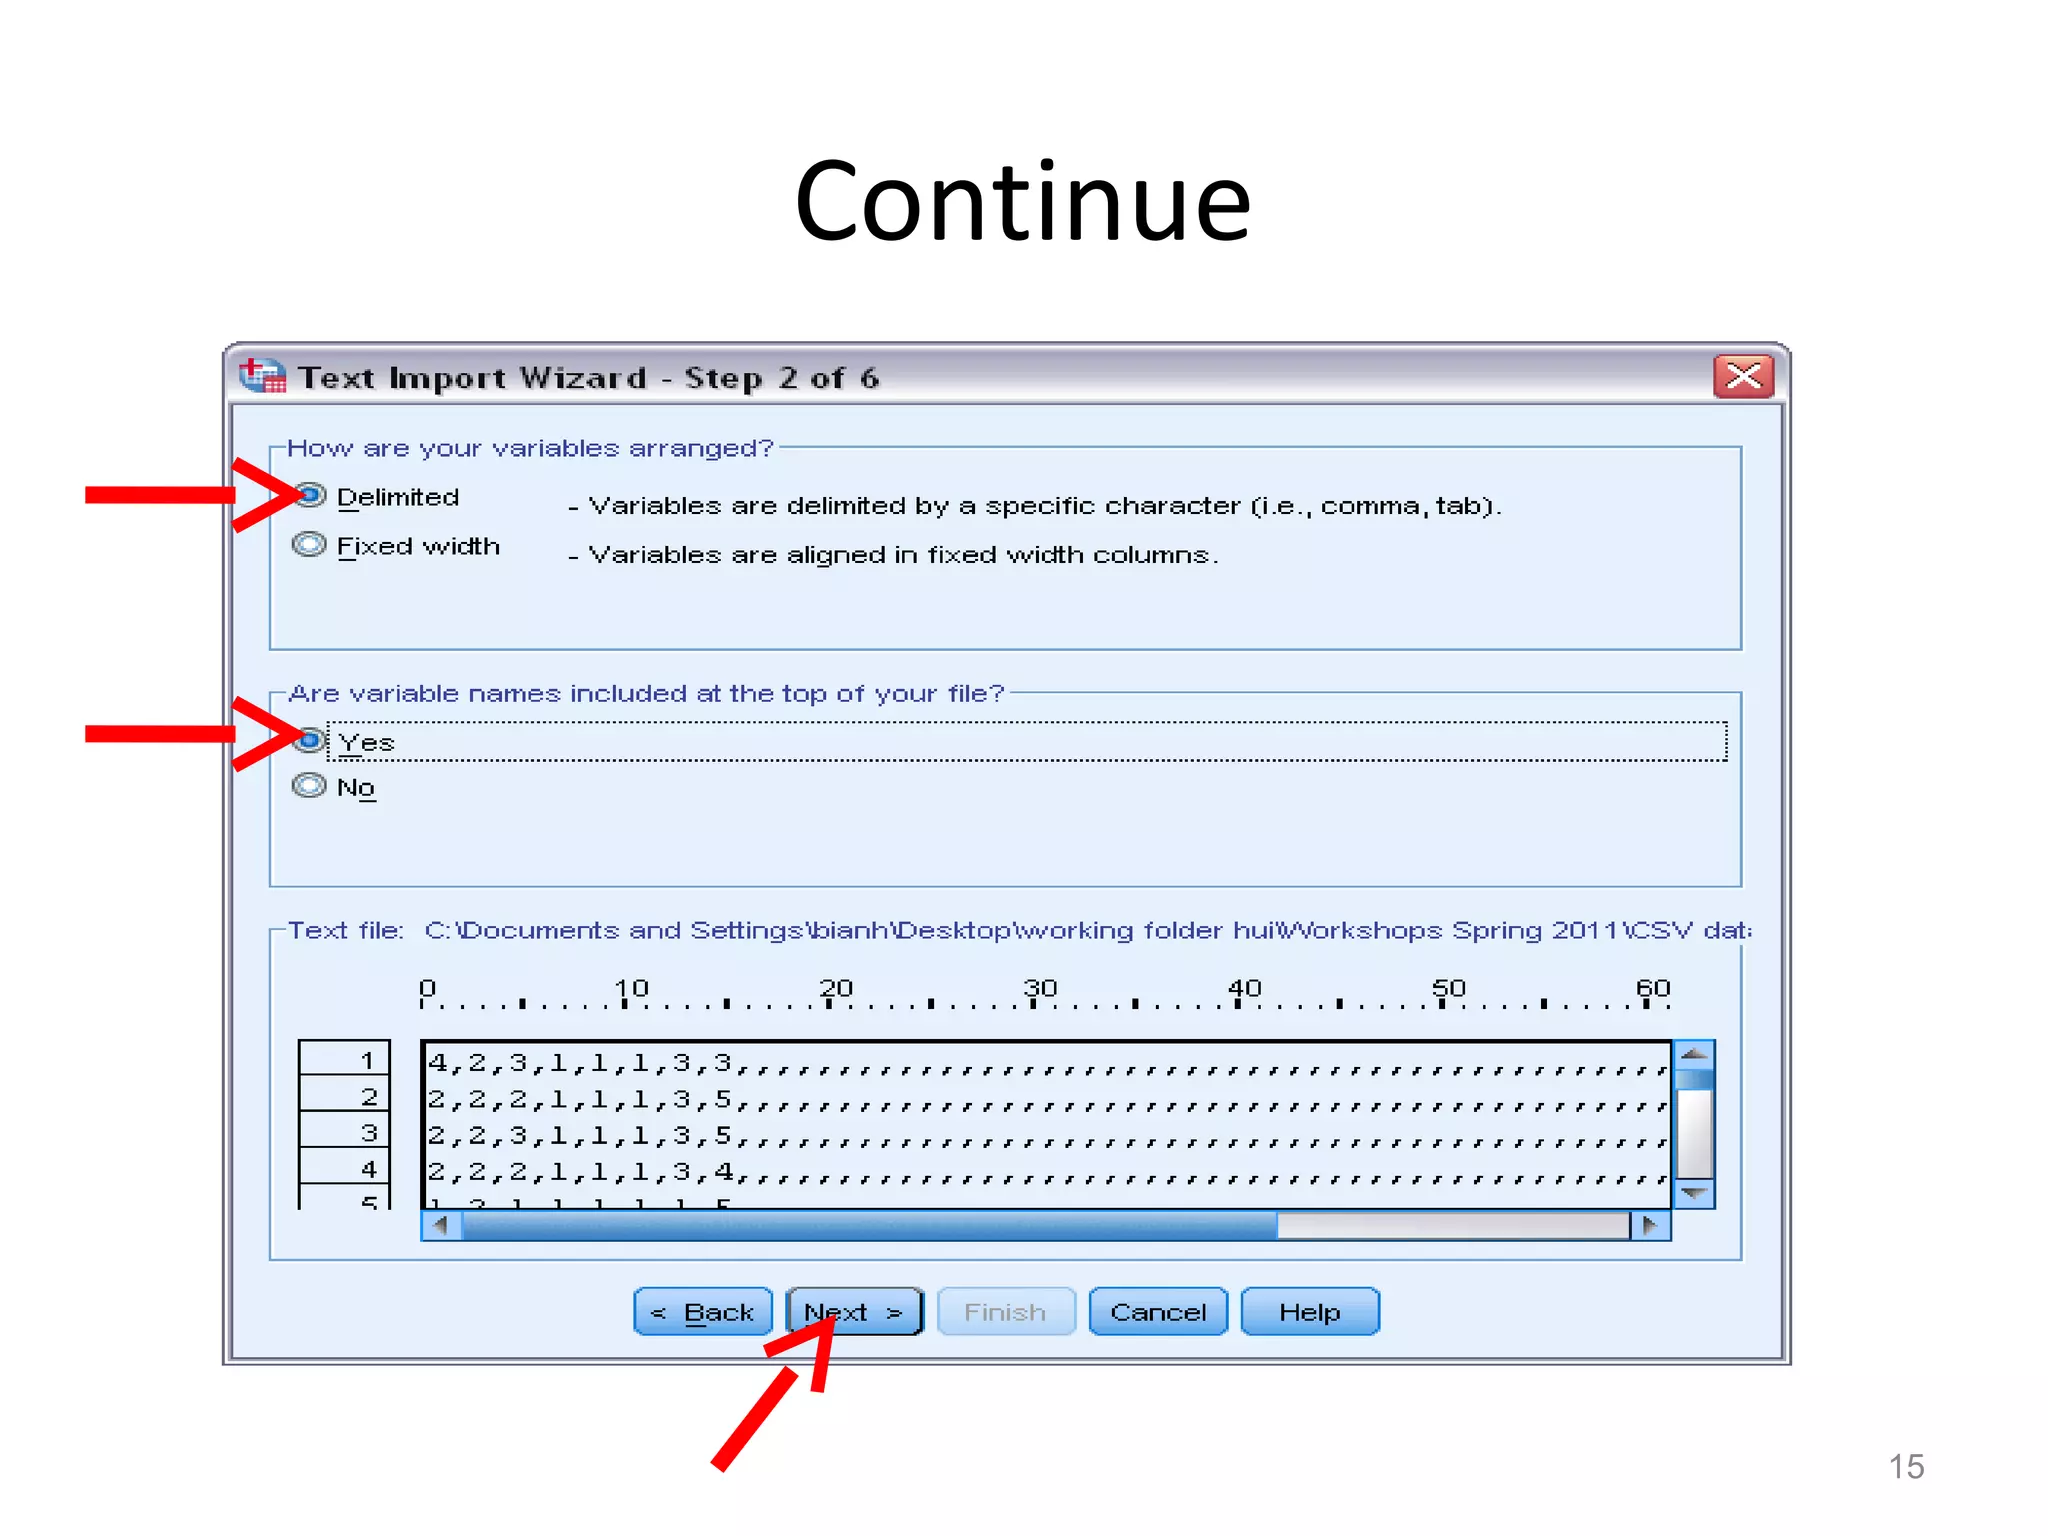
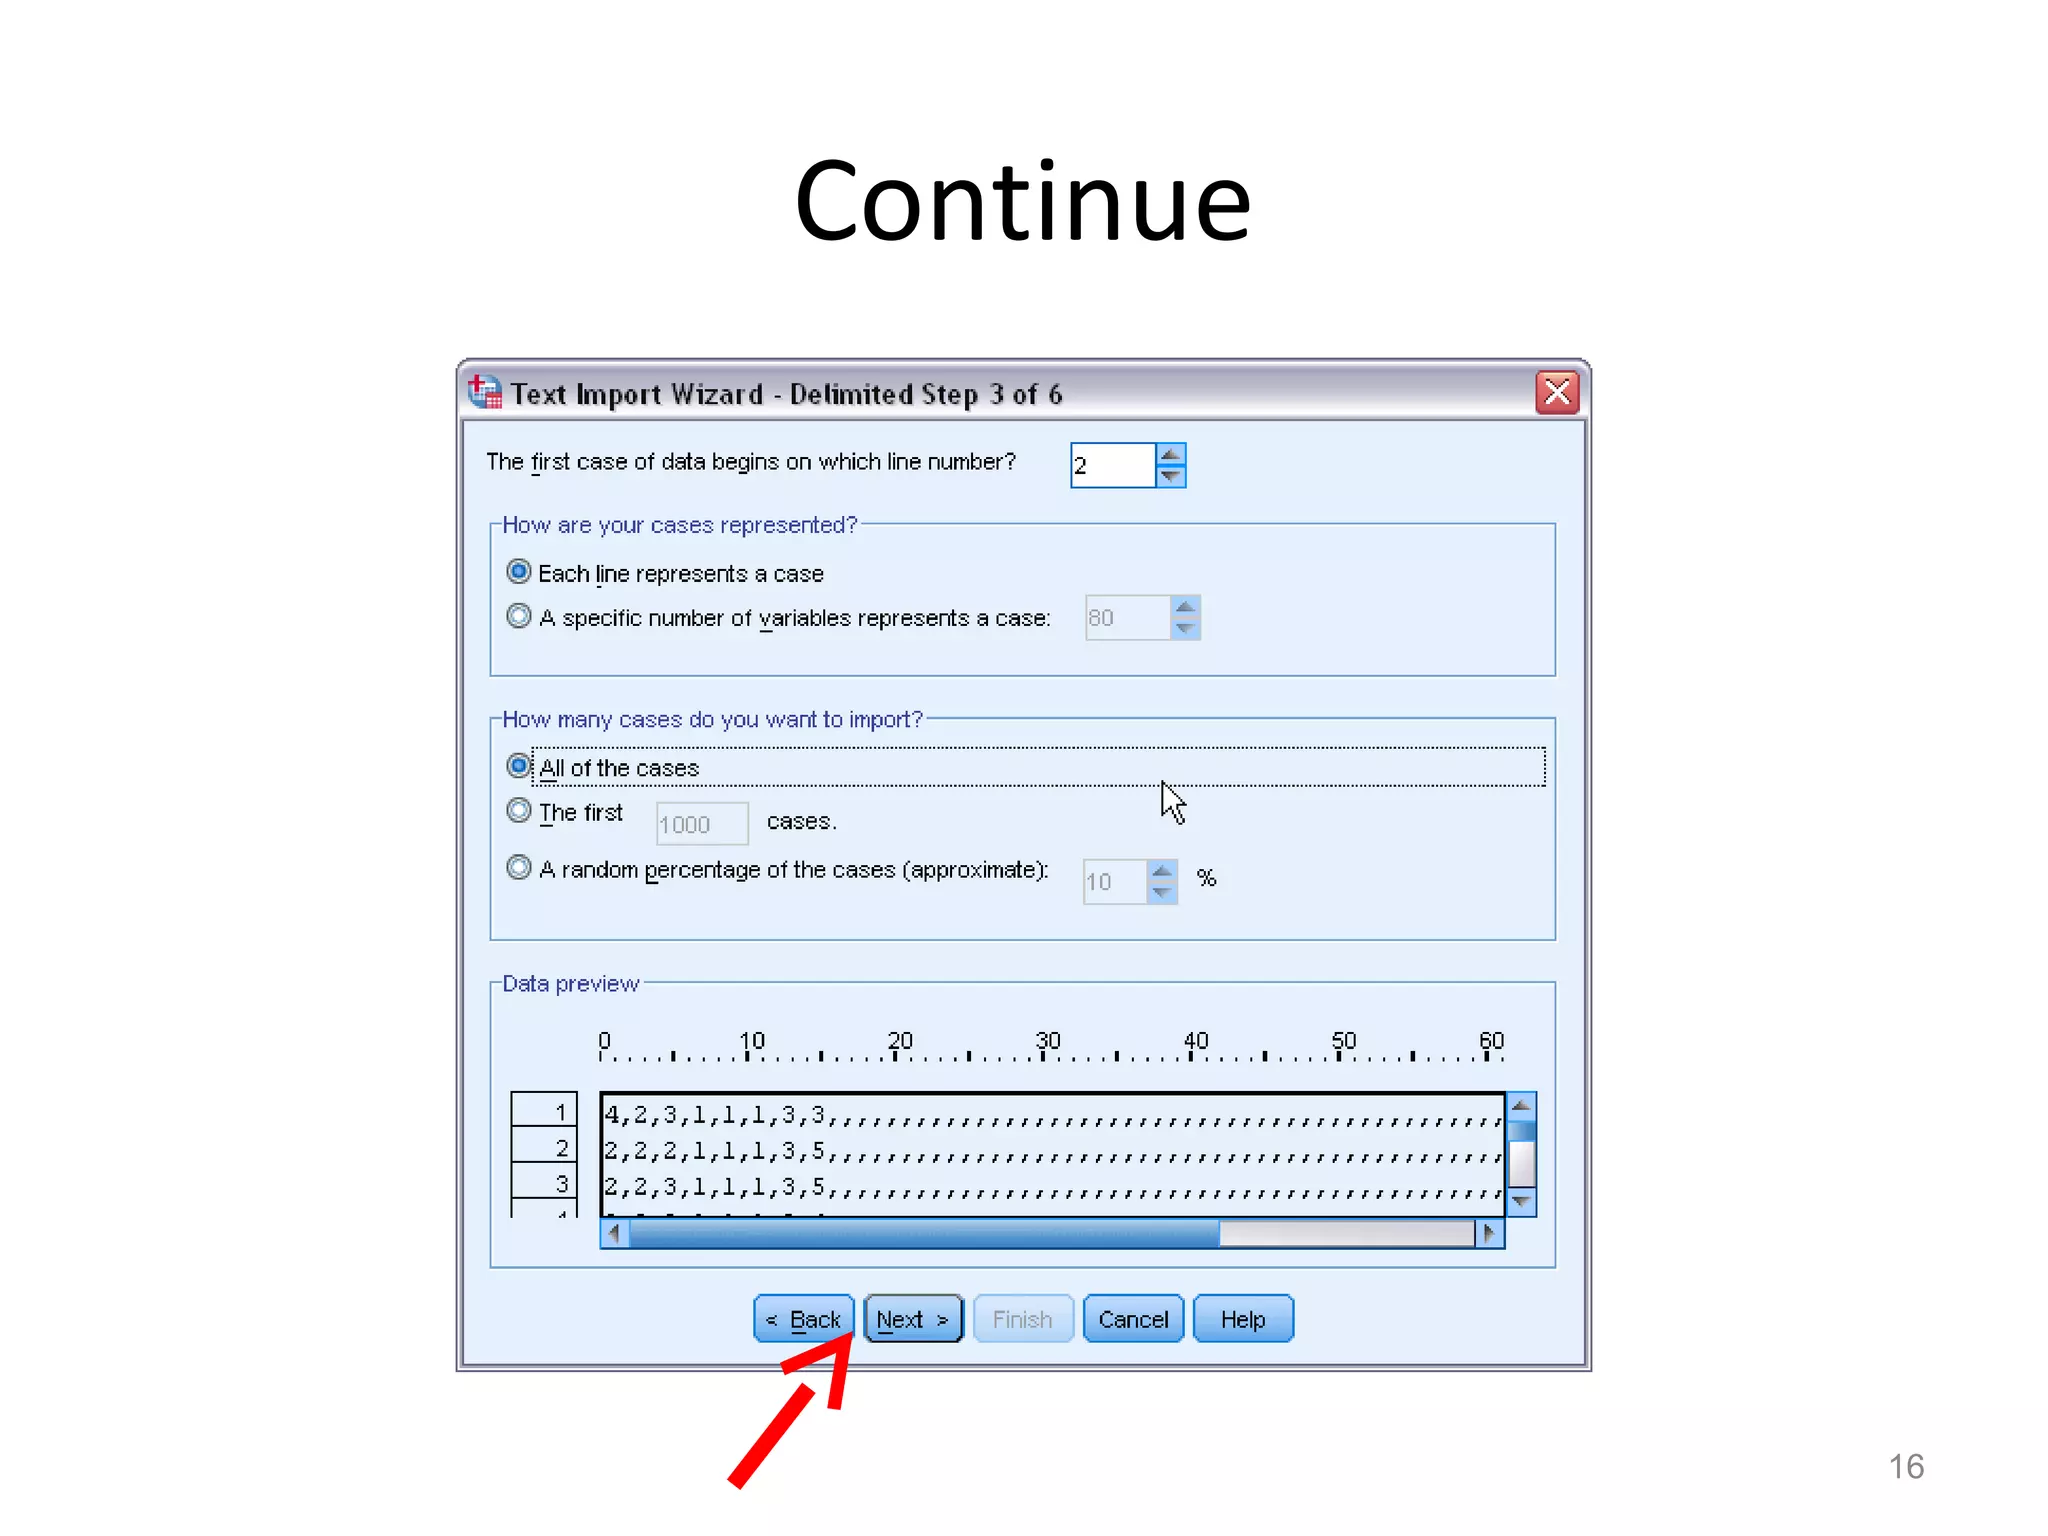
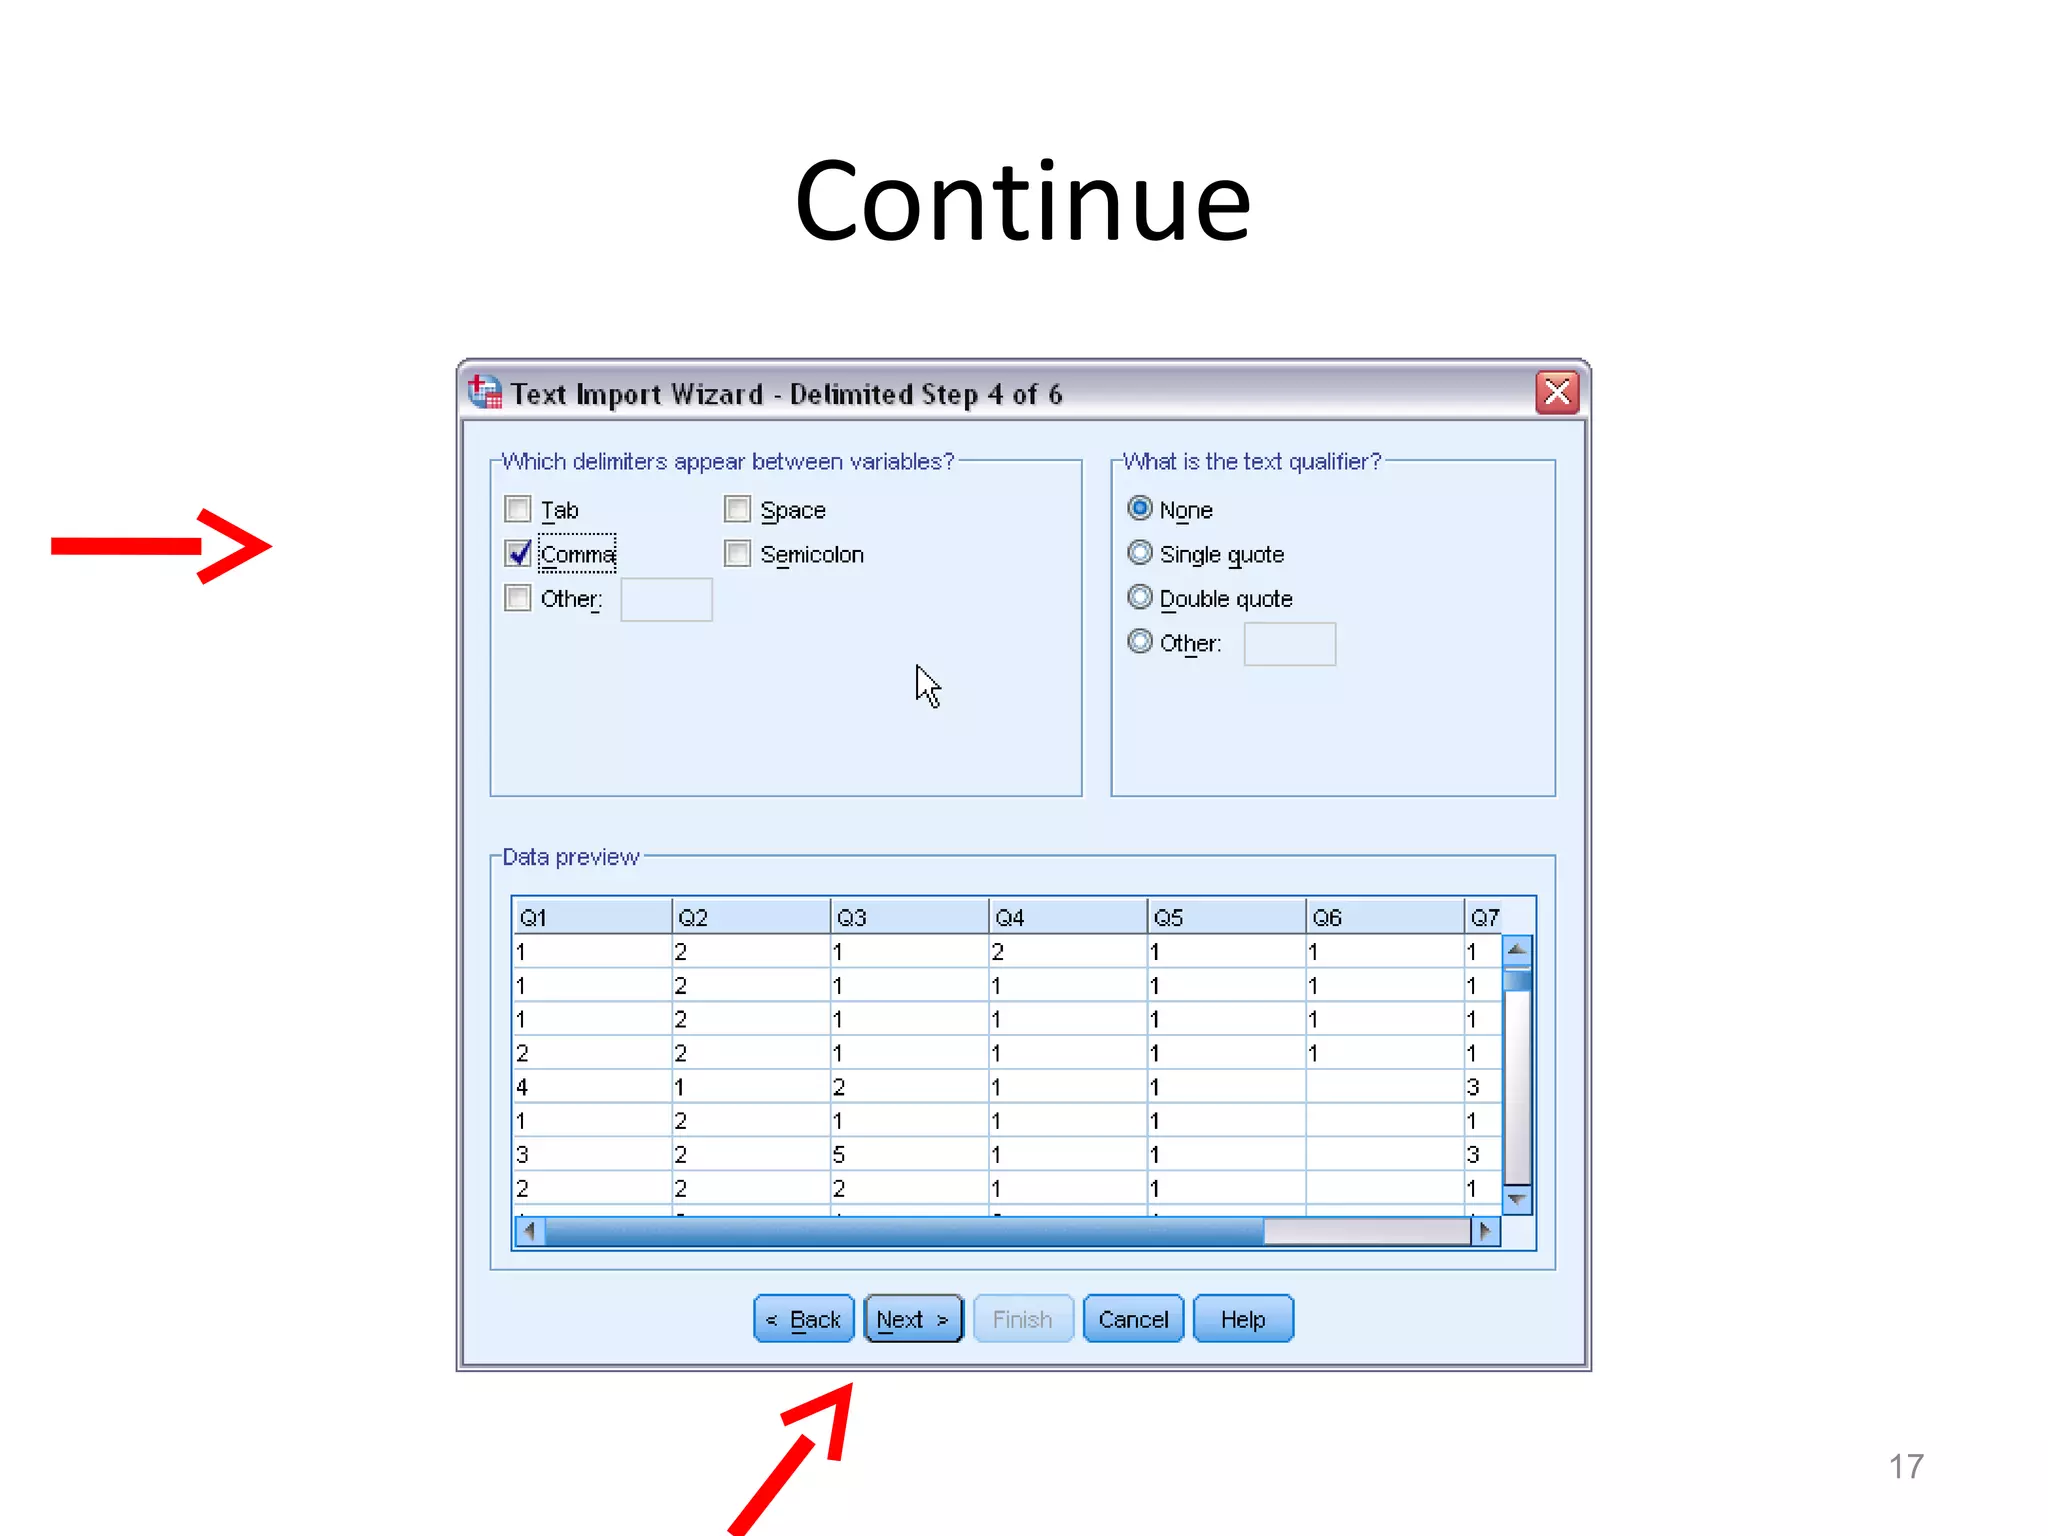
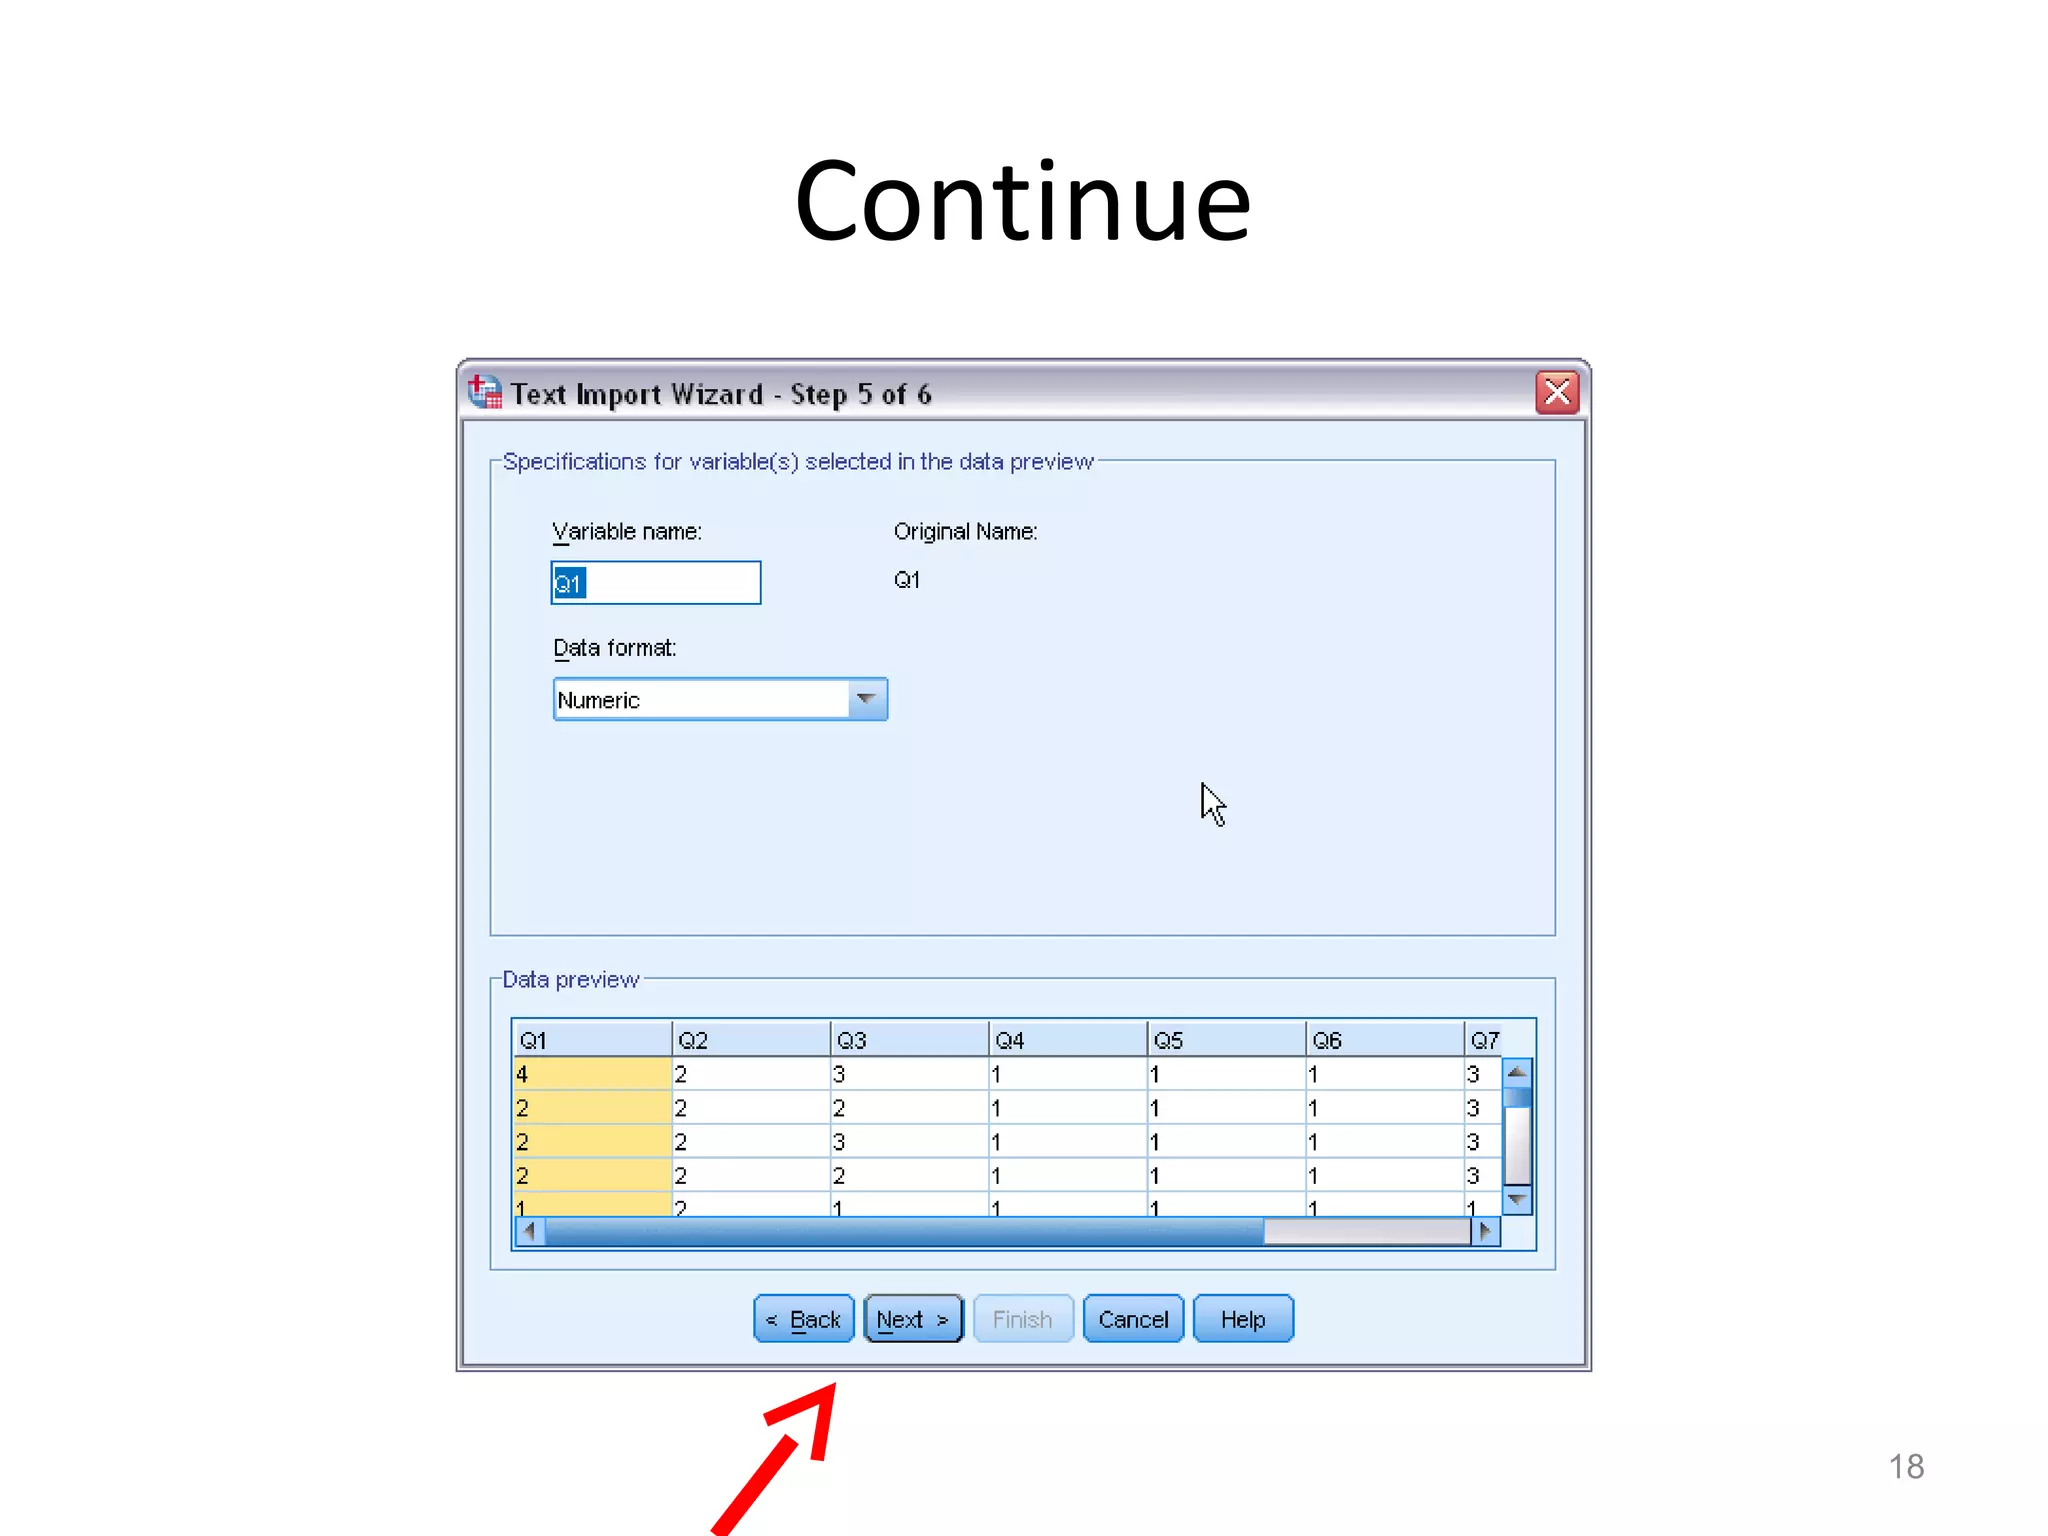
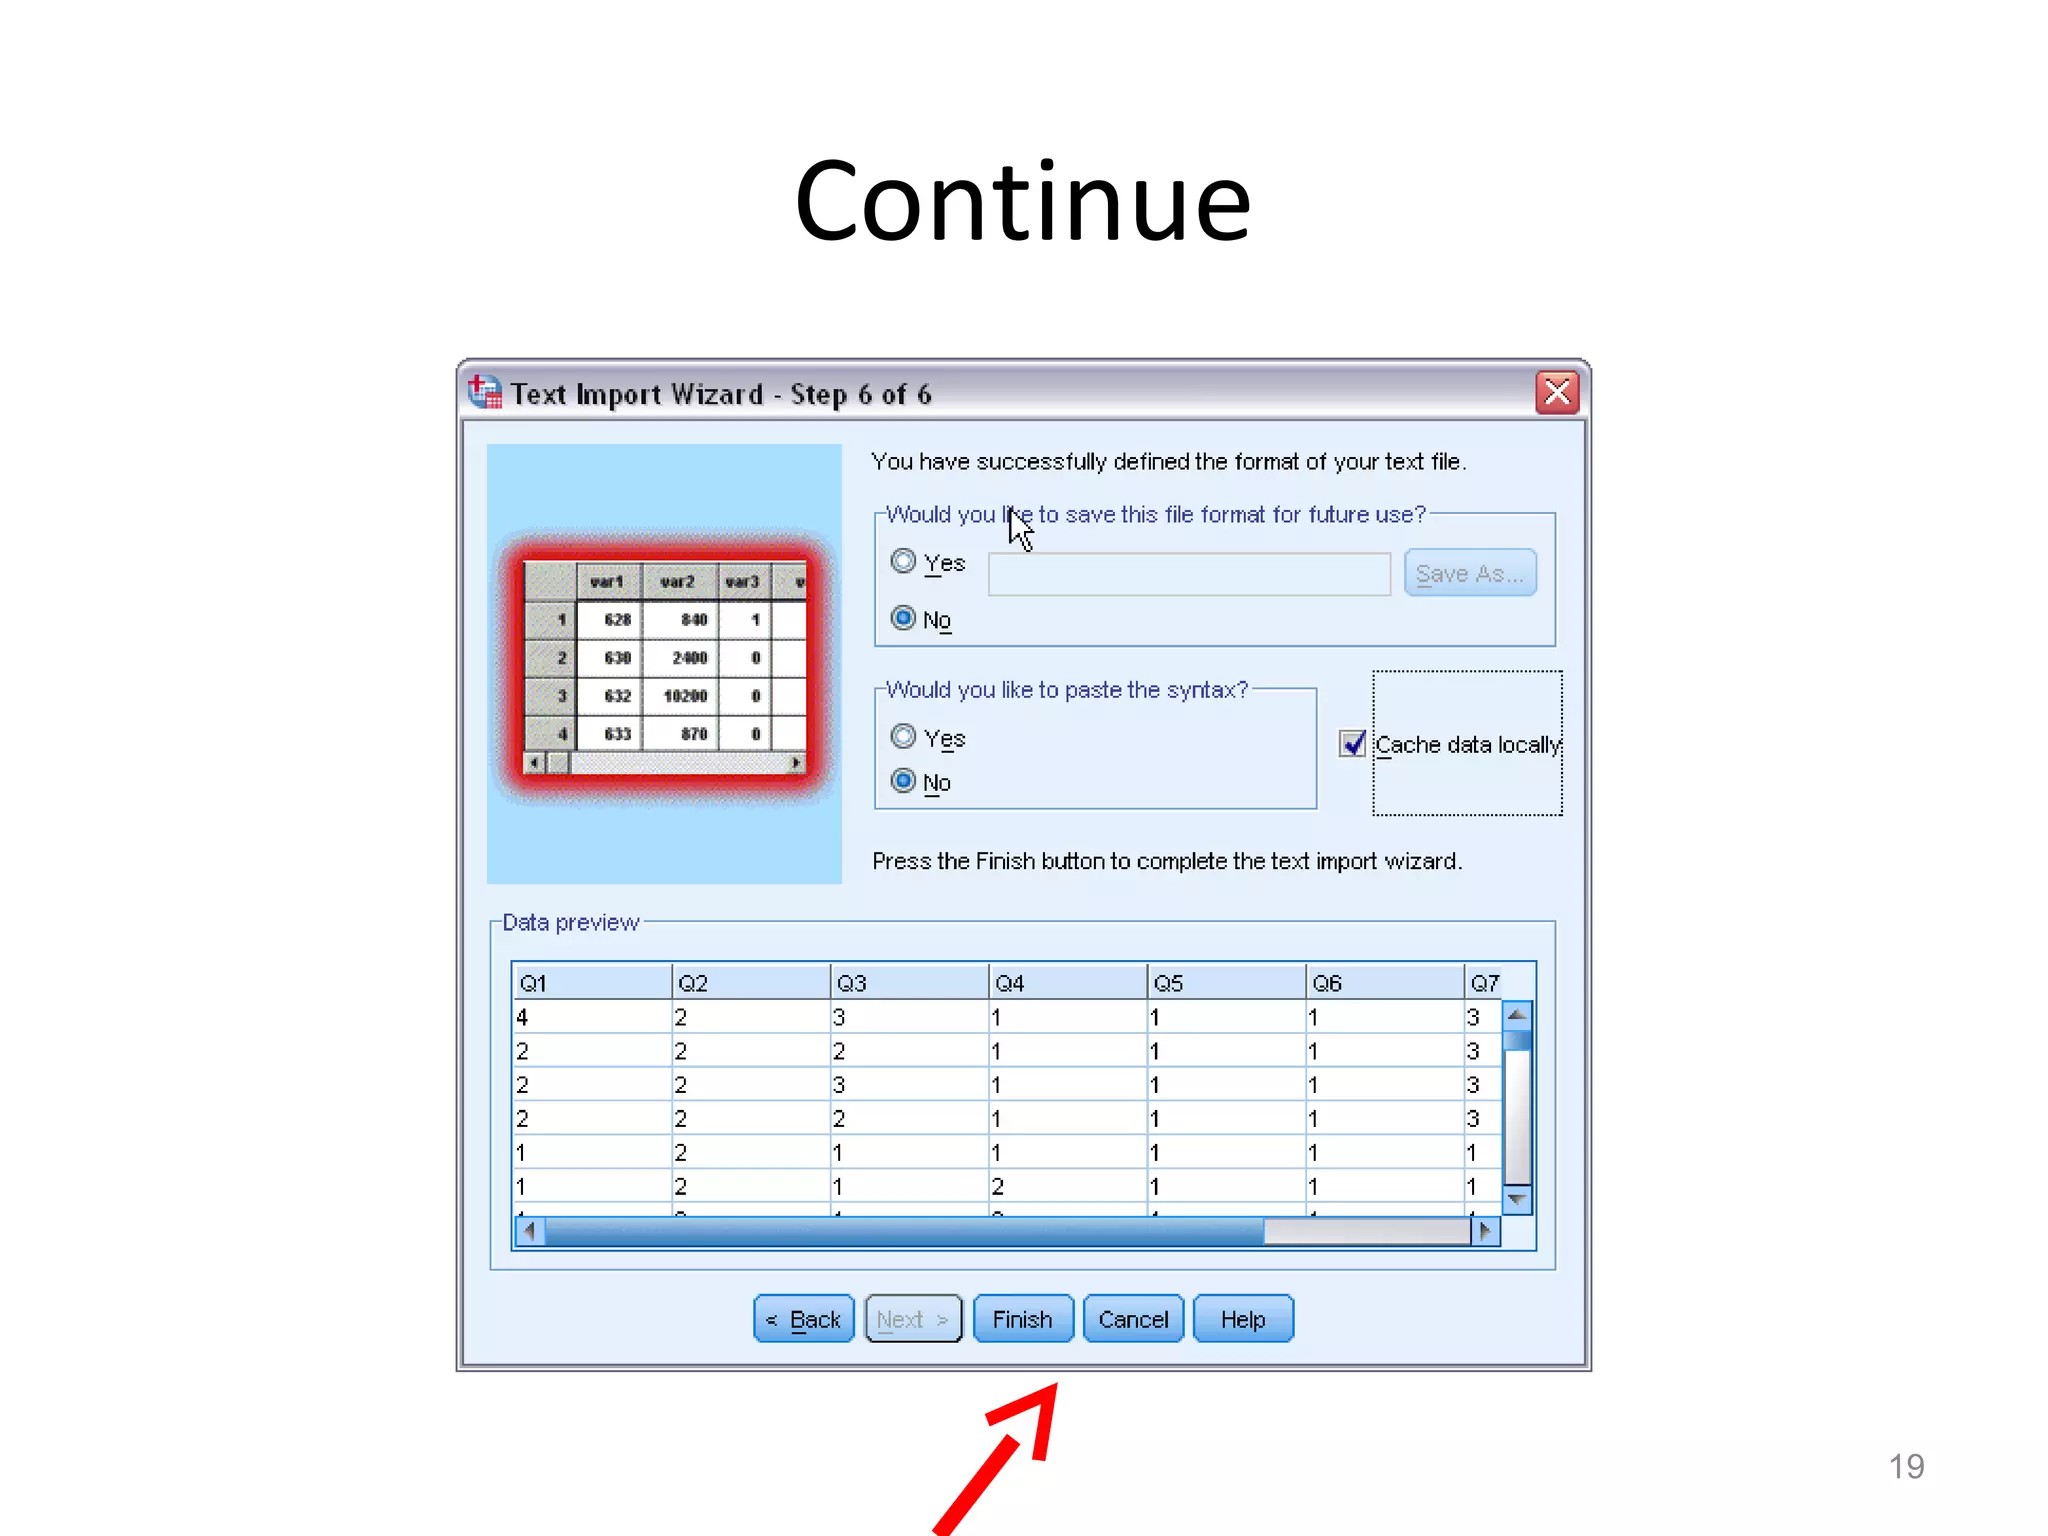
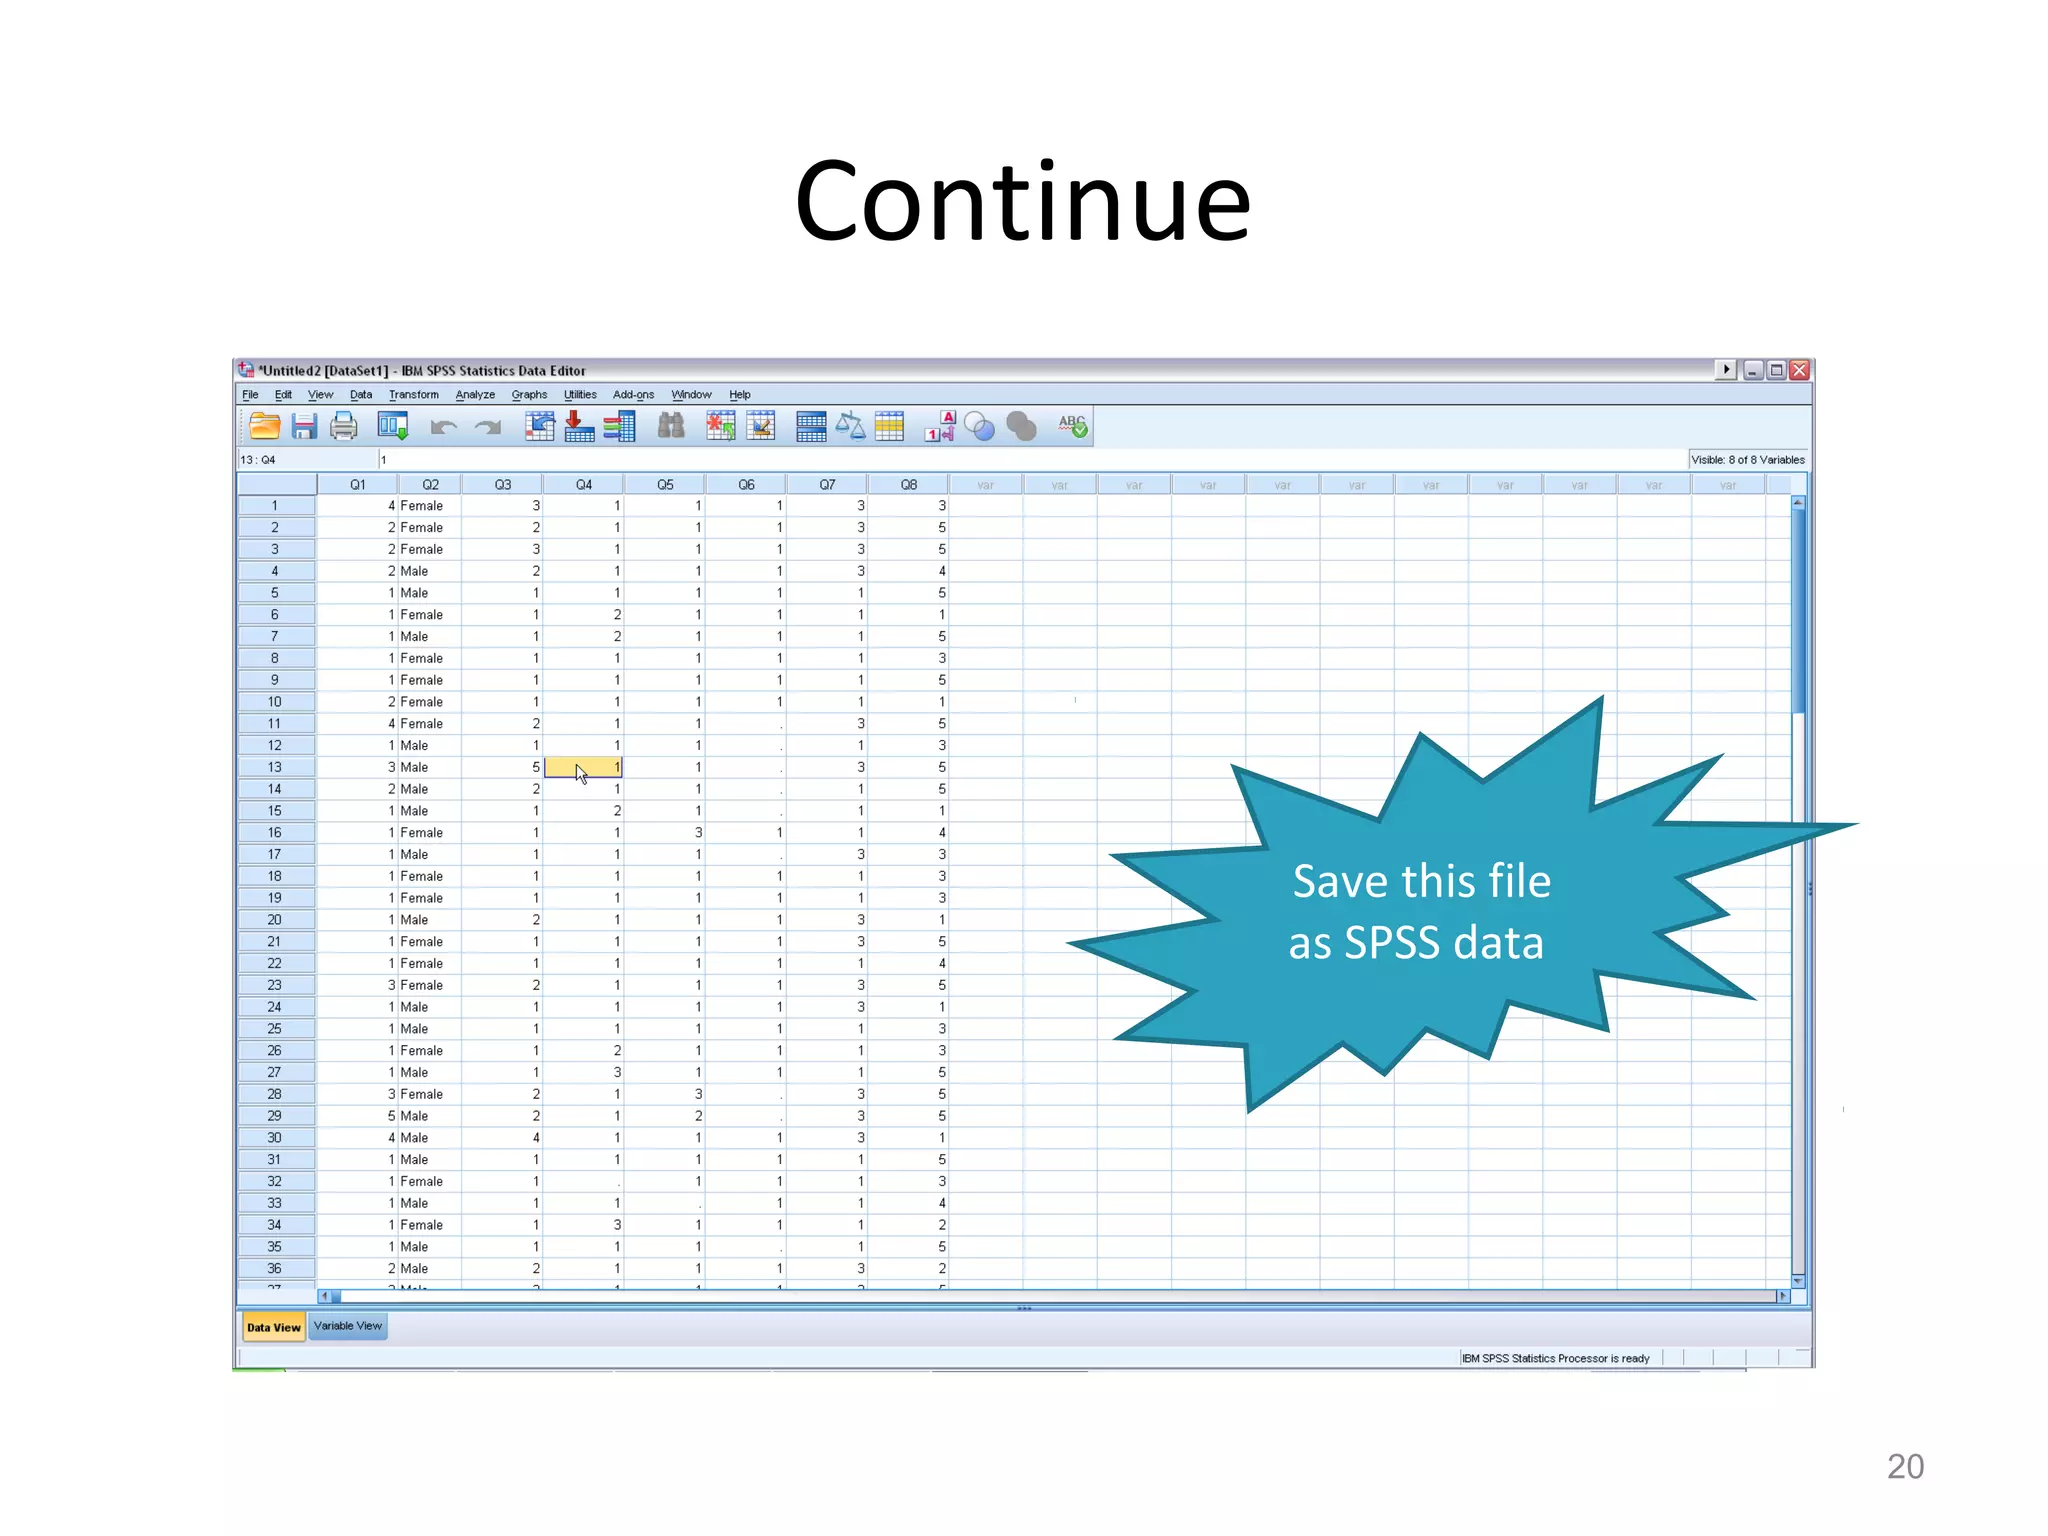
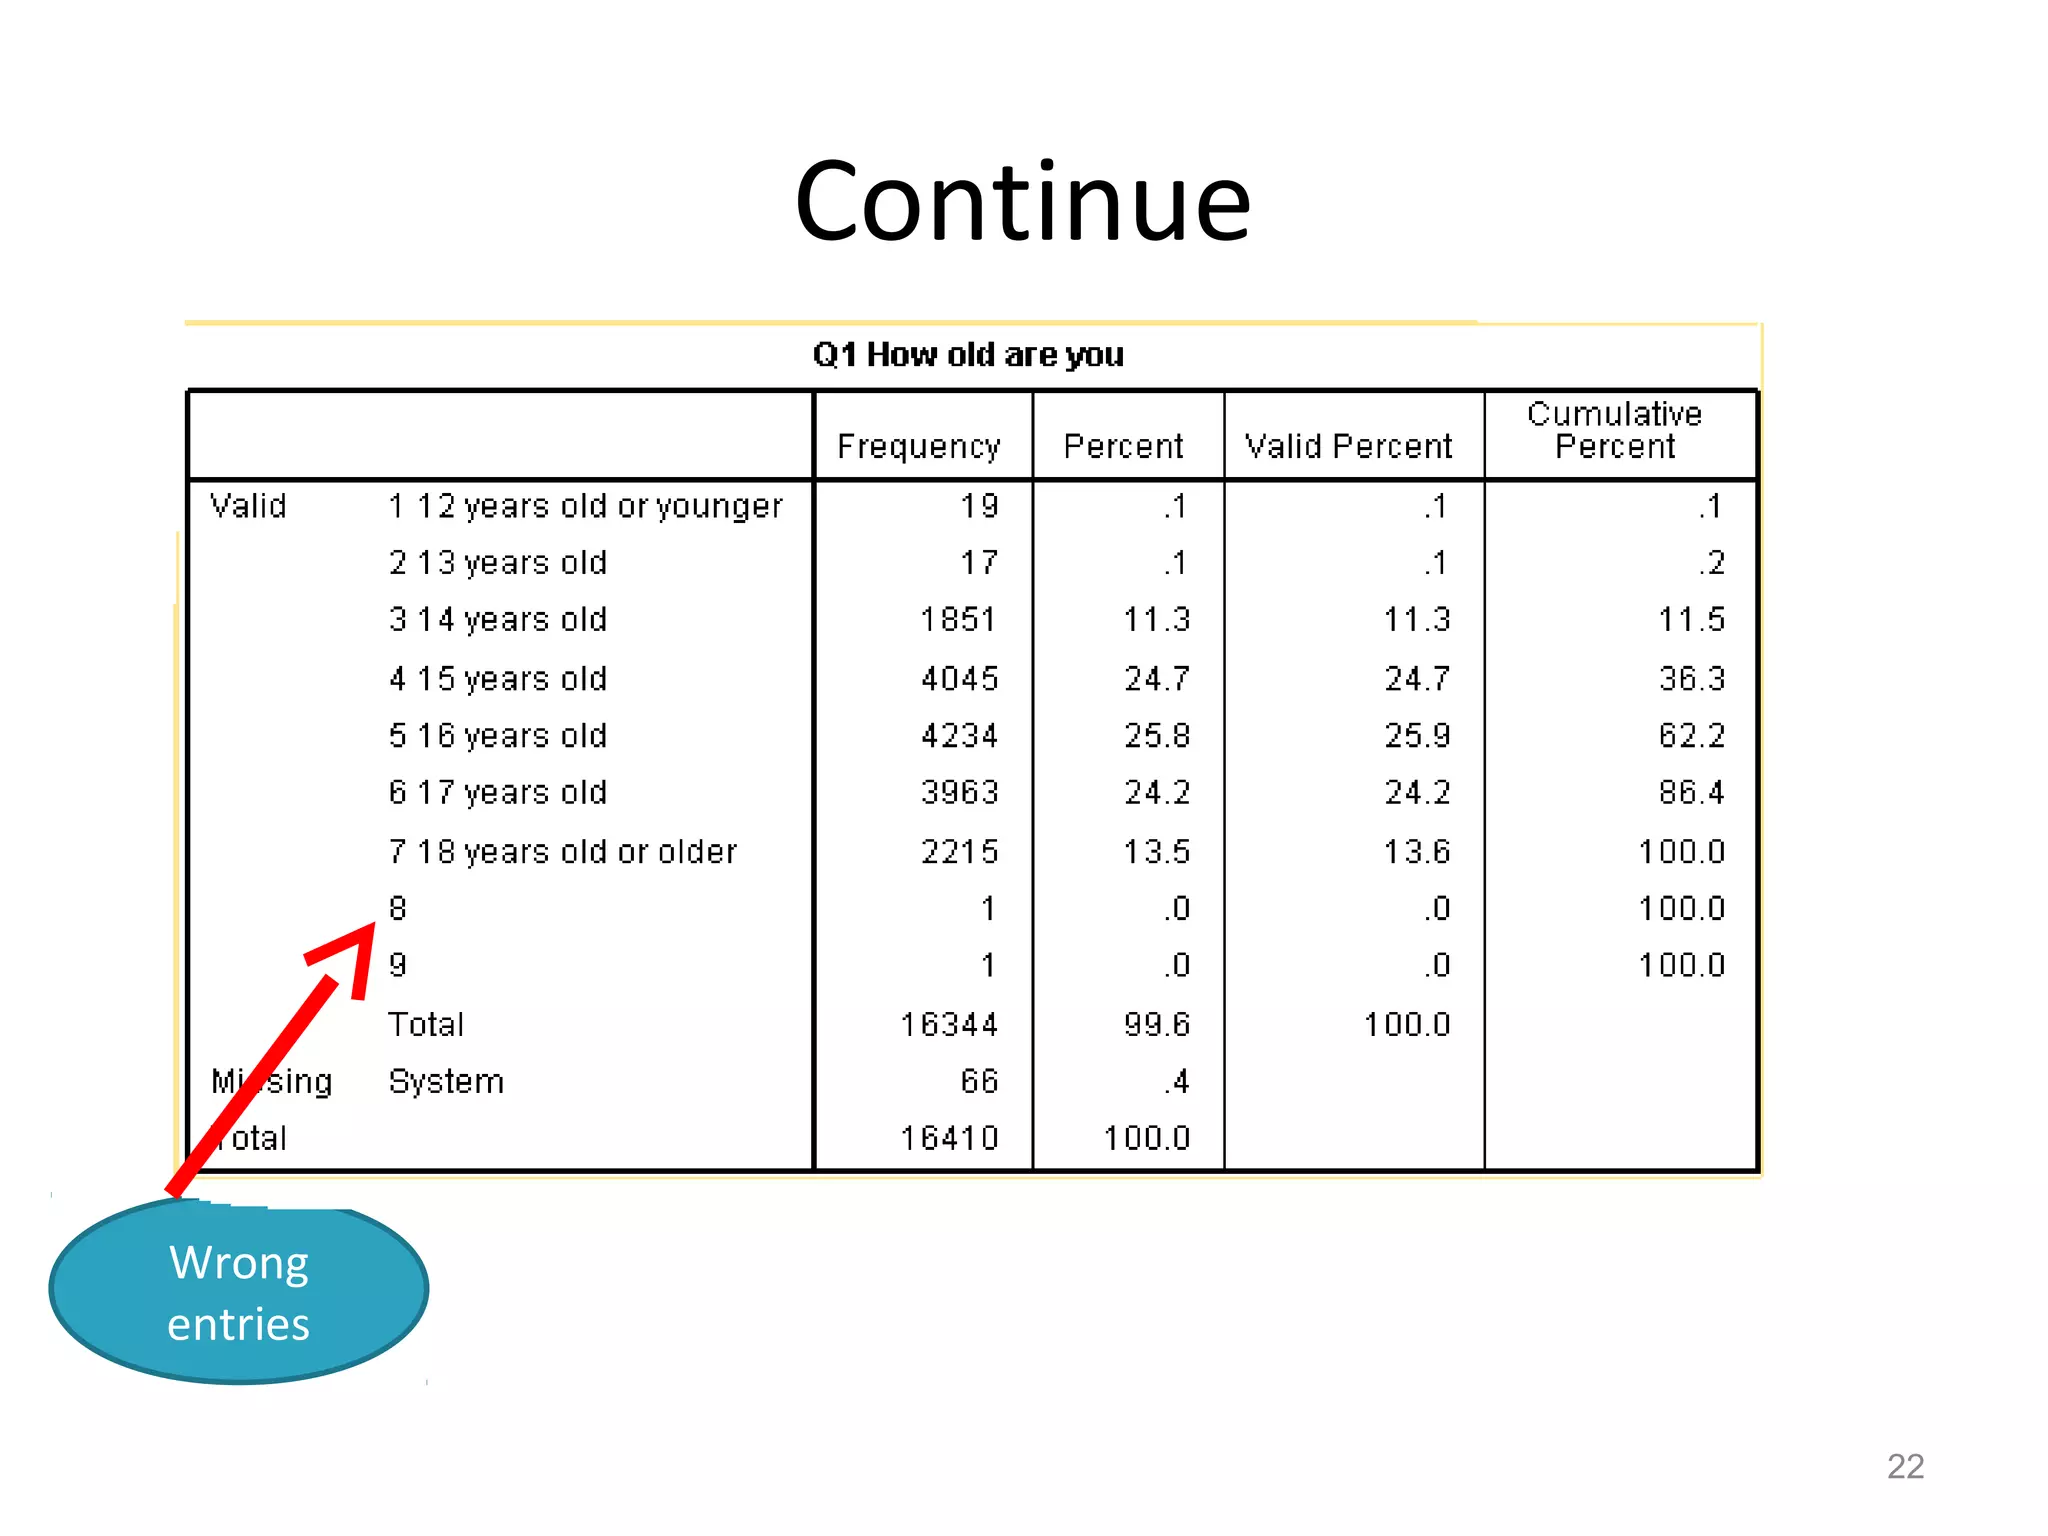
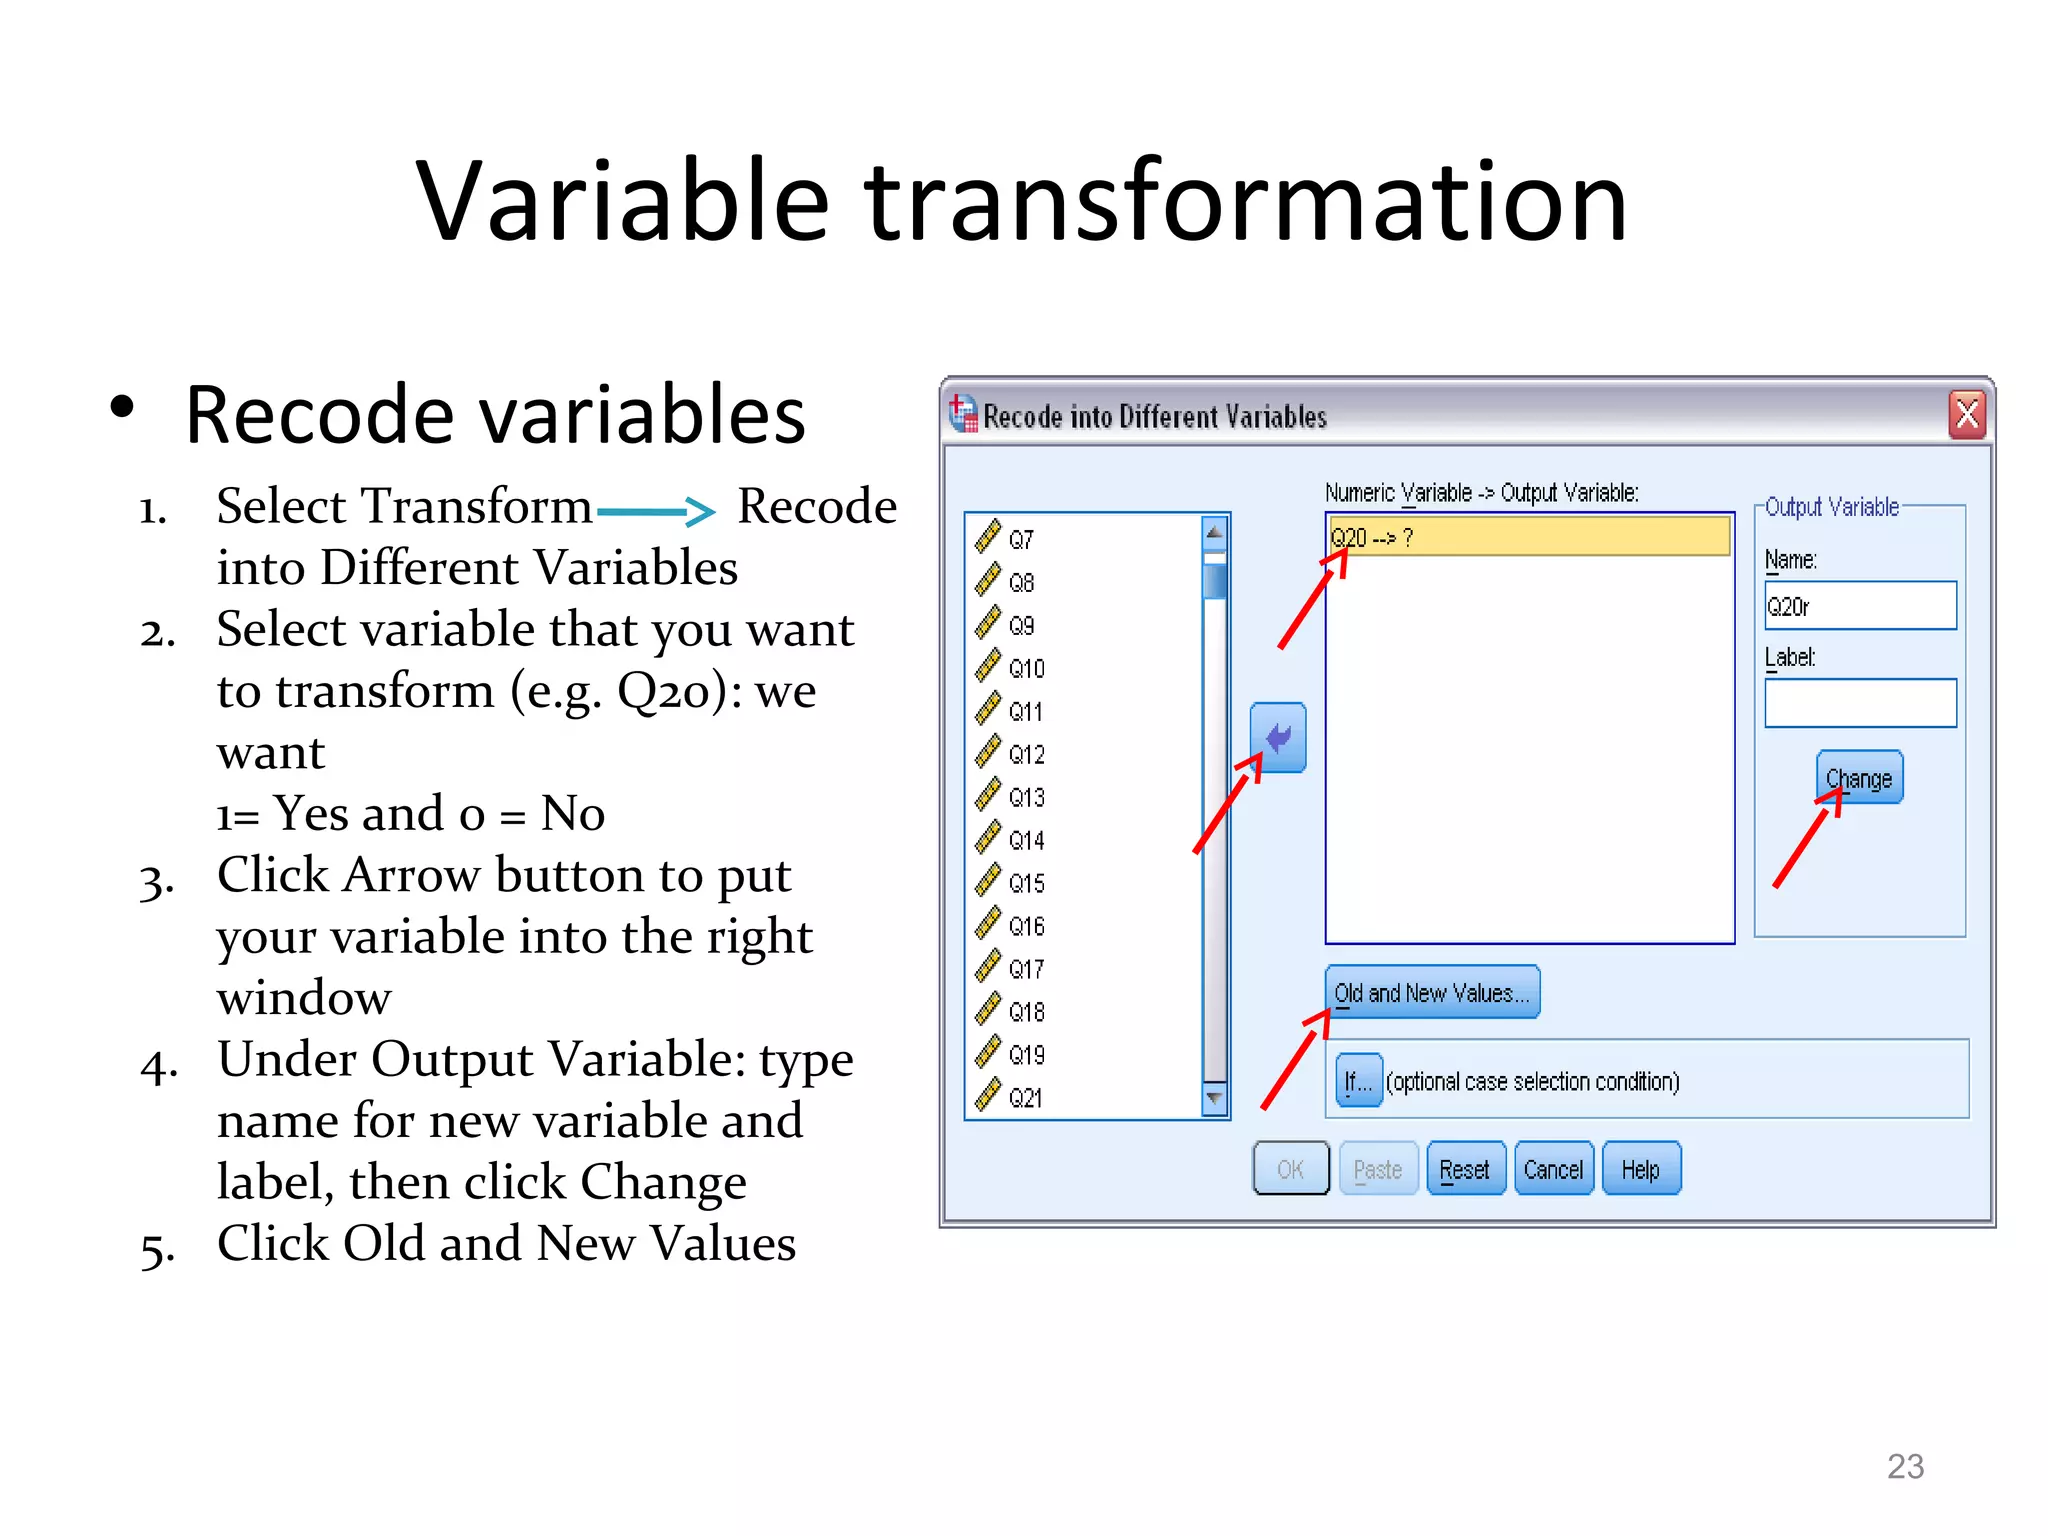
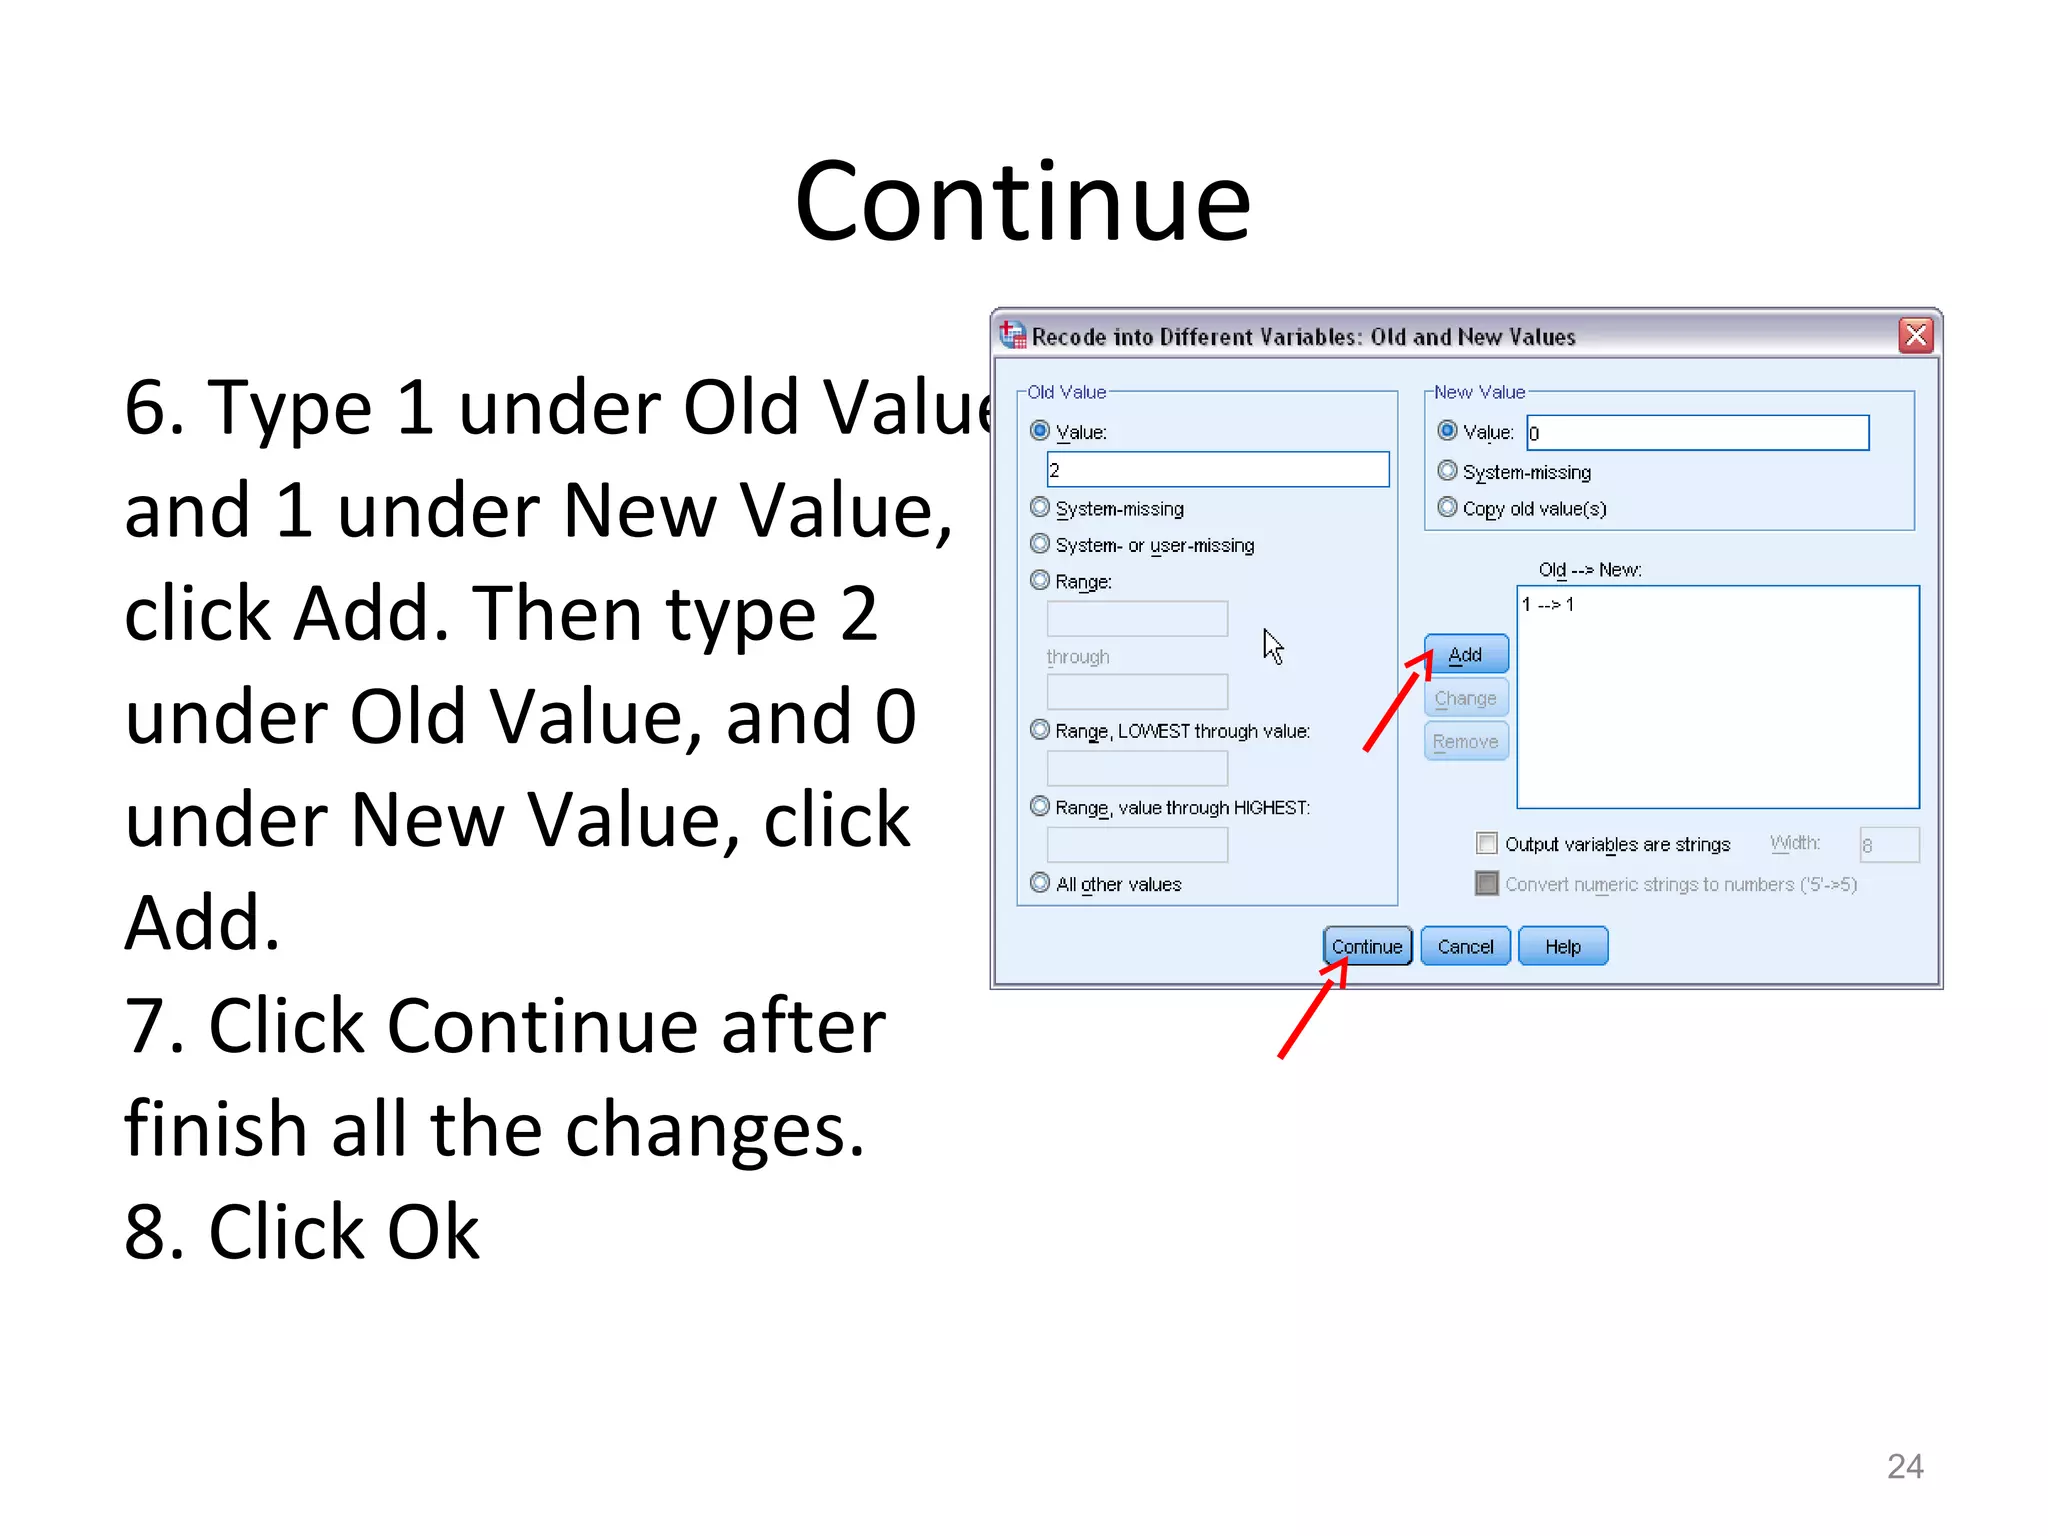
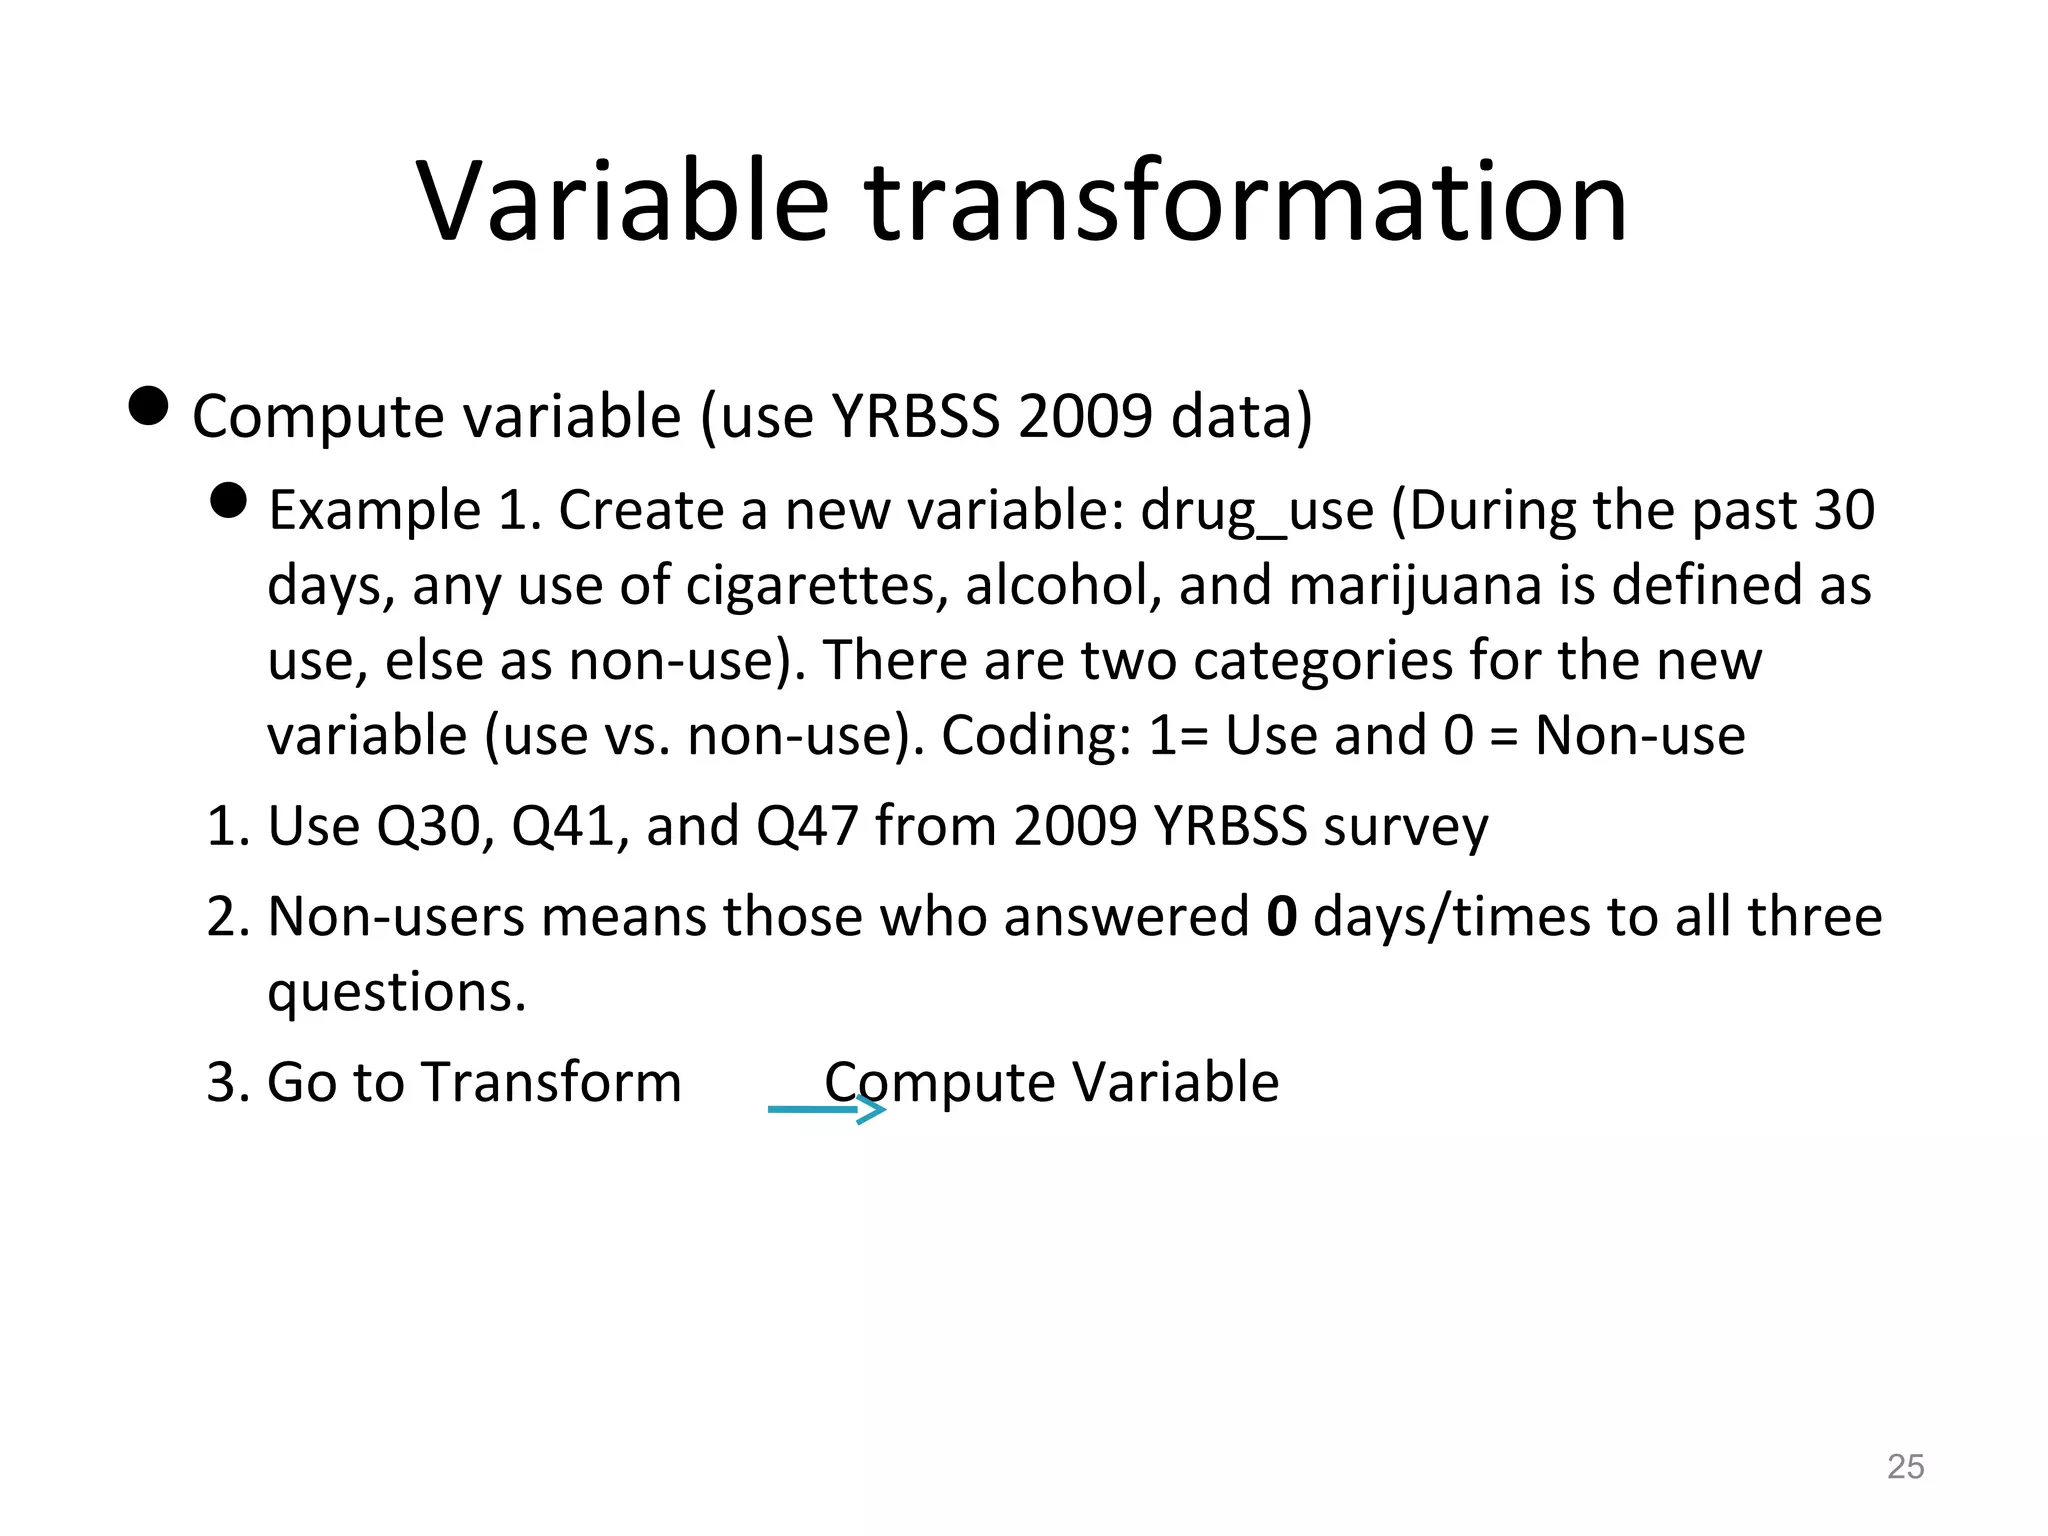
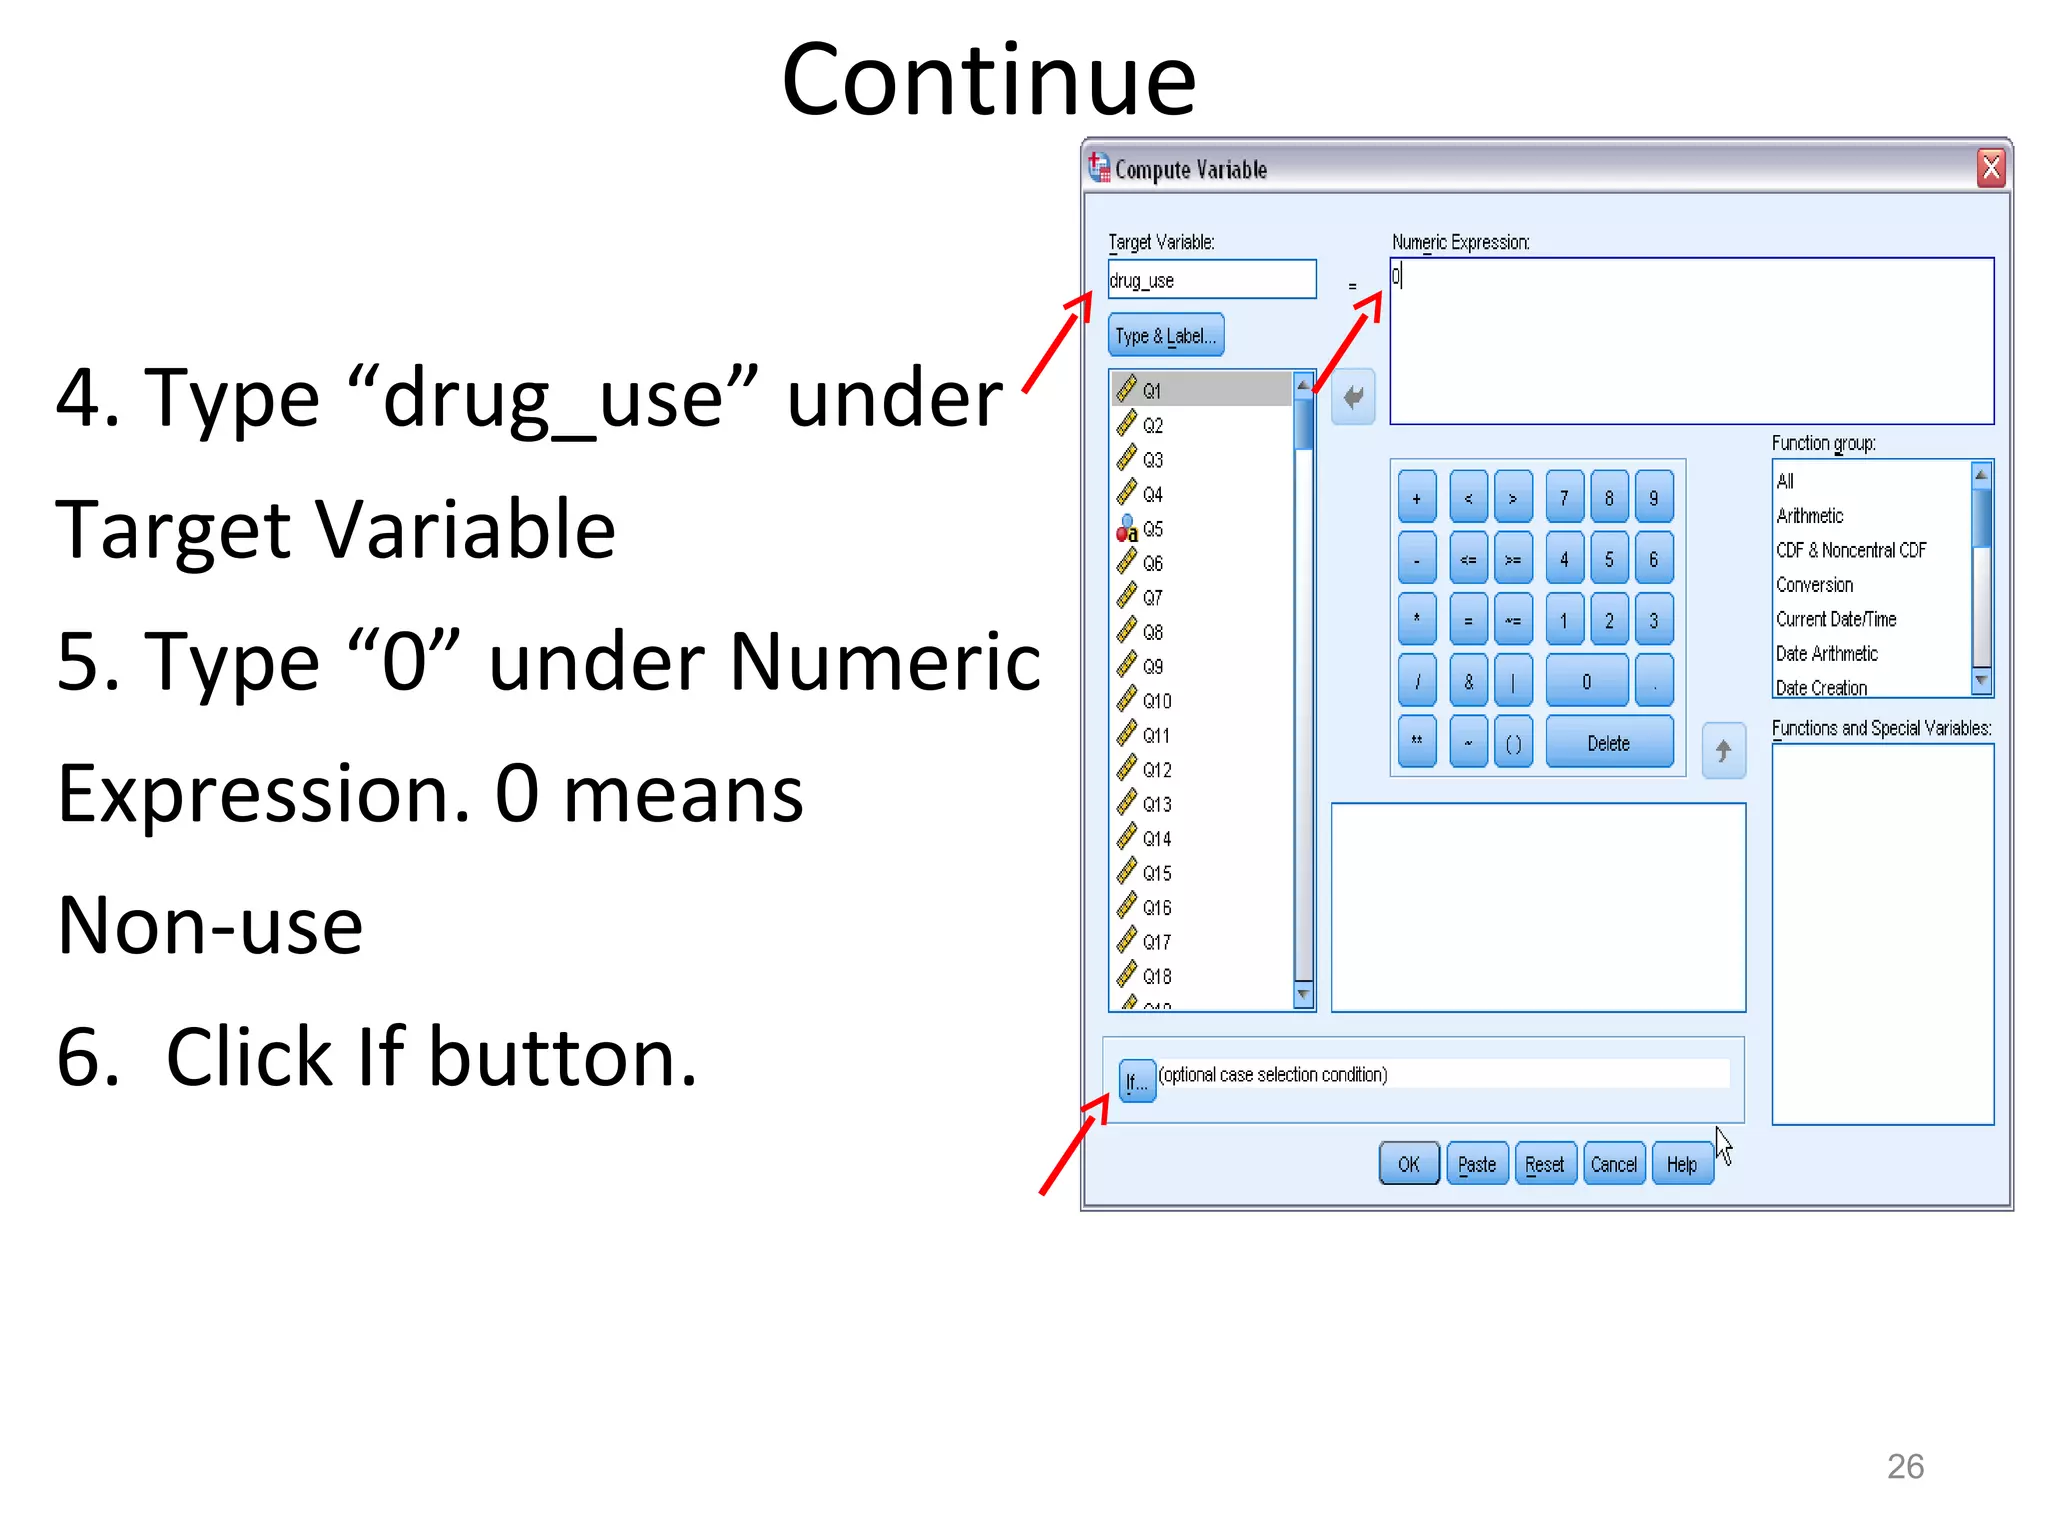
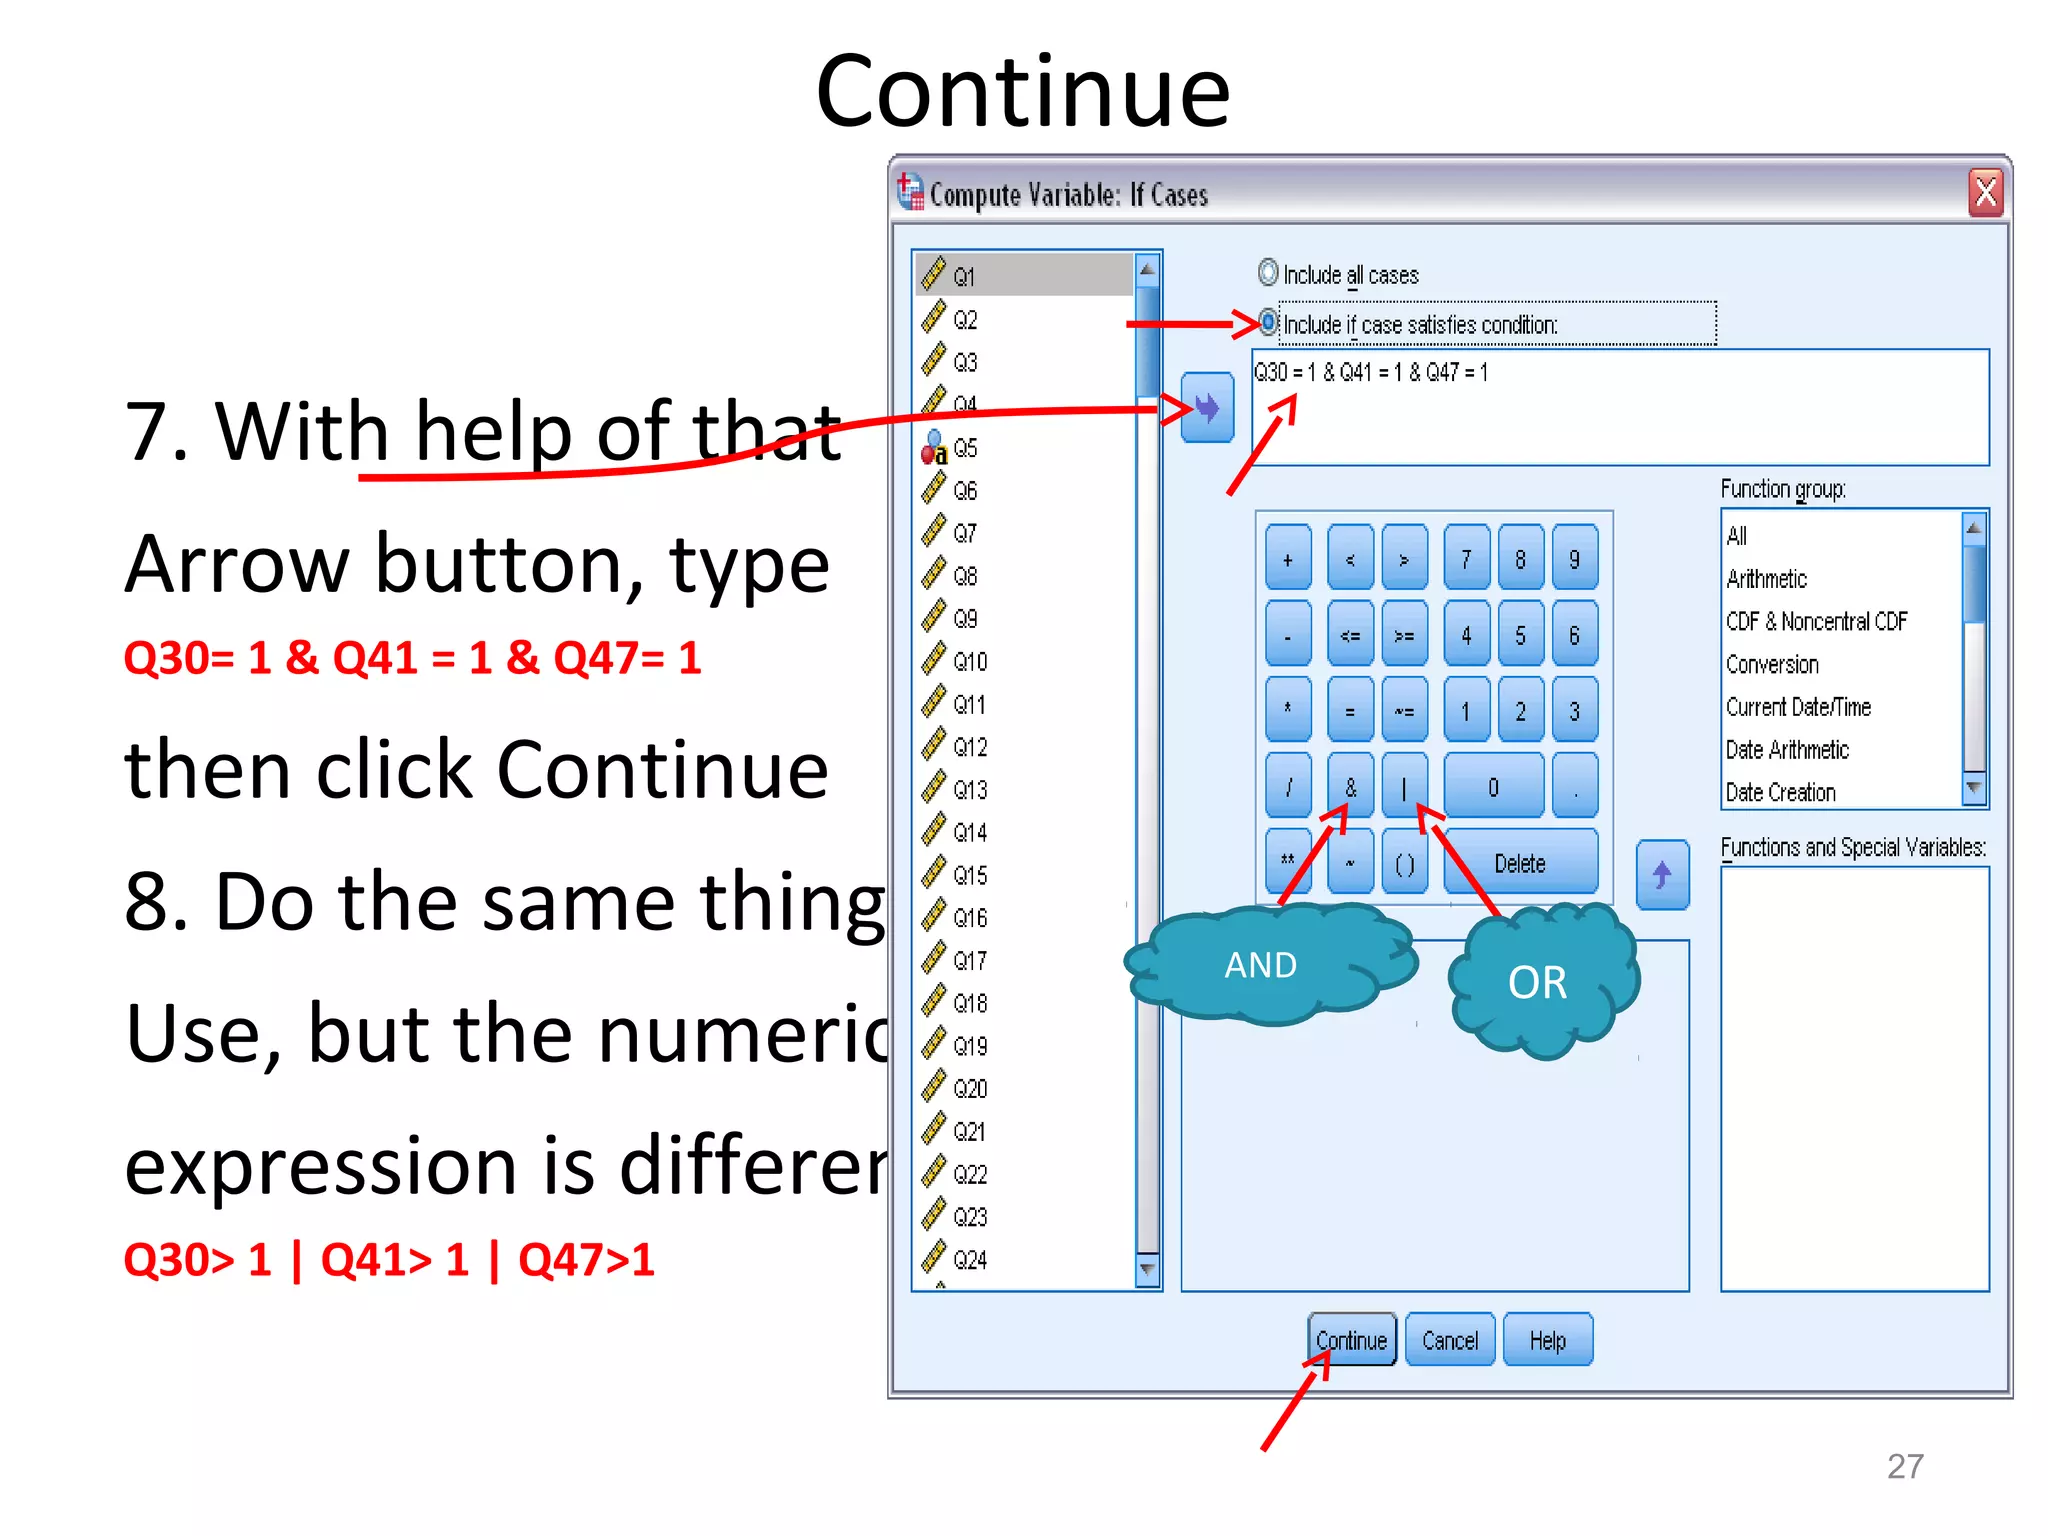
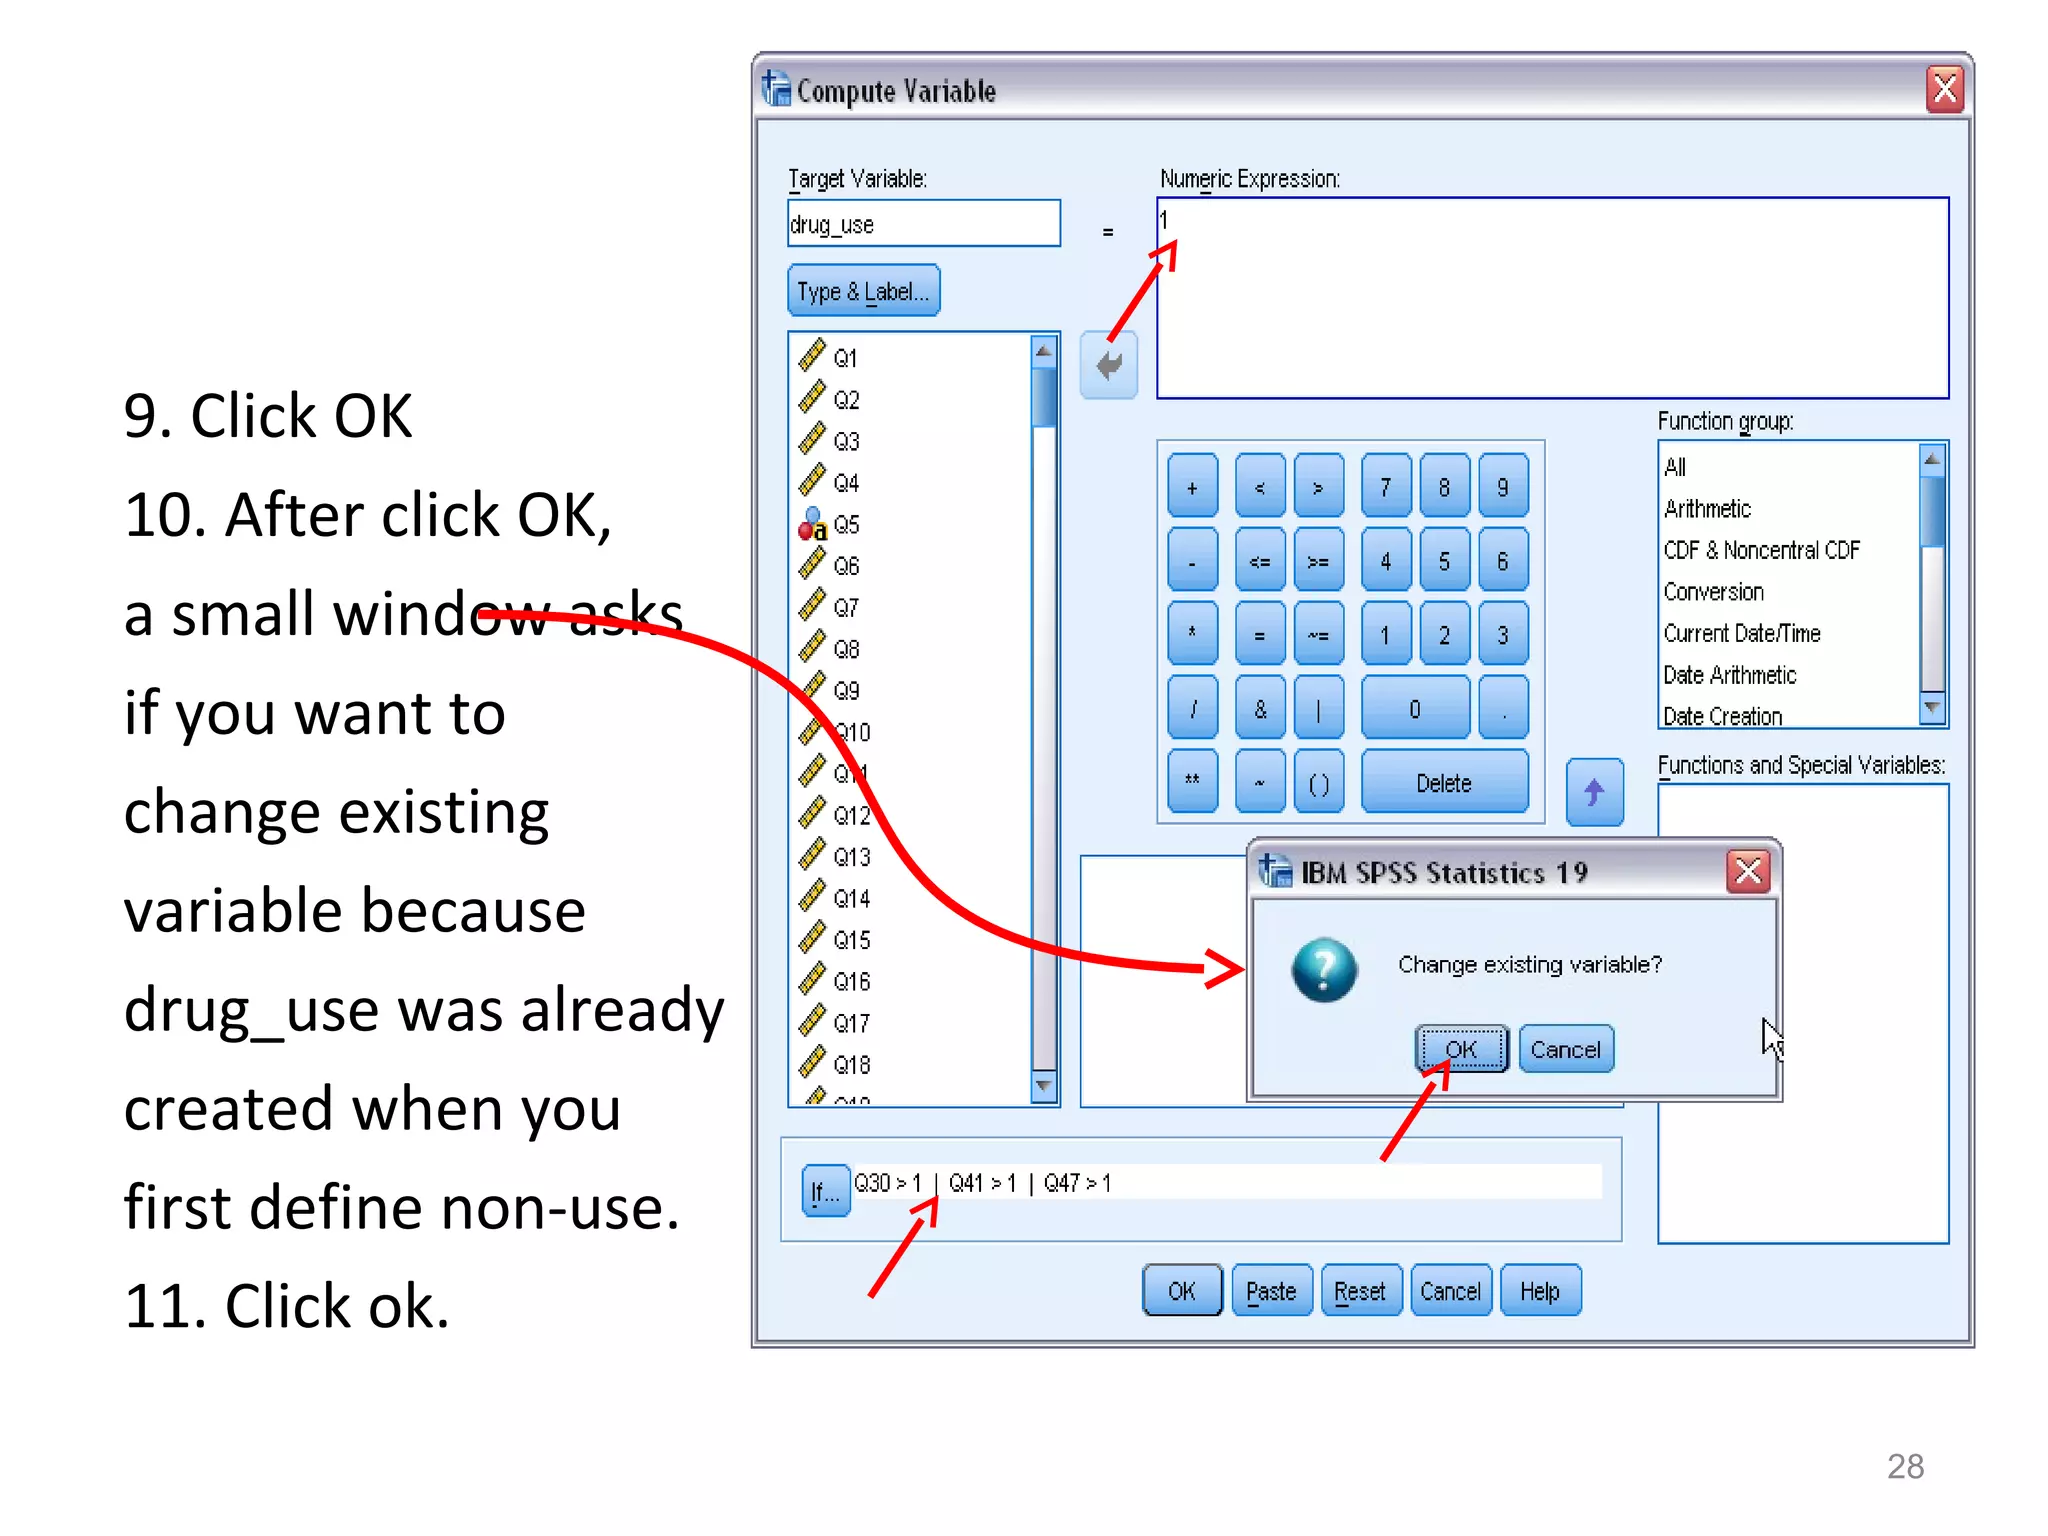
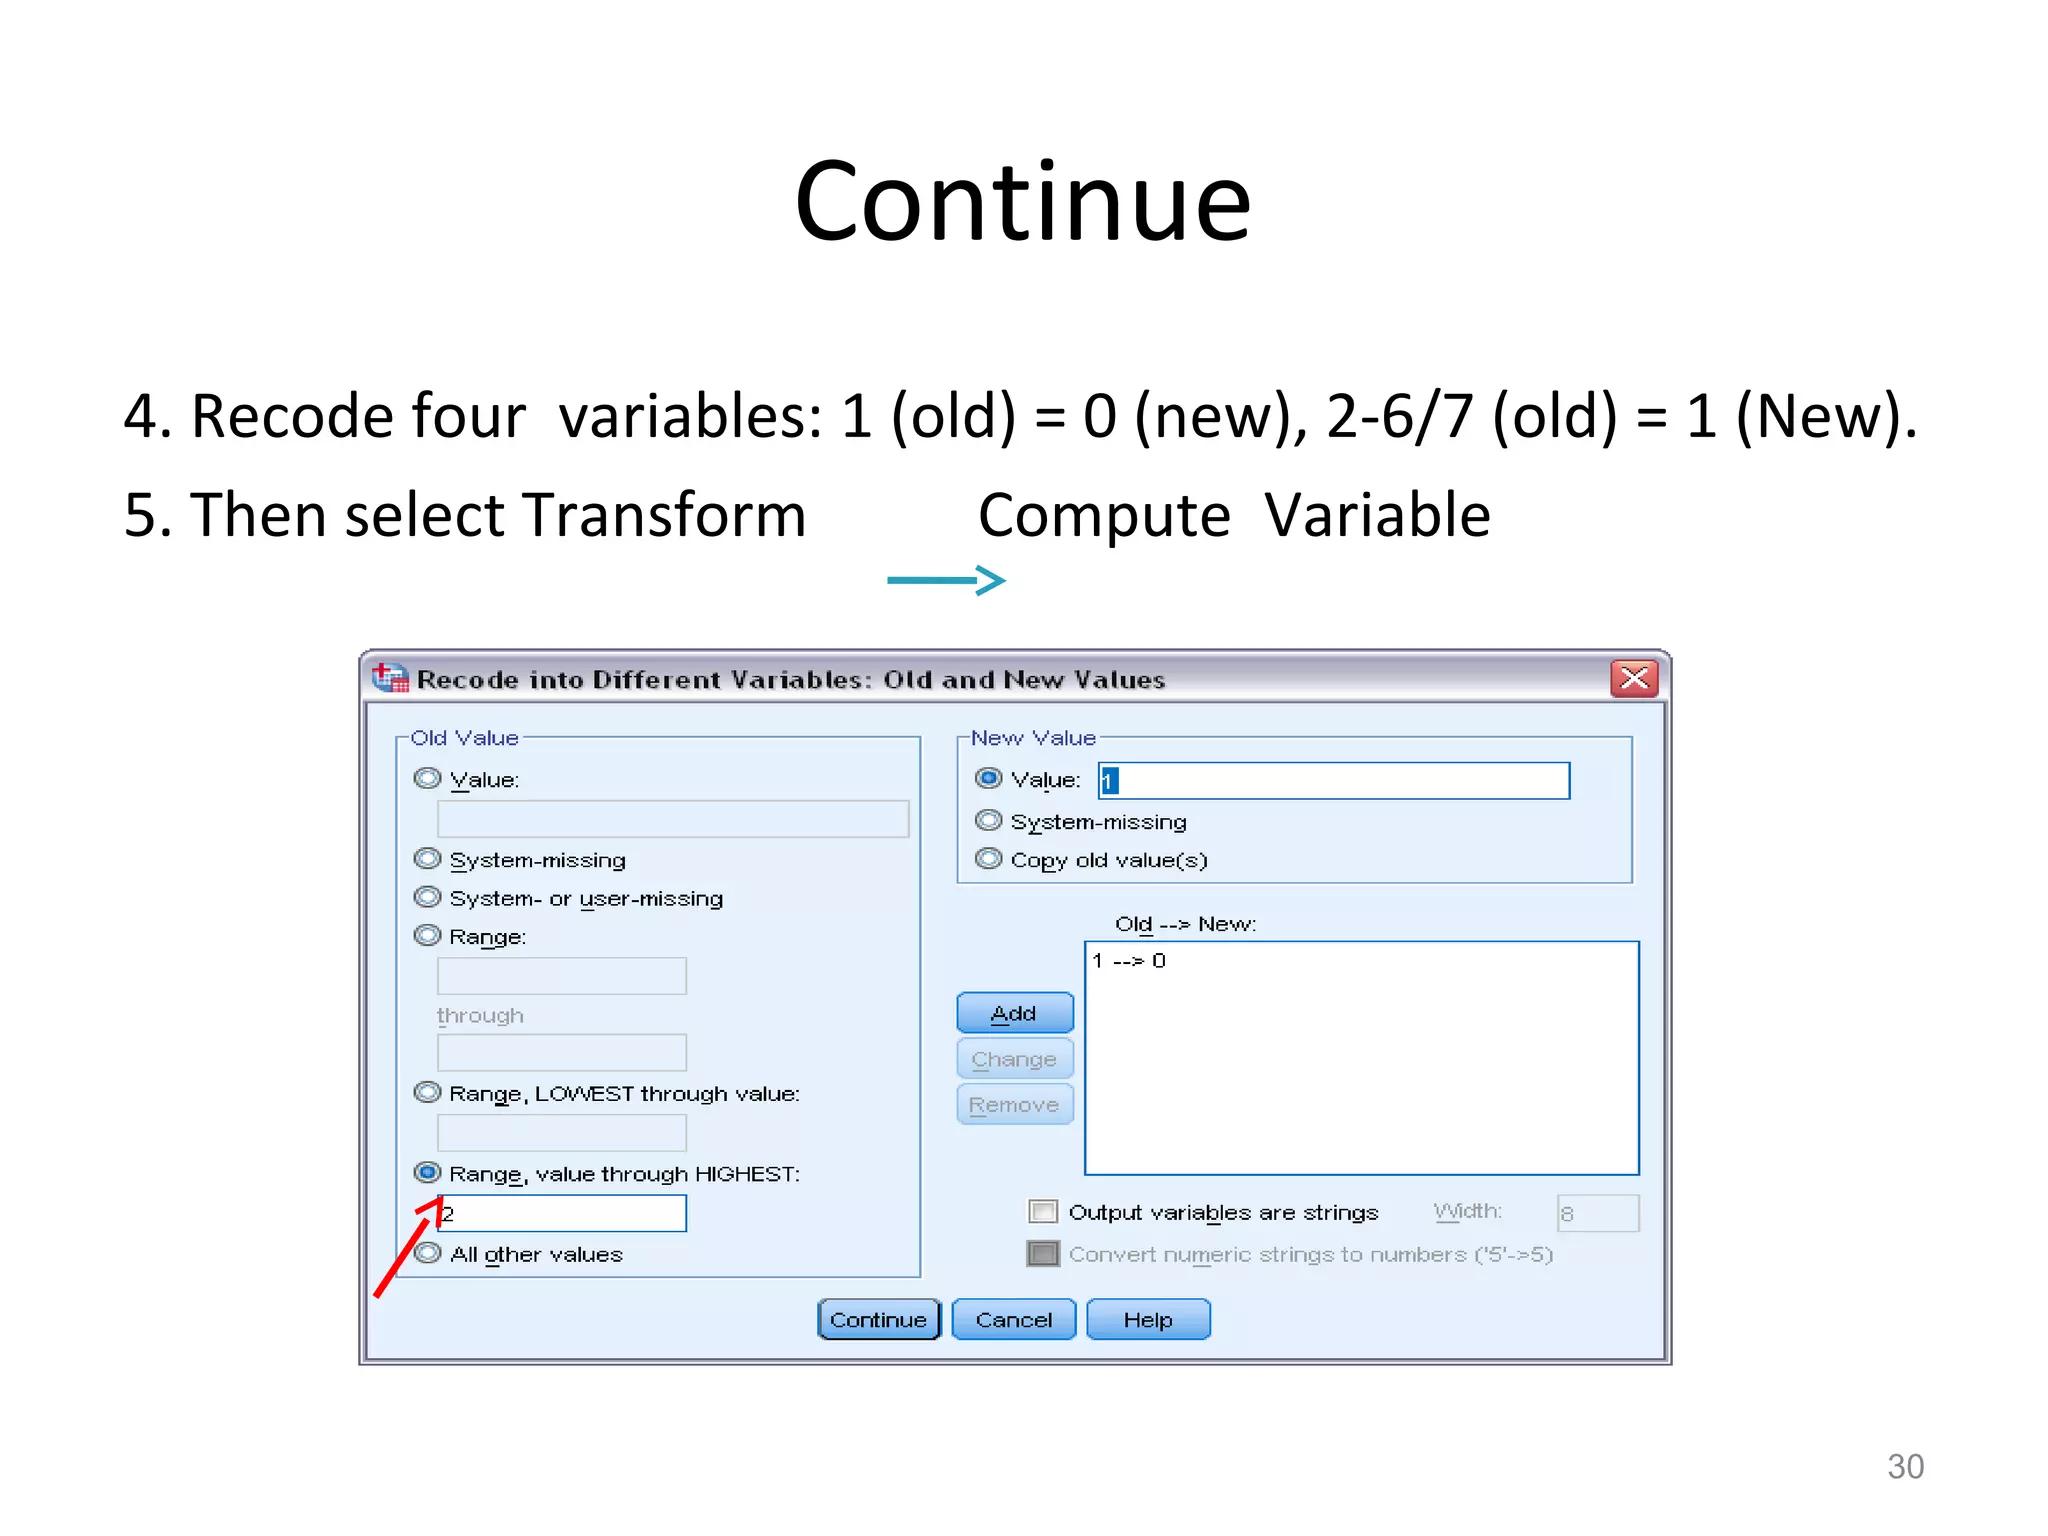
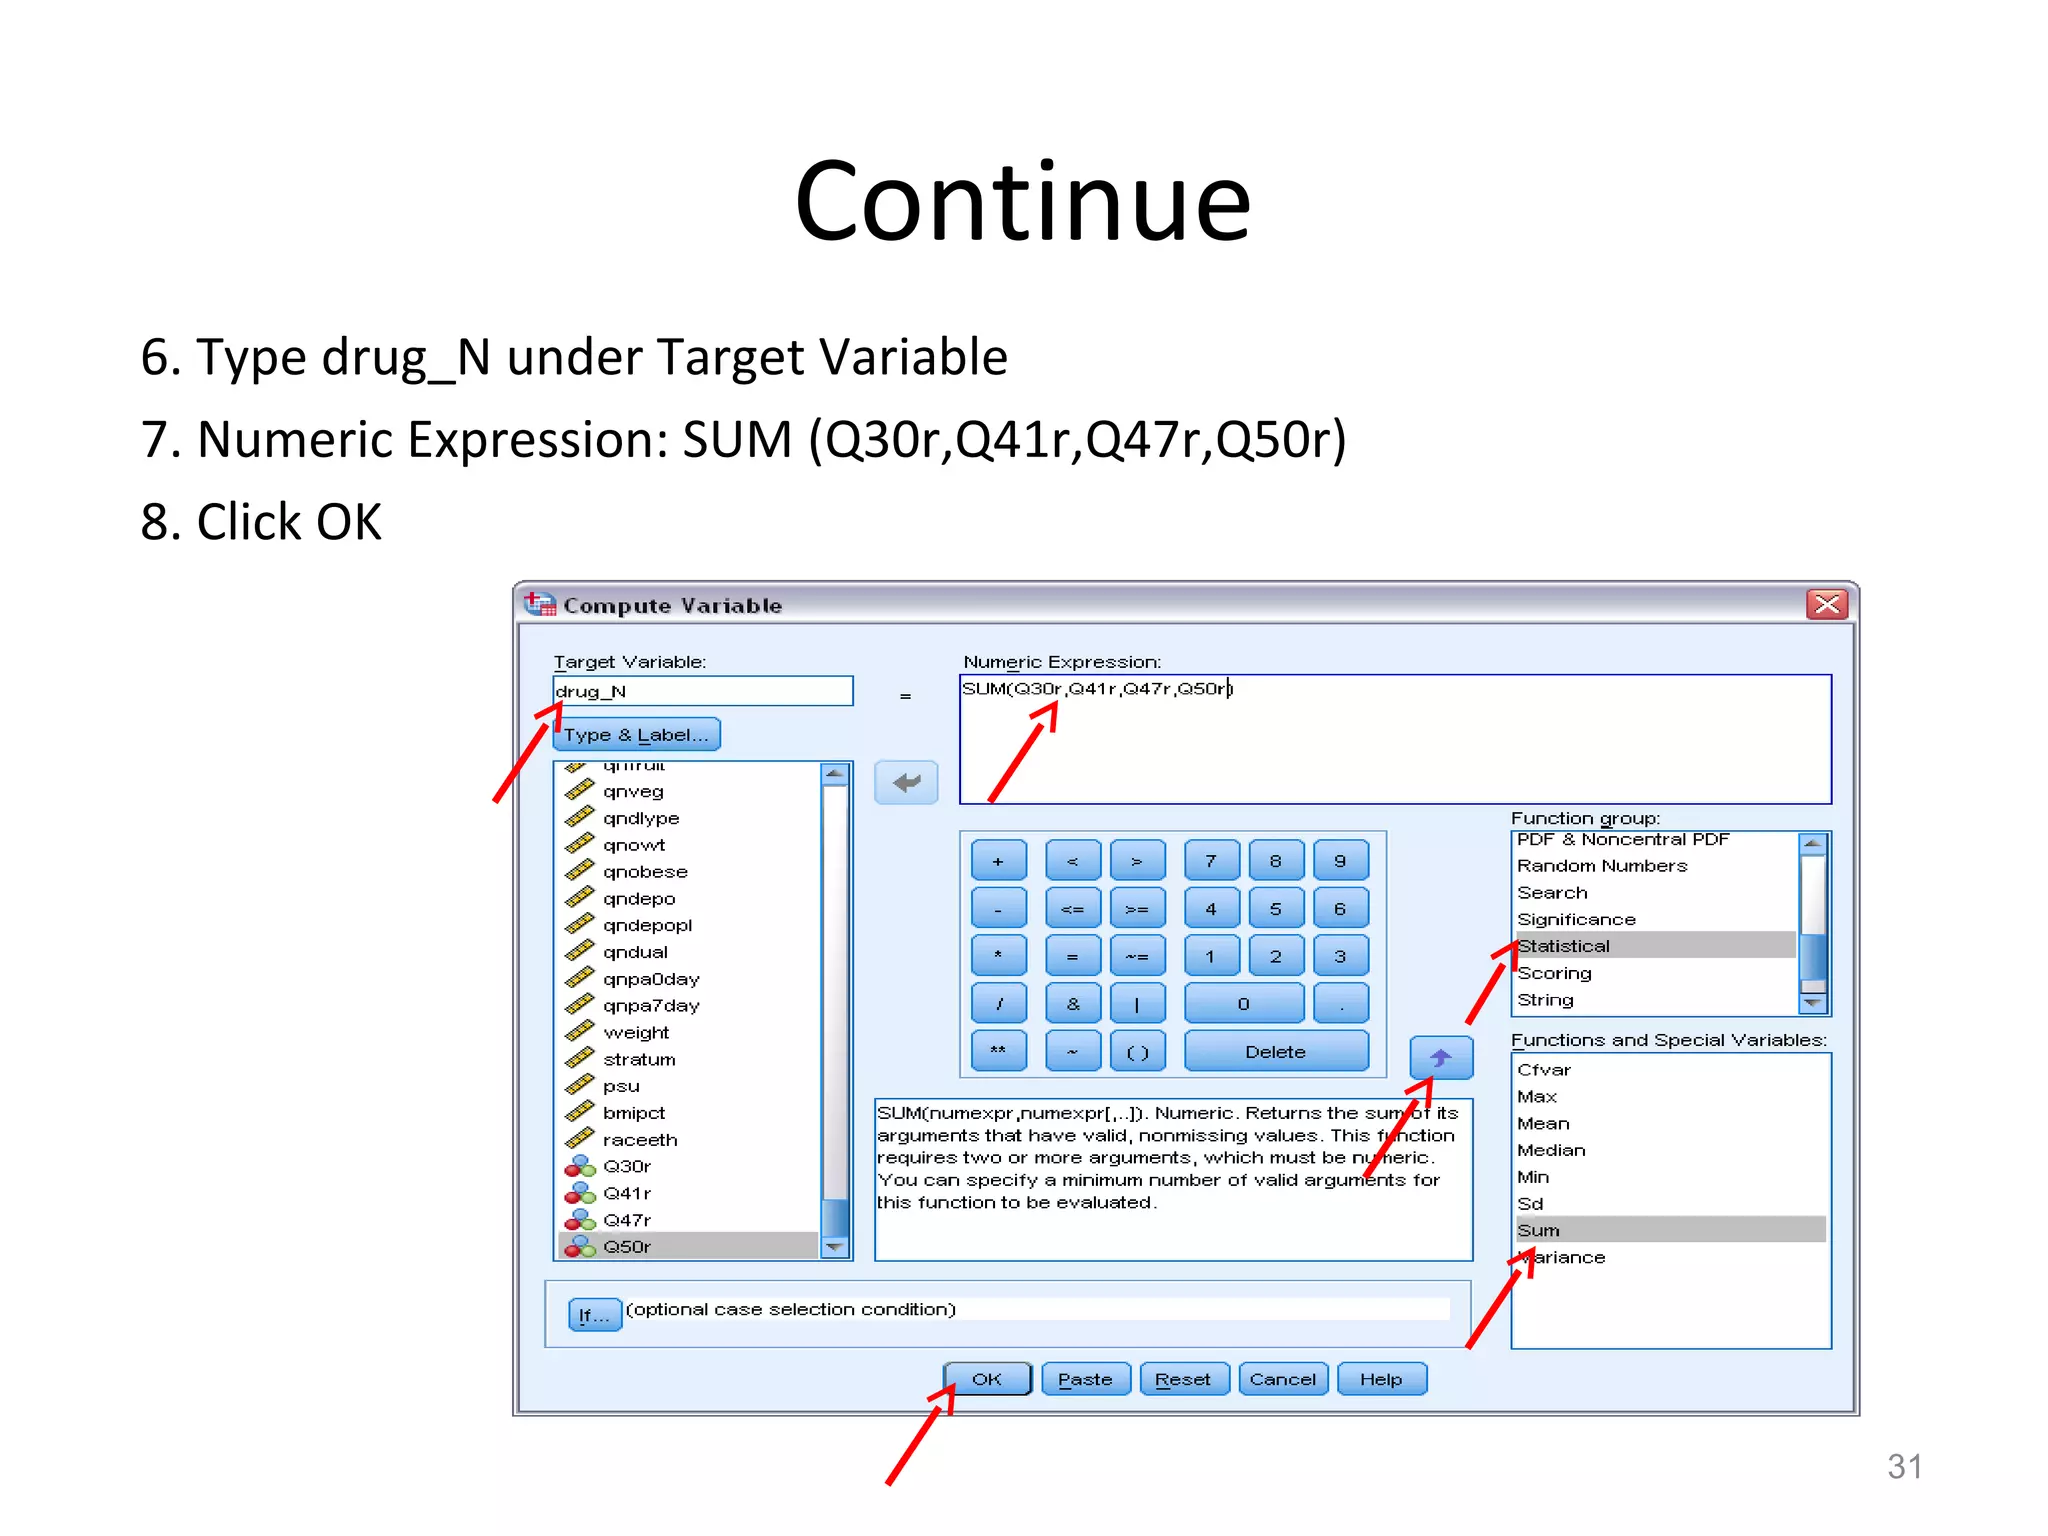
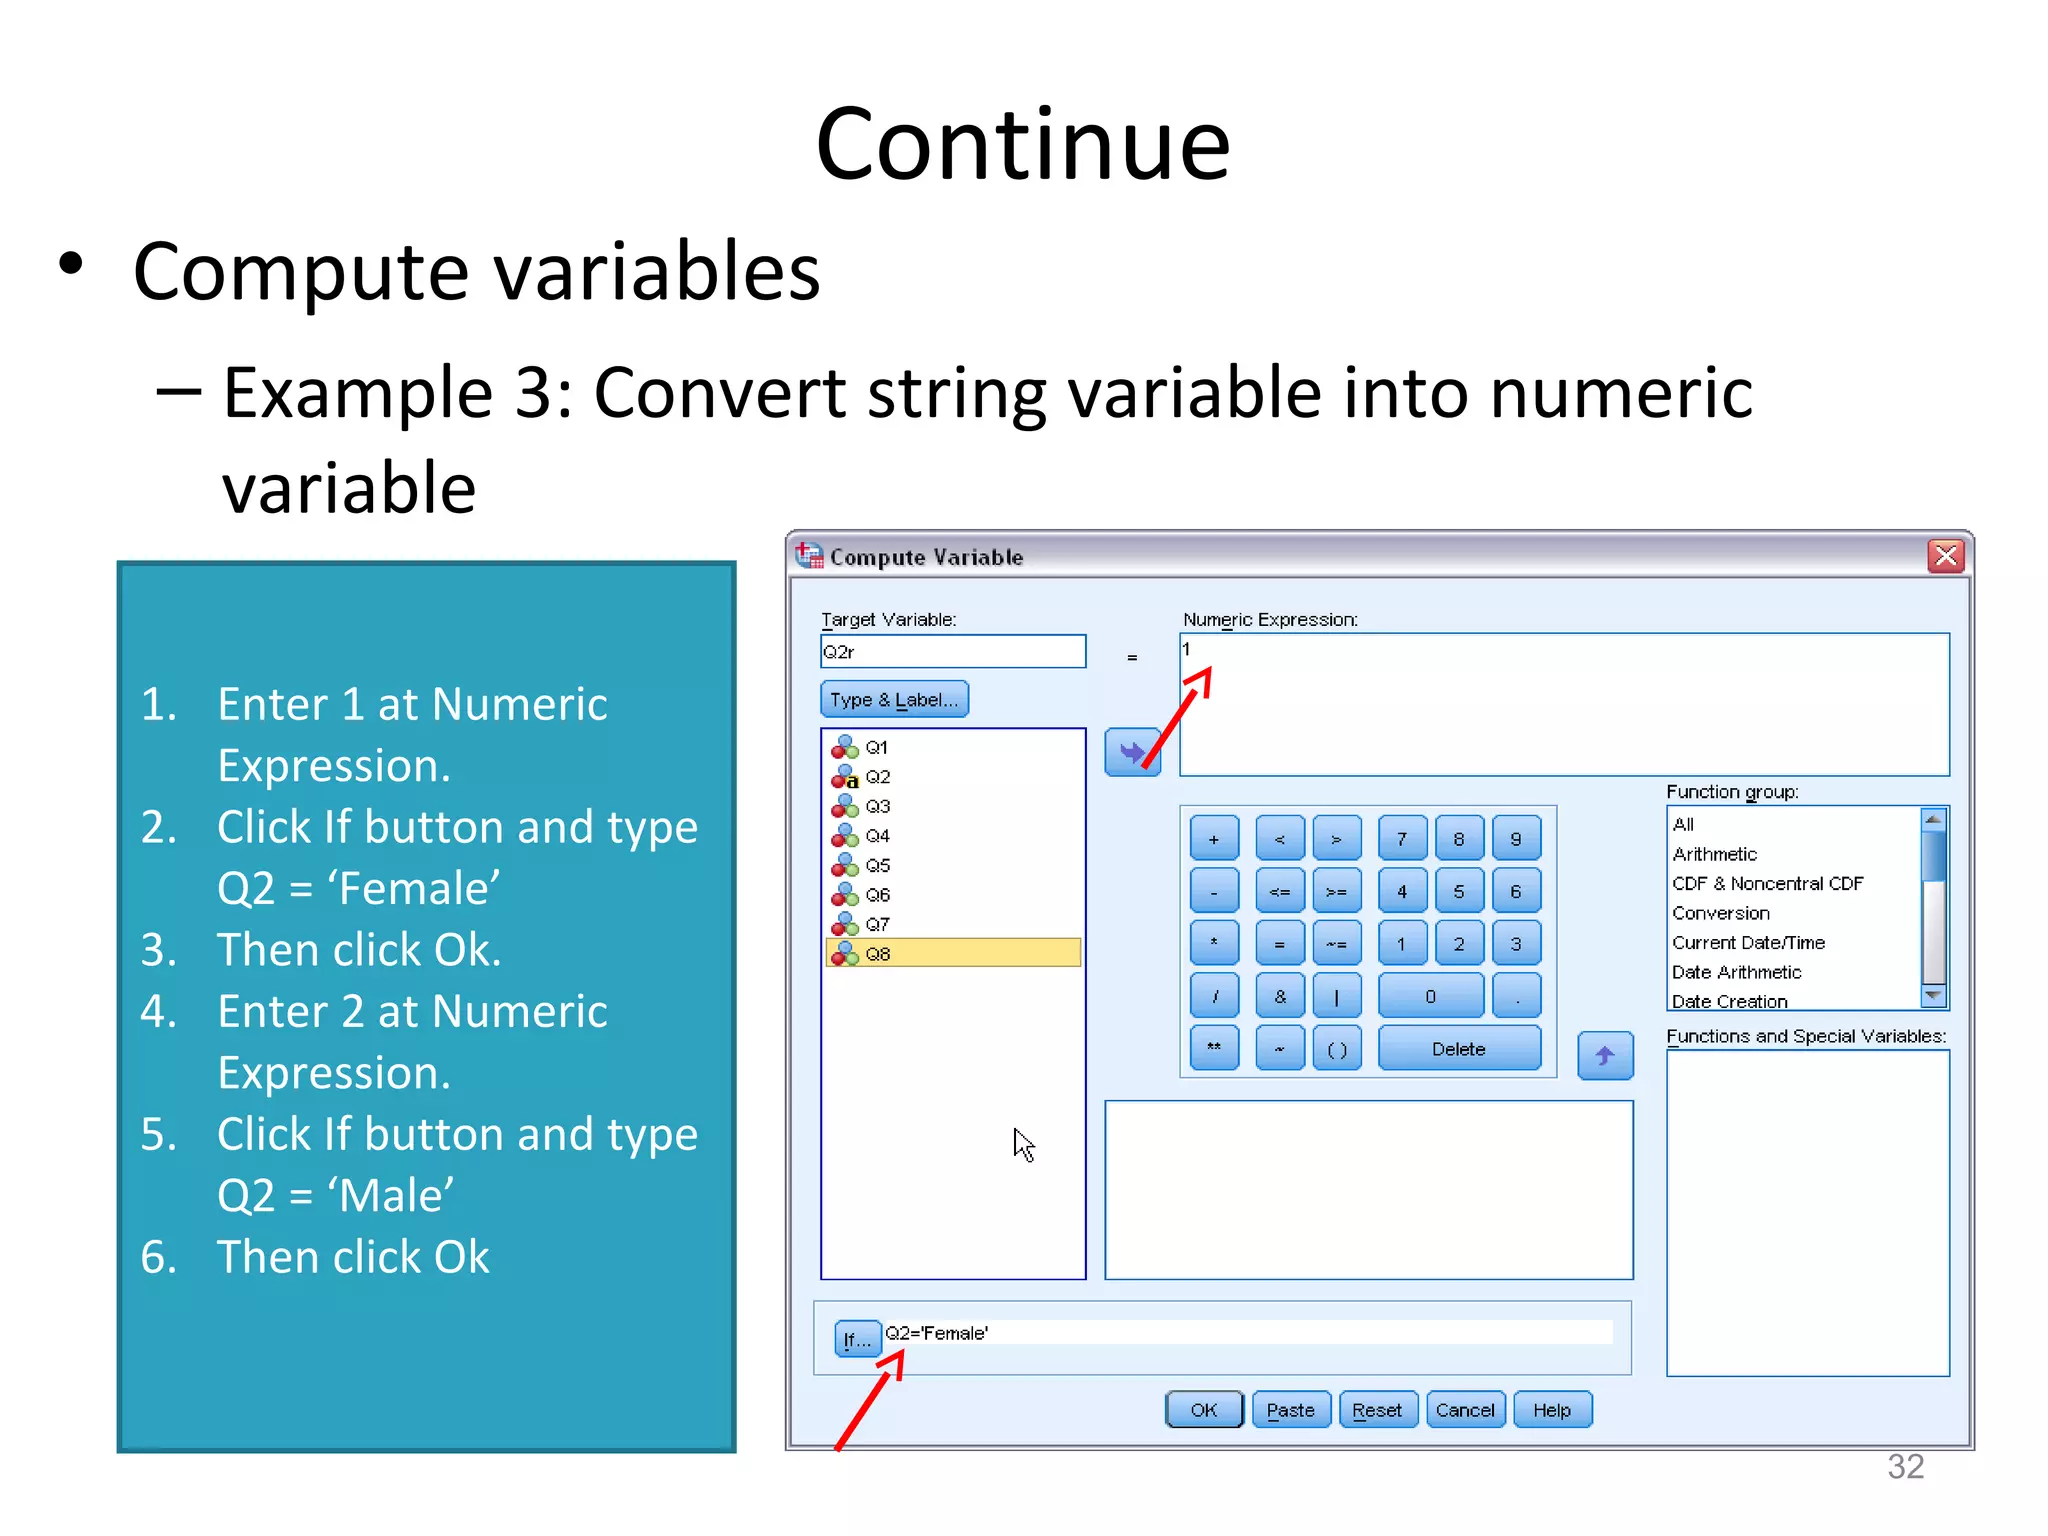
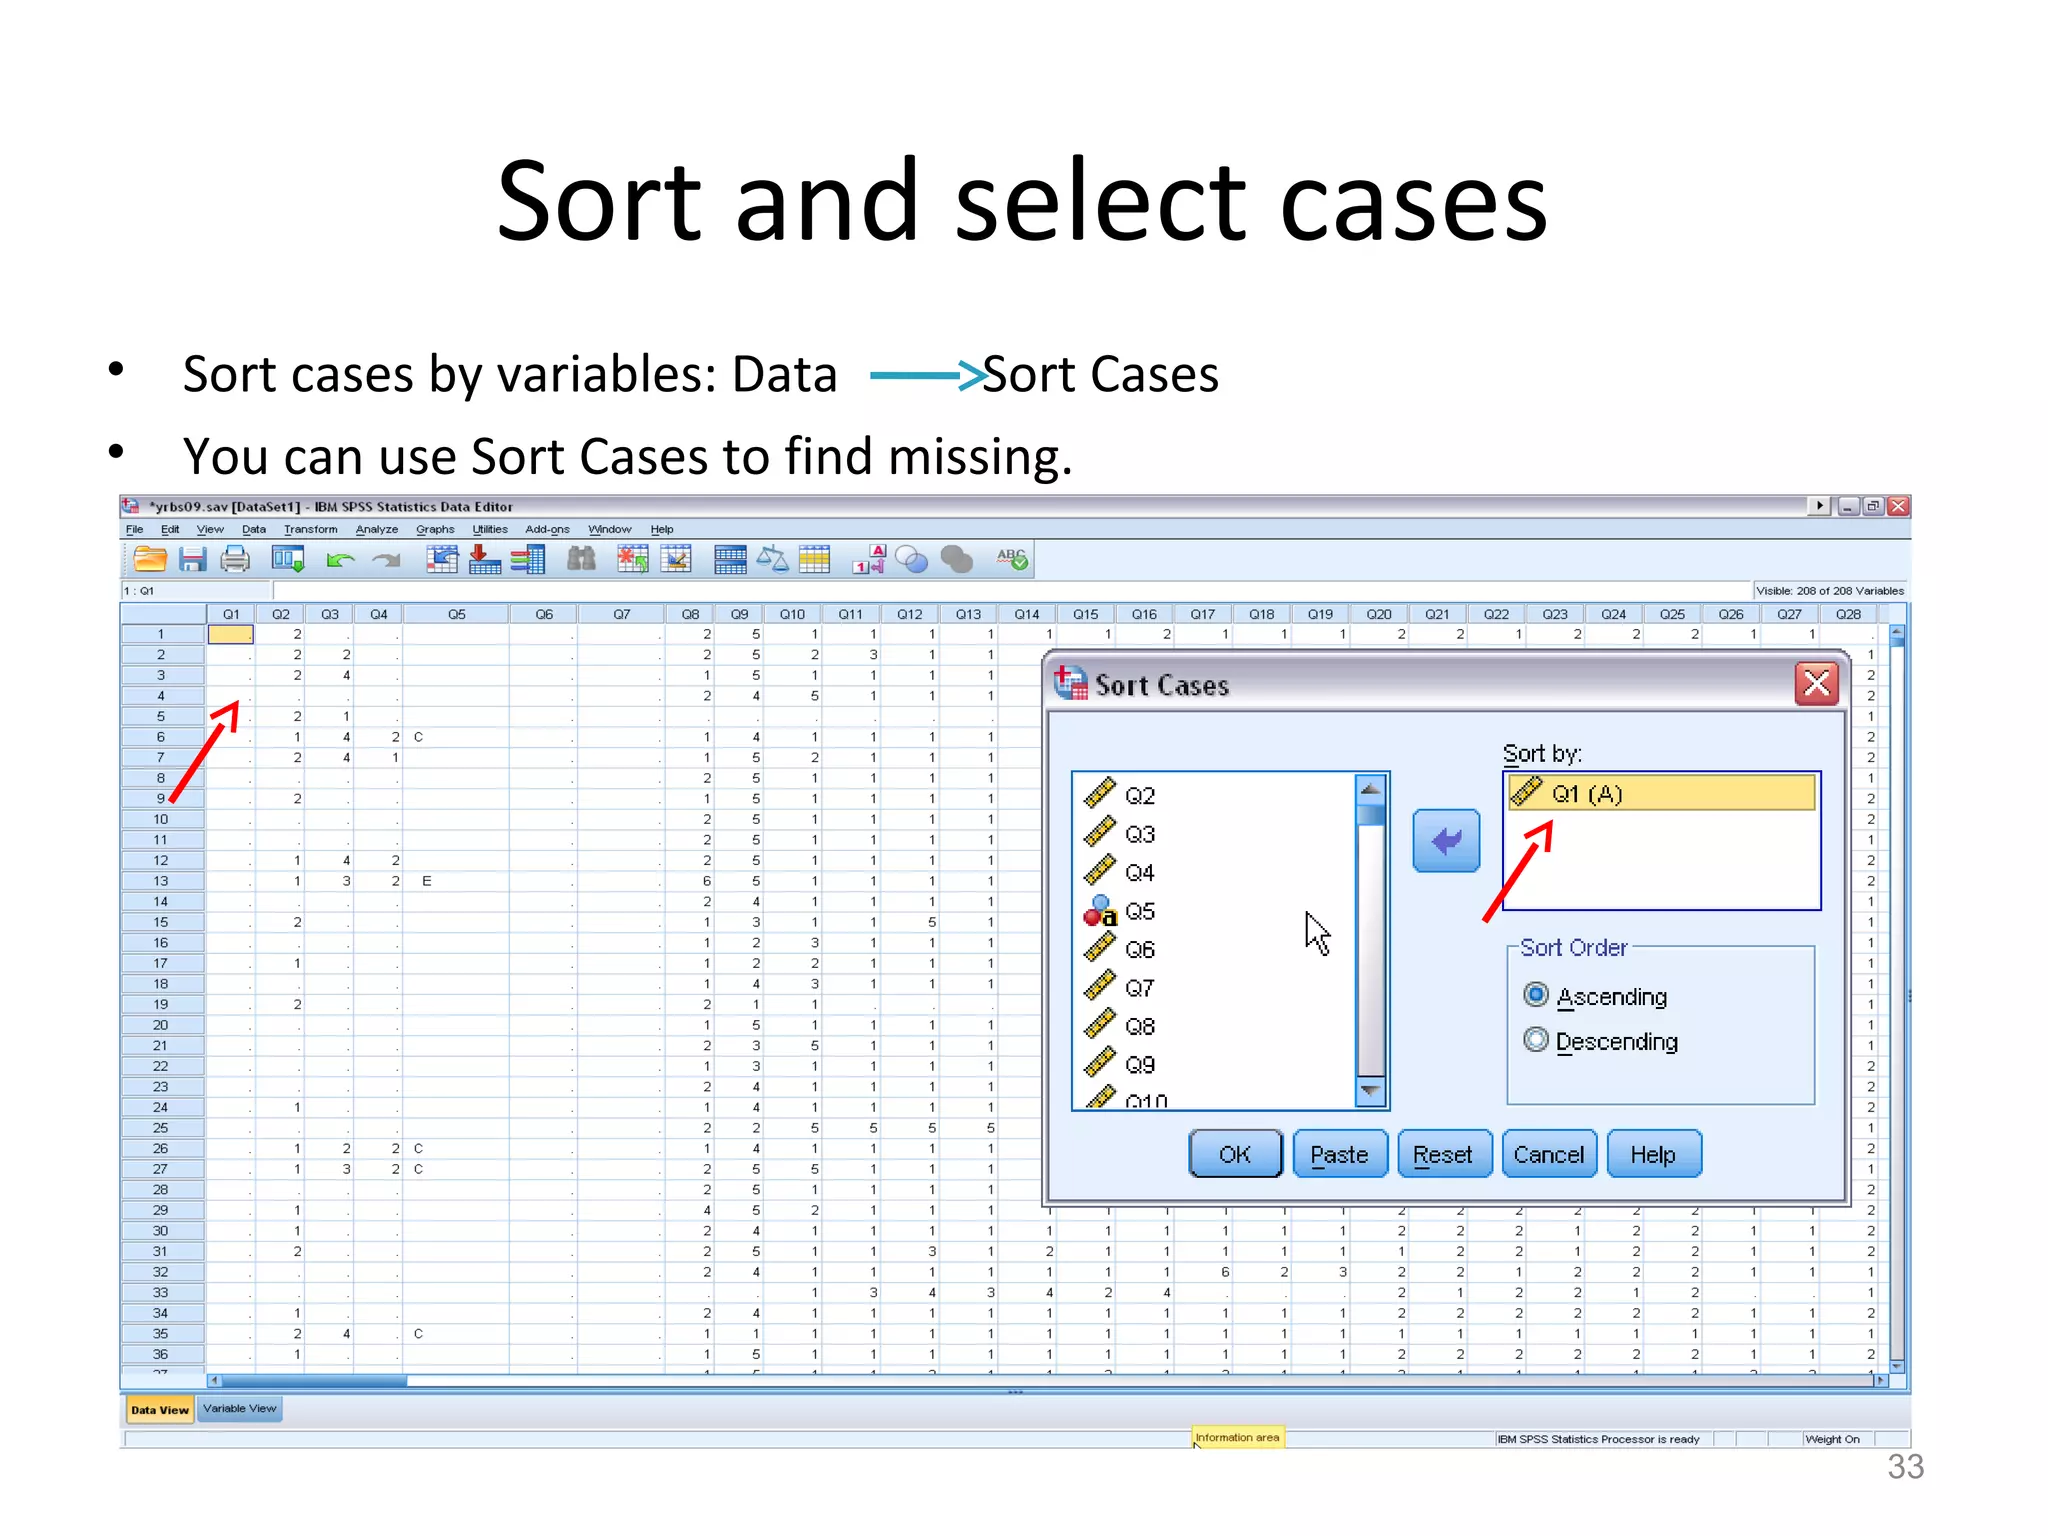
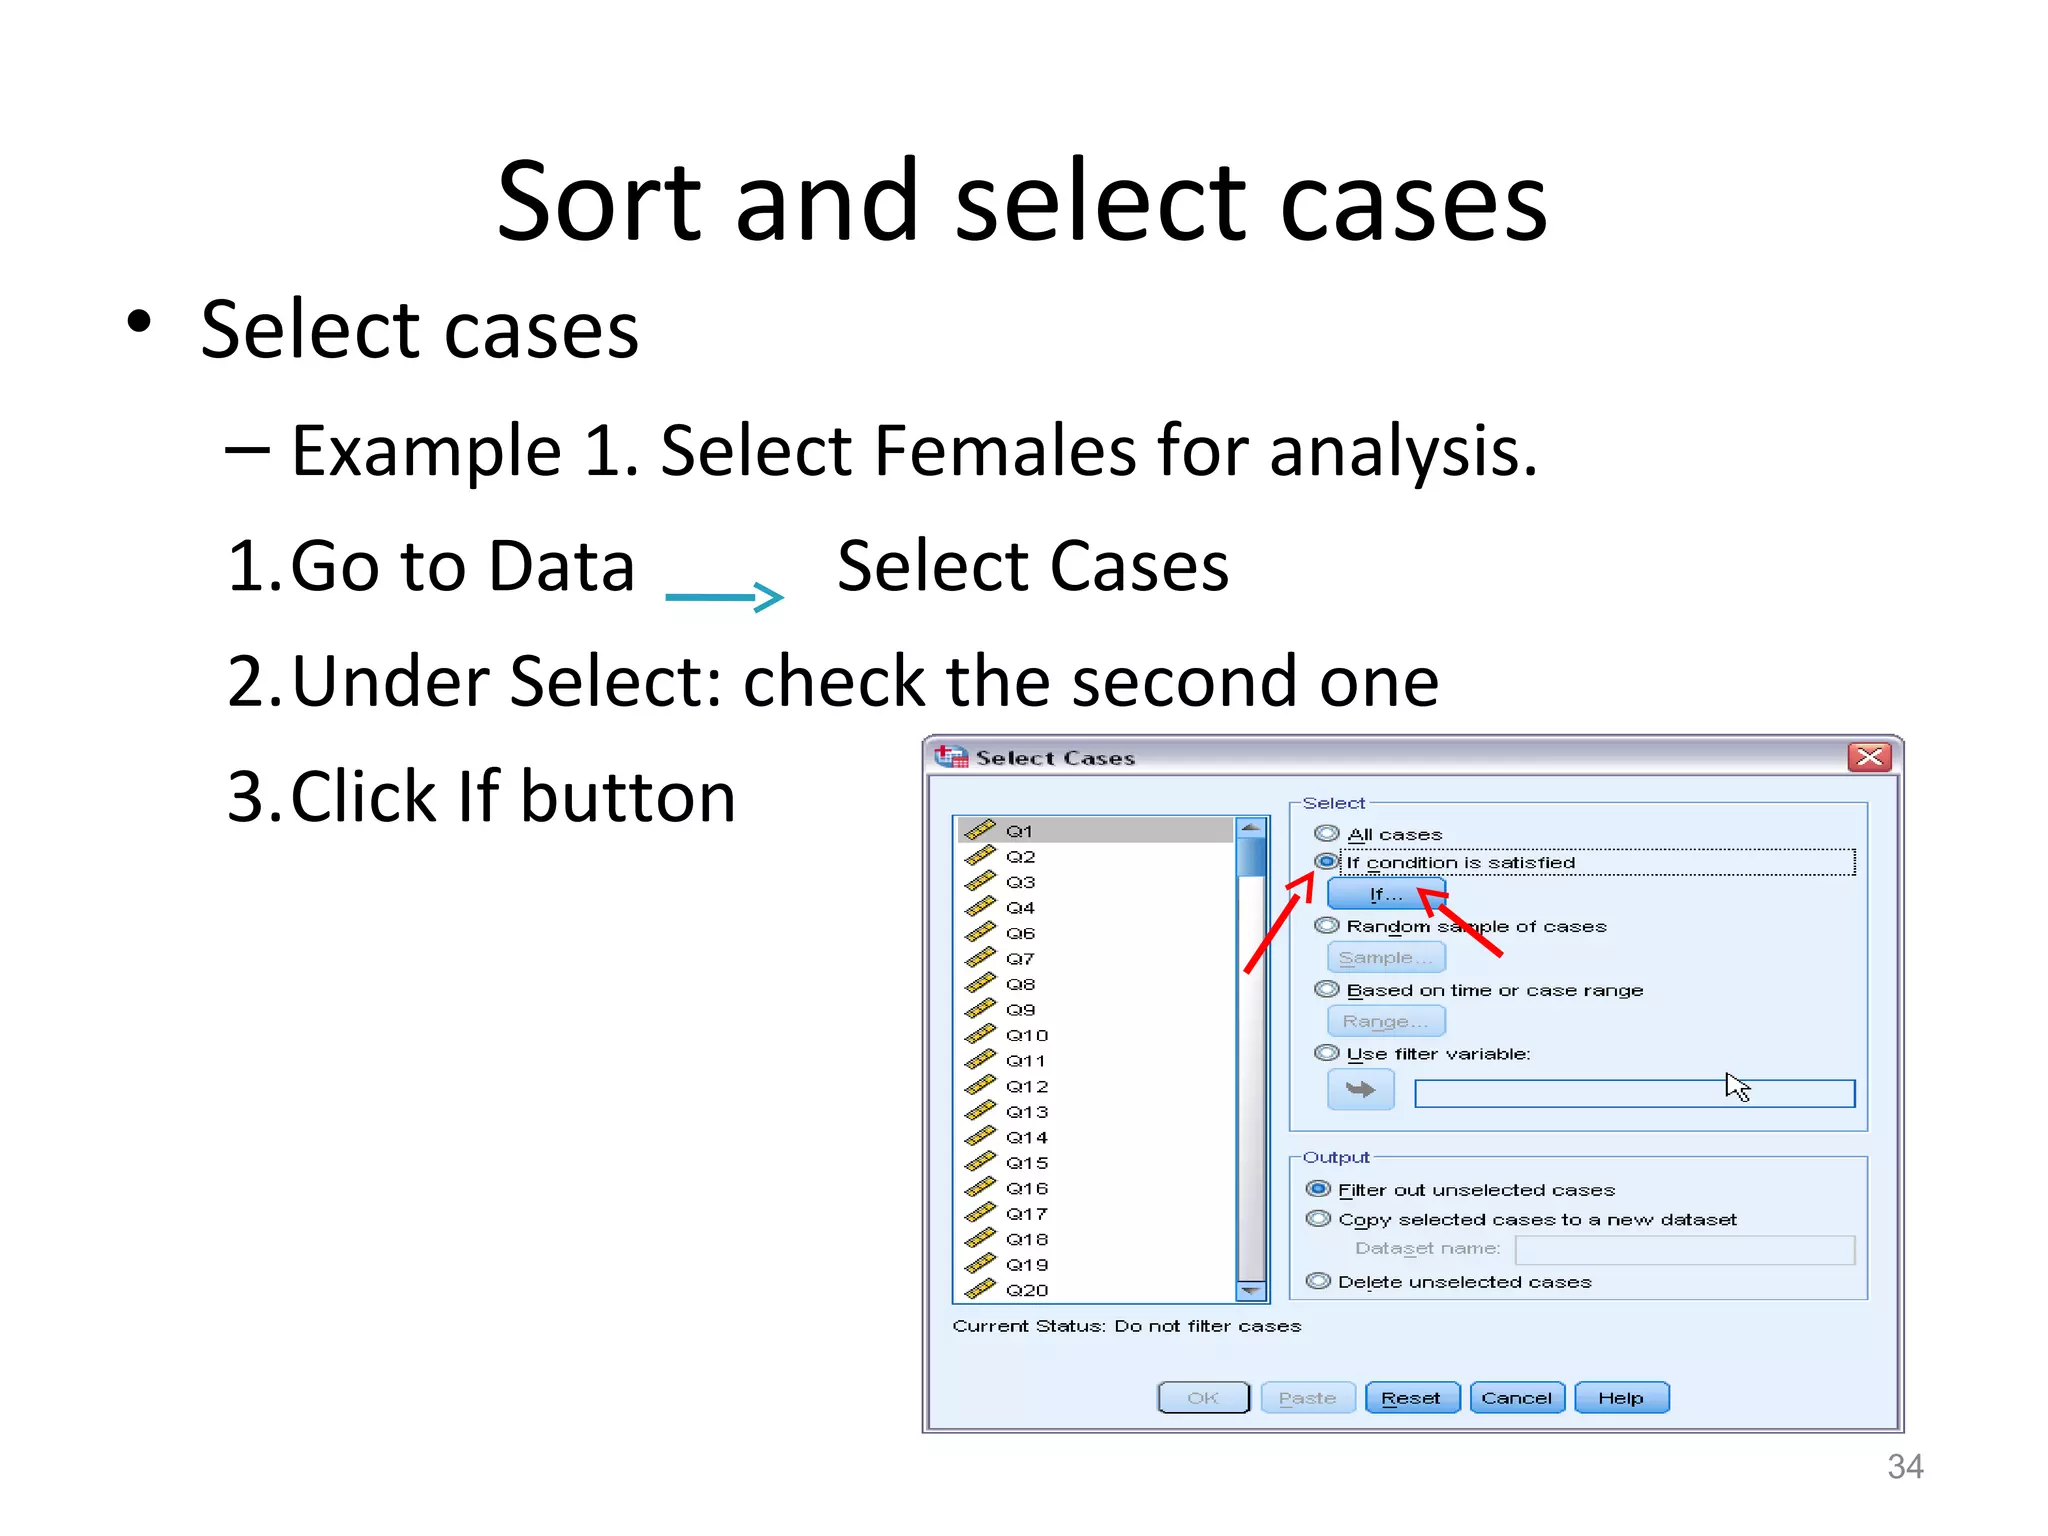
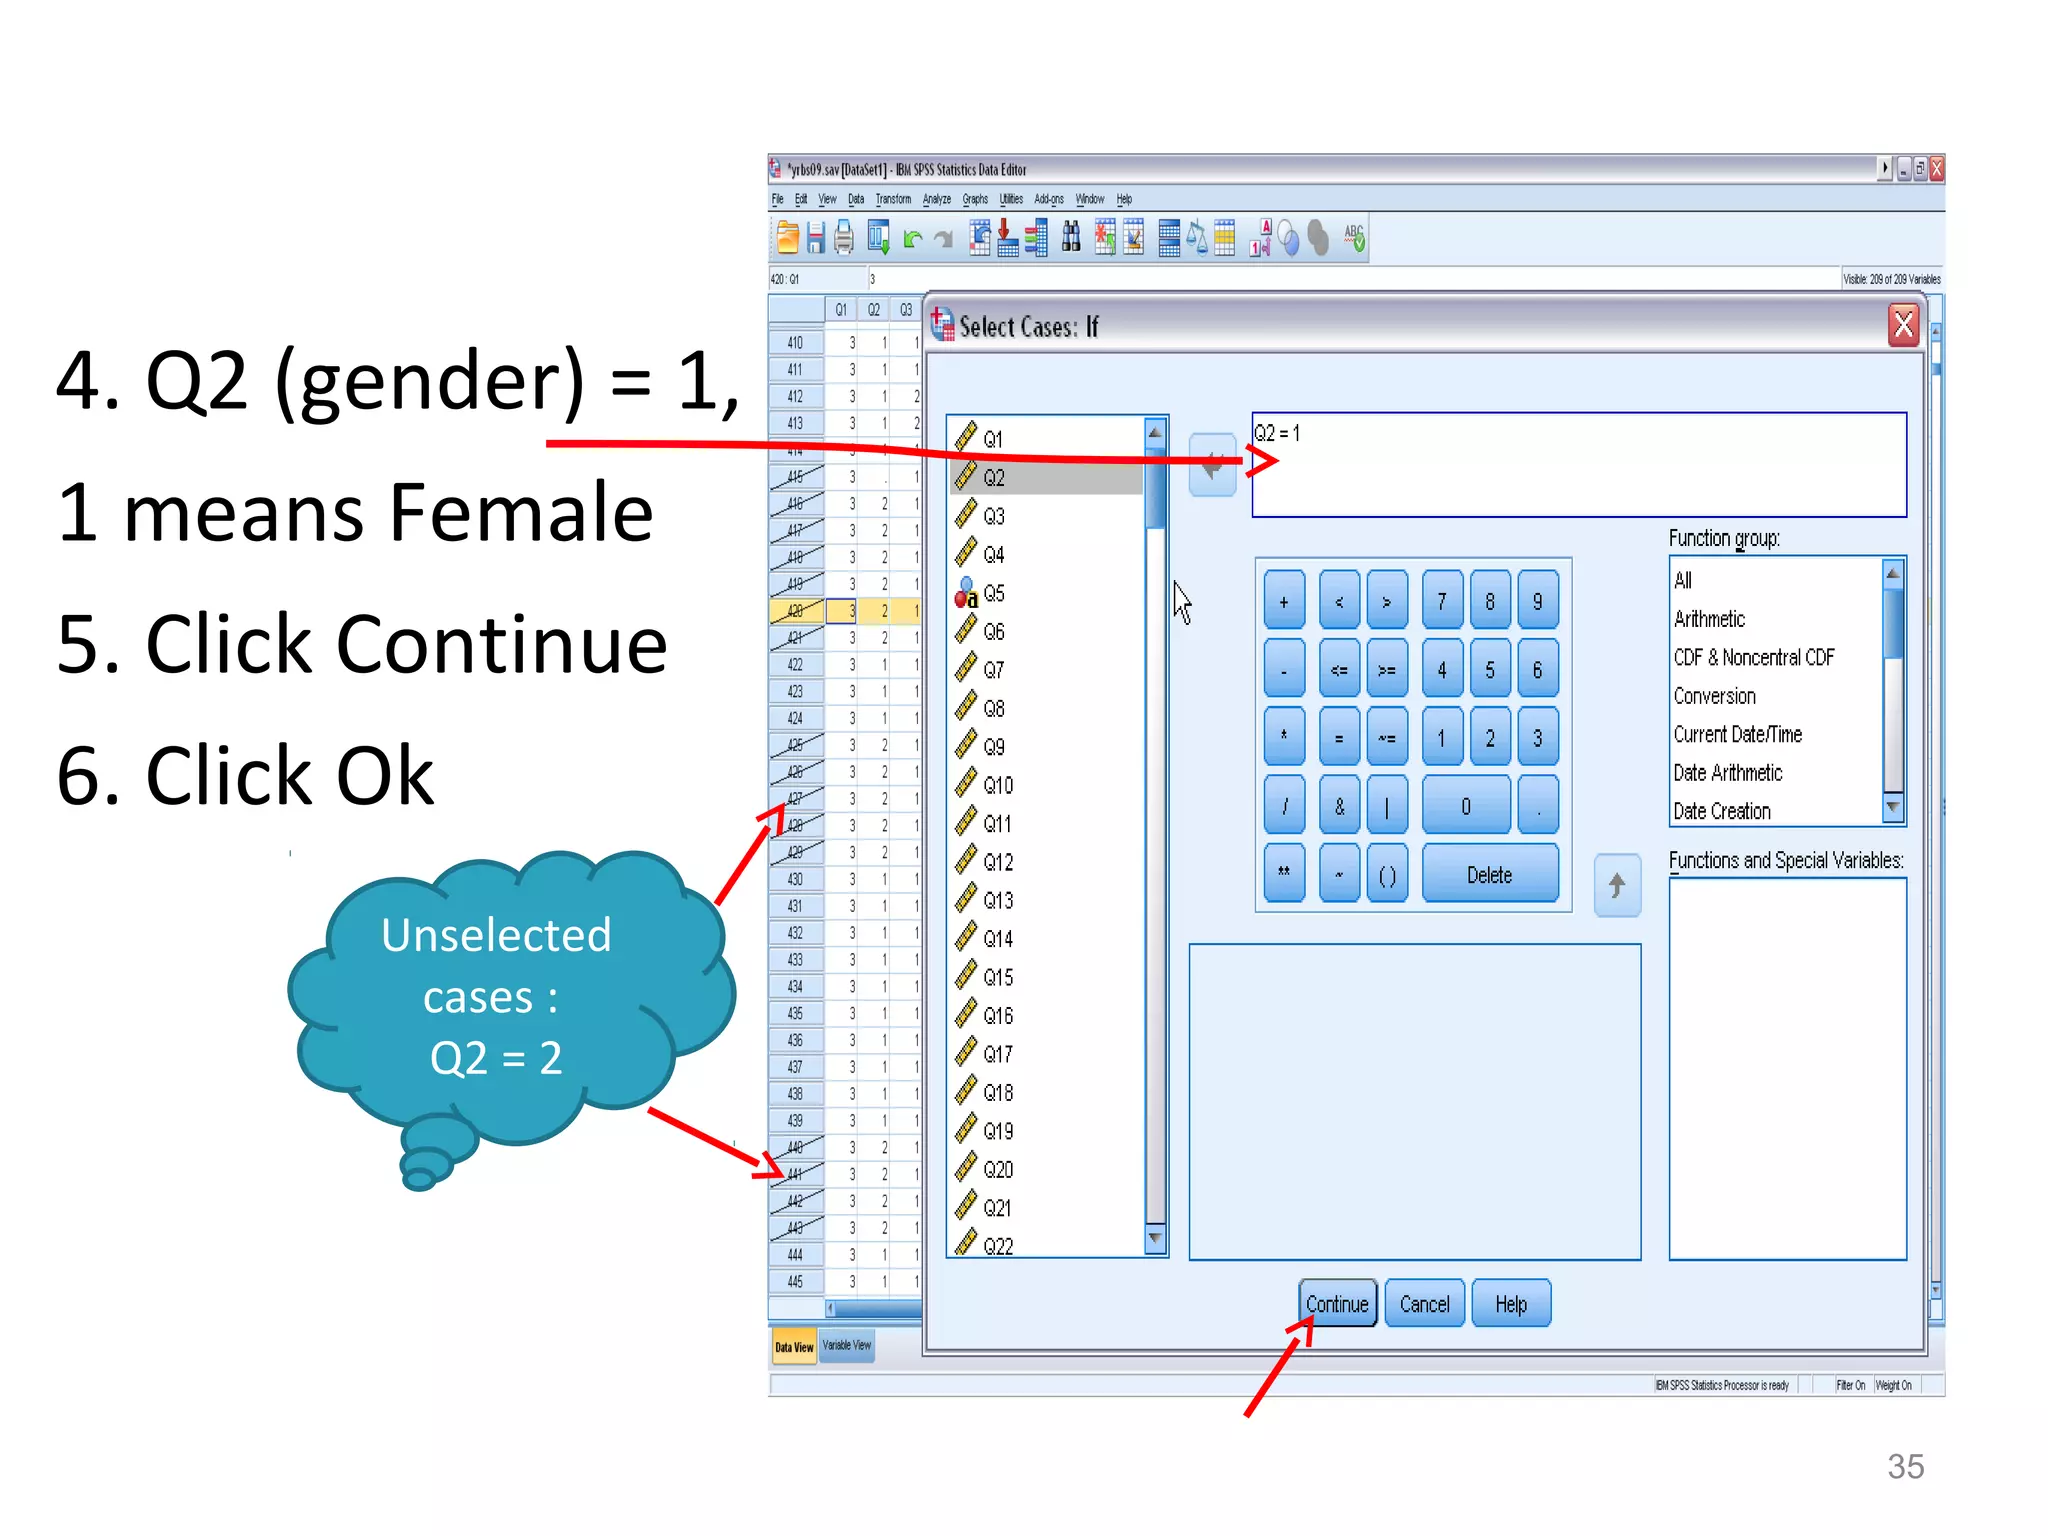
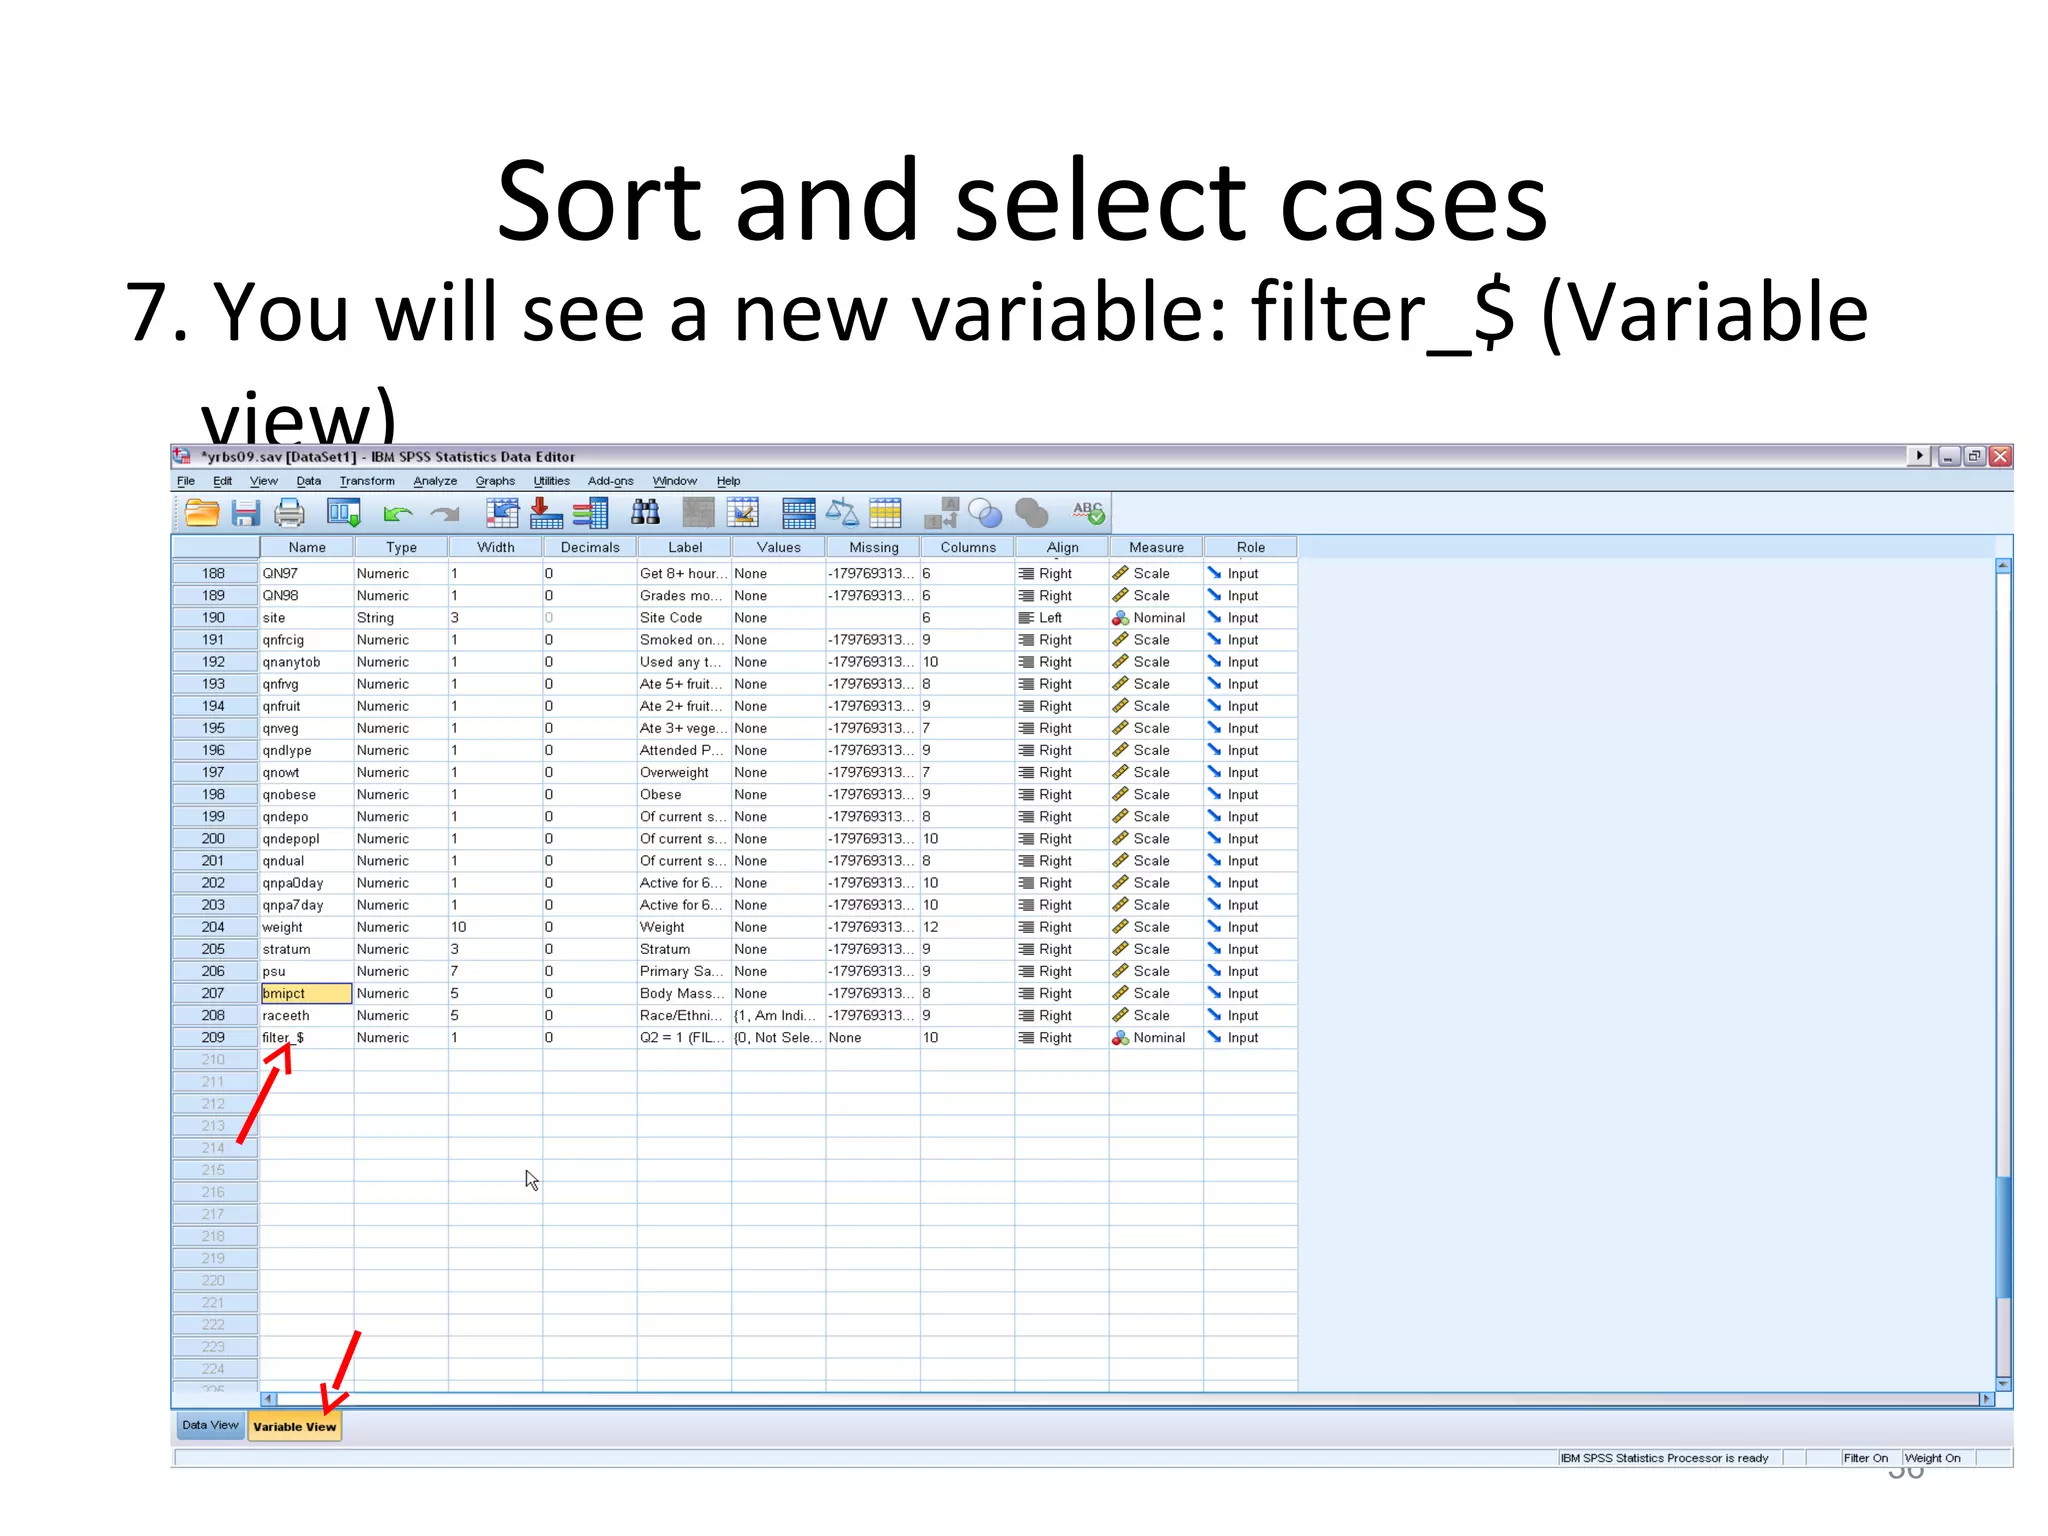
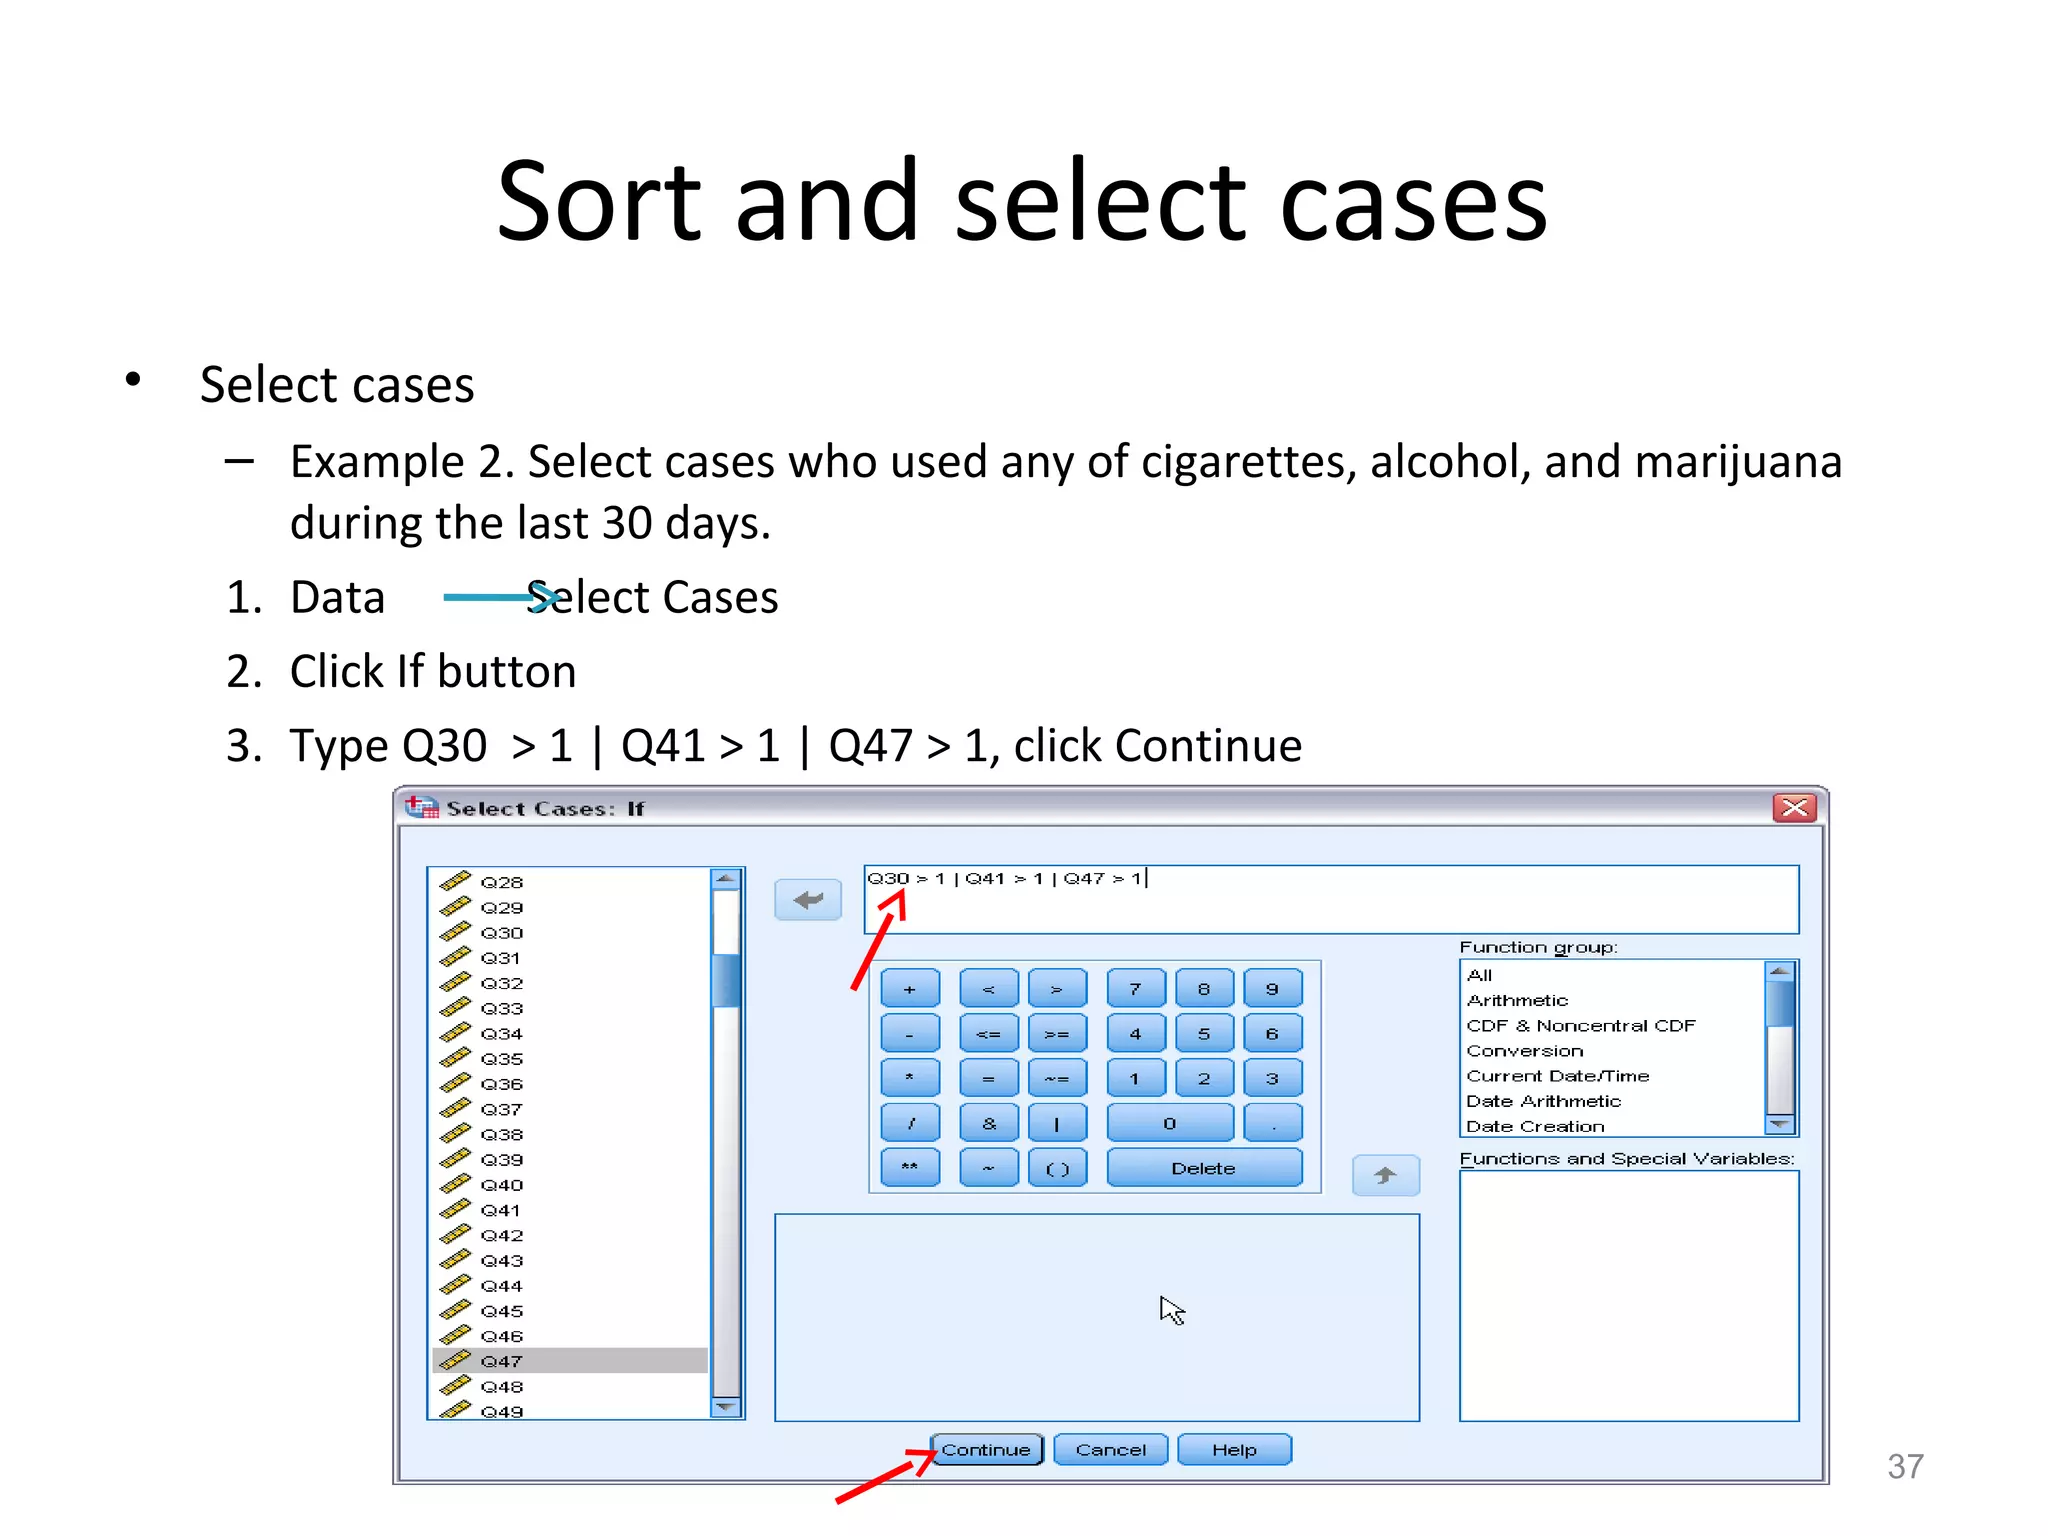
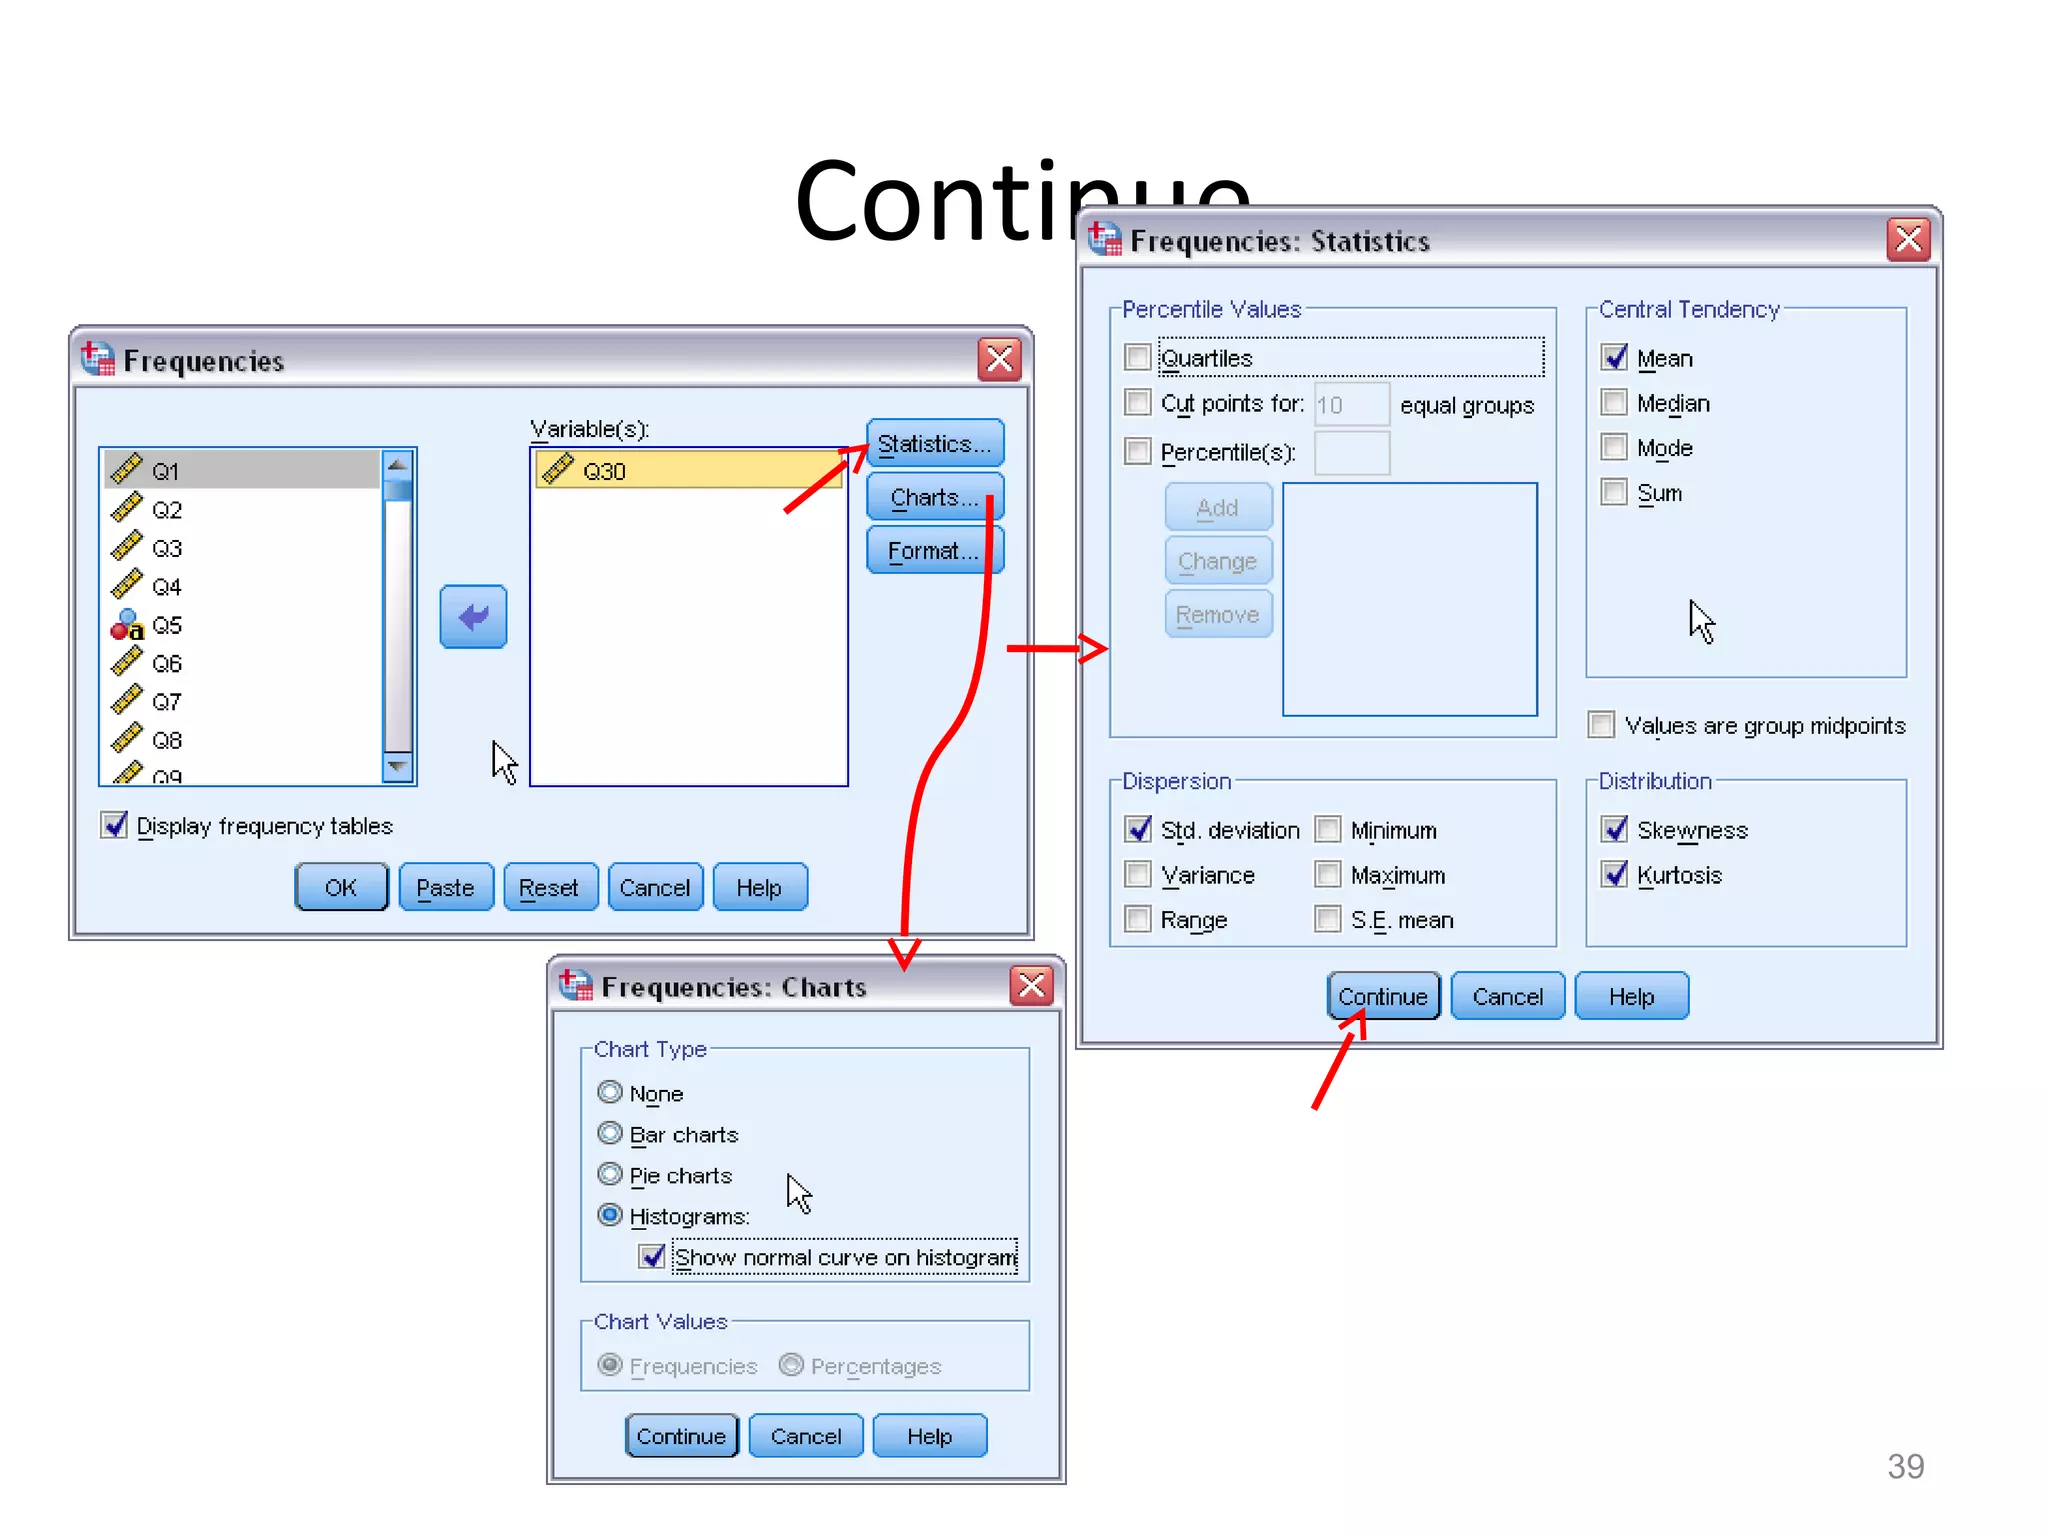
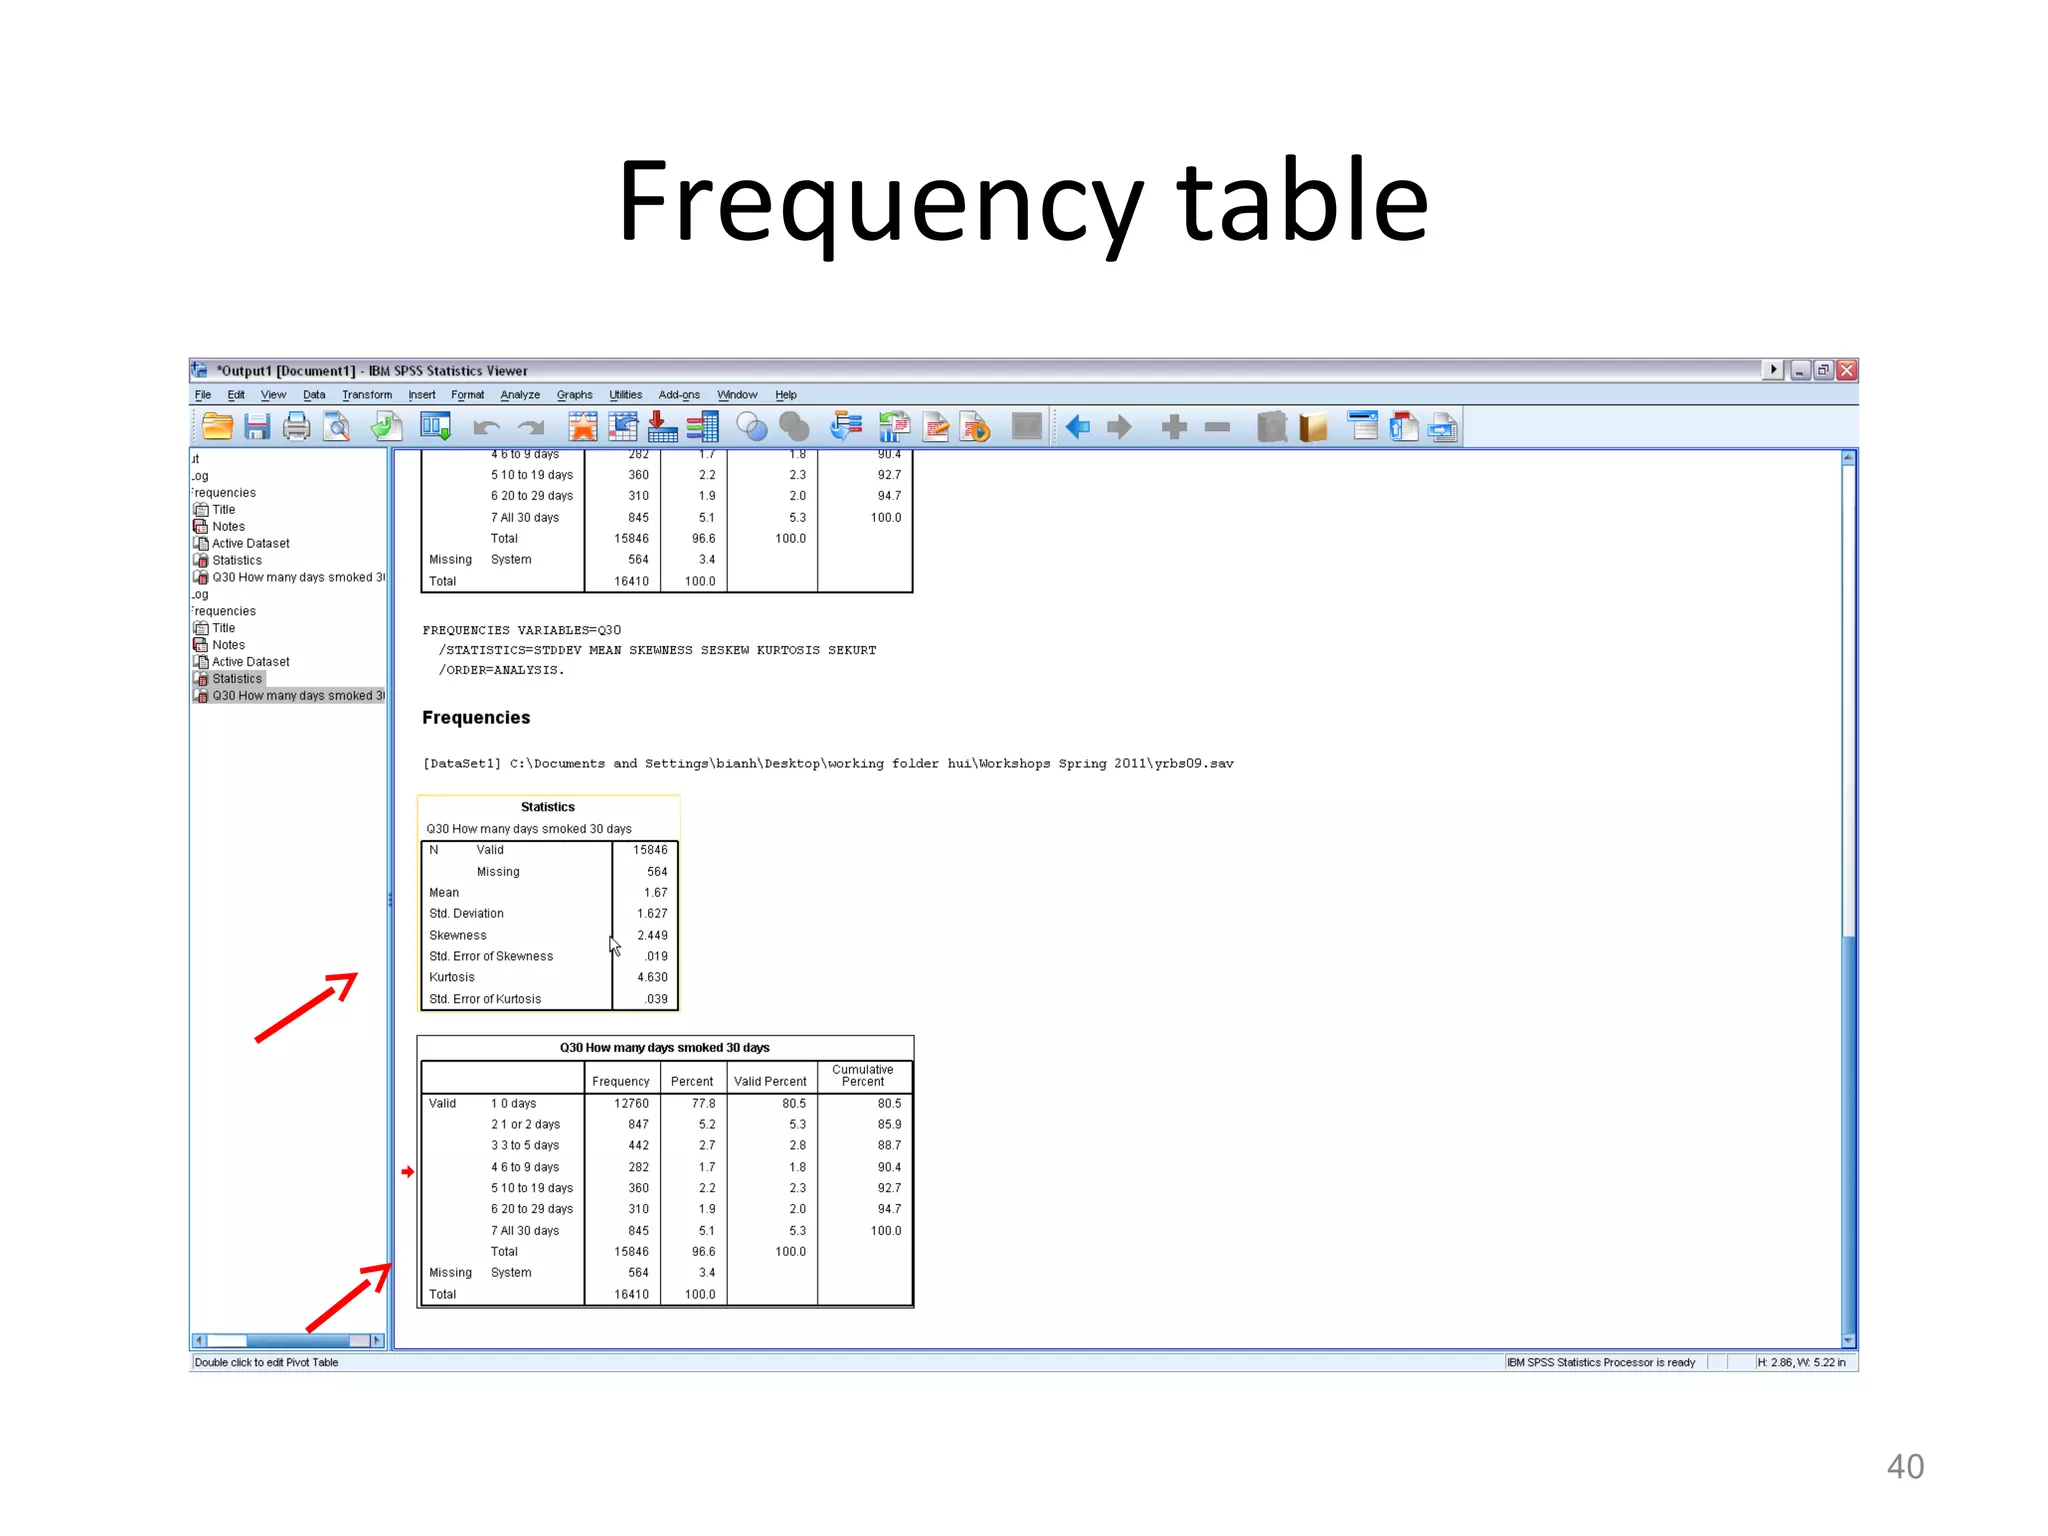
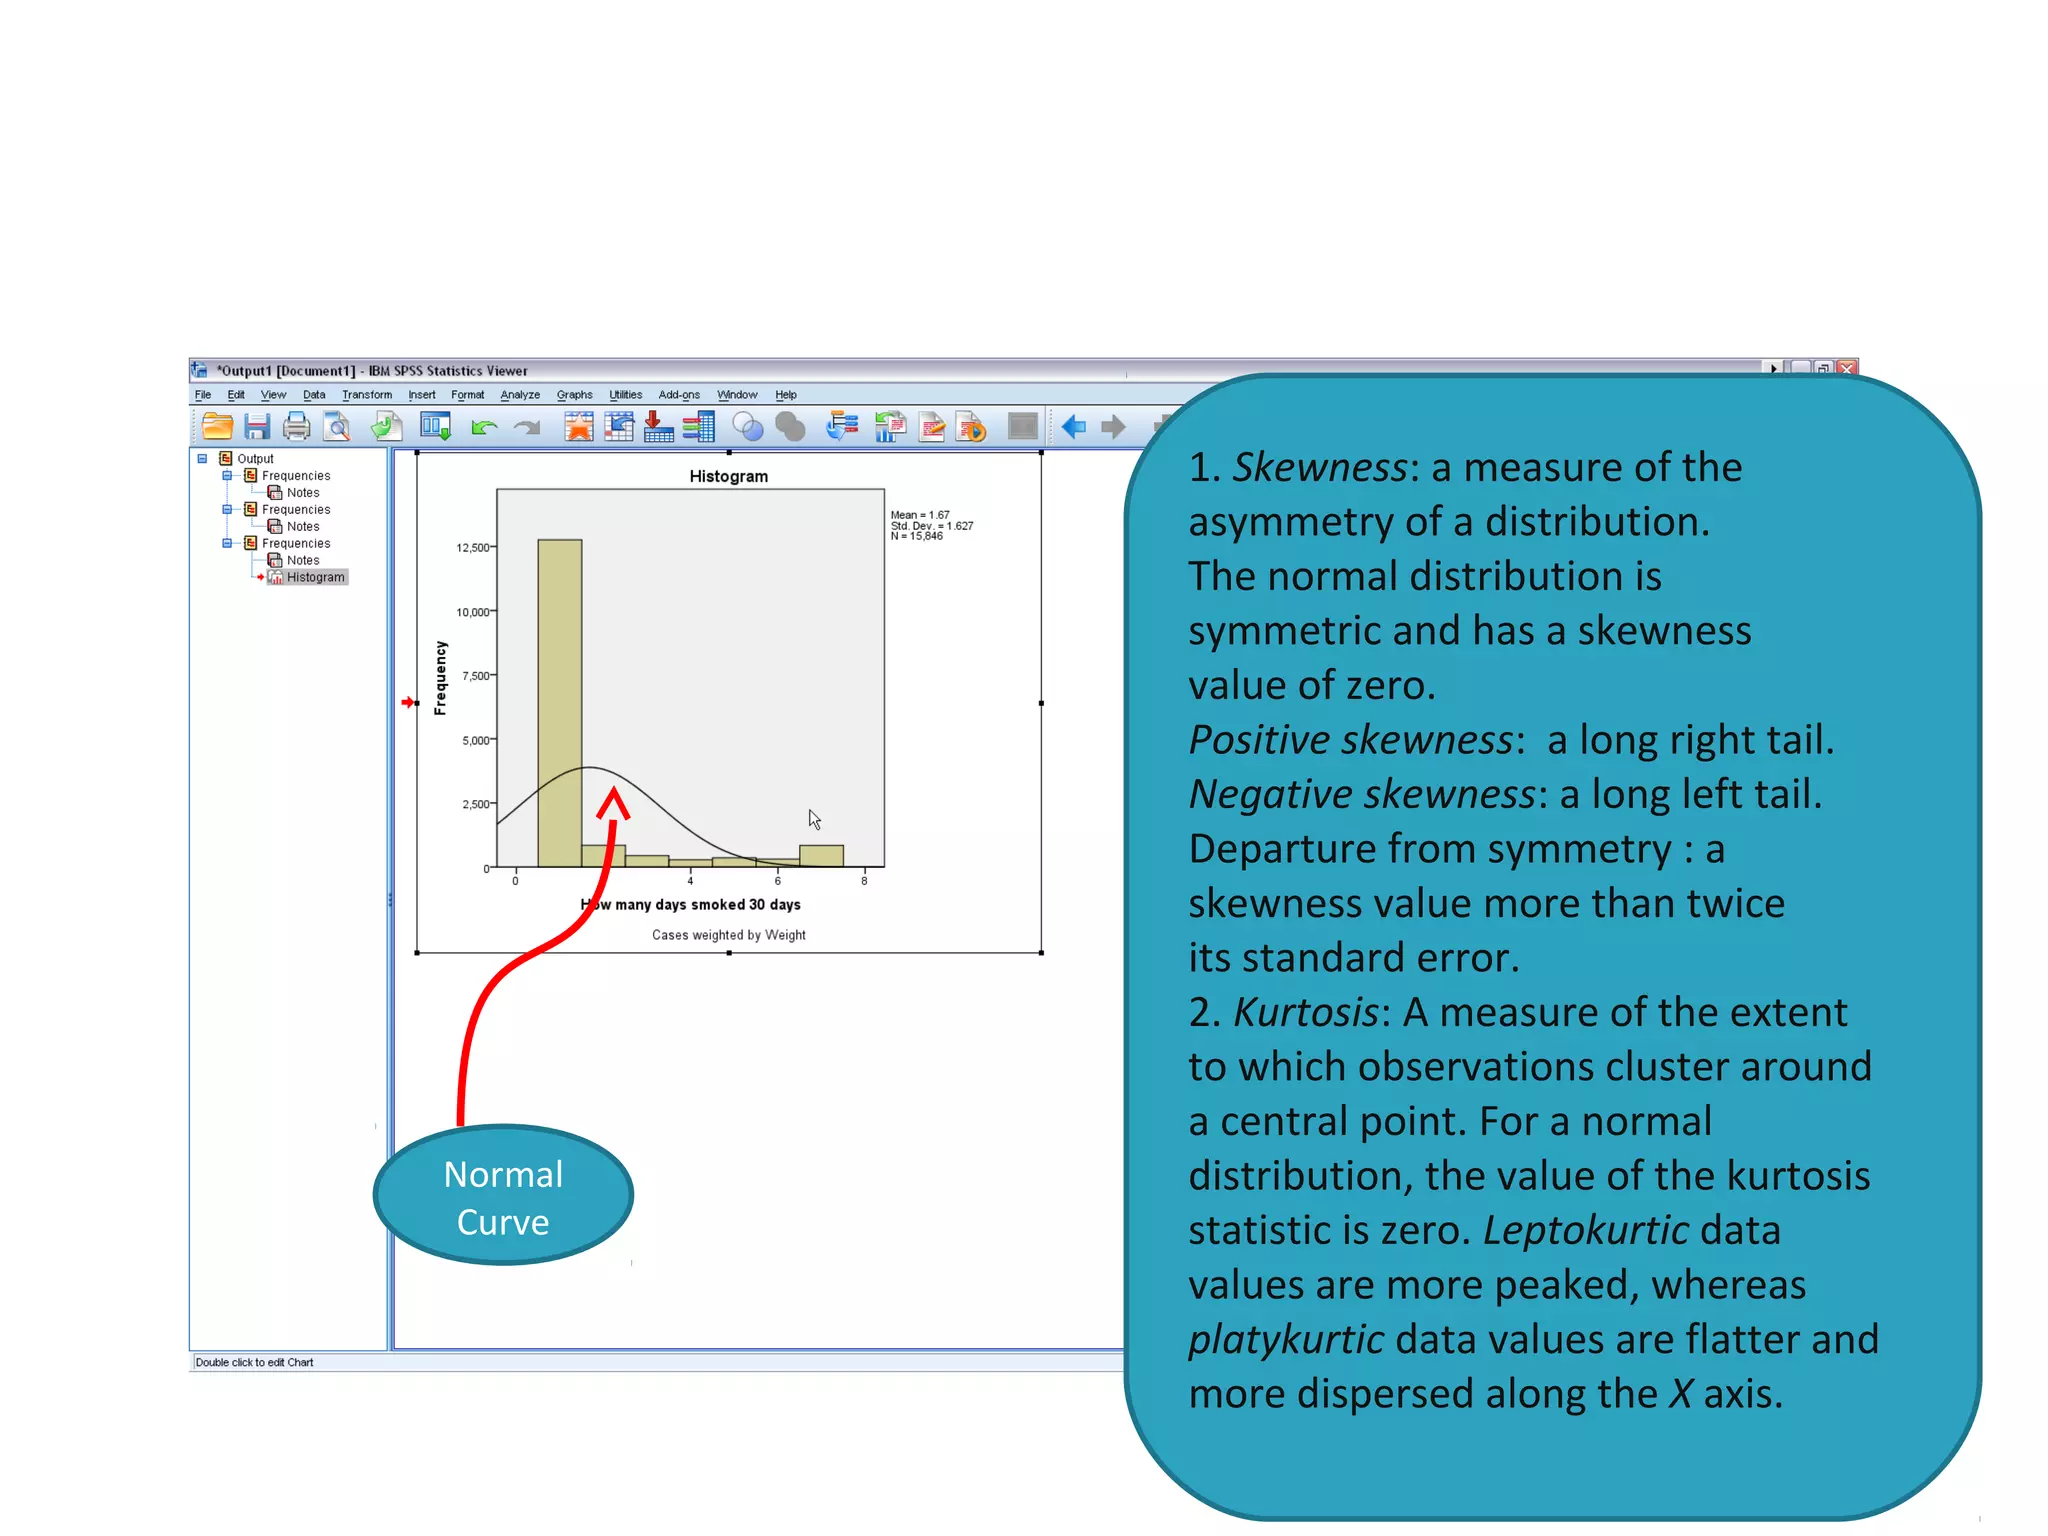
SPSS for Beginners 
1
What is in this workshop 
• SPSS interface: data view and variable view 
• How to enter data in SPSS 
• How to import external data into SPSS 
• How to clean and edit data 
• How to transform variables 
• How to sort and select cases 
• How to get descriptive statistics 
2
Data used in the workshop 
• We use 2009 Youth Risk Behavior Surveillance 
System (YRBSS, CDC) as an example. 
– YRBSS monitors priority health-risk behaviors and 
the prevalence of obesity and asthma among 
youth and young adults. 
– The target population is high school students 
– Multiple health behaviors include drinking, 
smoking, exercise, eating habits, etc. 
3
SPSS interface 
• Data view 
– The place to enter data 
– Columns: variables 
– Rows: records 
• Variable view 
– The place to enter variables 
– List of all variables 
– Characteristics of all variables 
4
Before the data entry 
• You need a code book/scoring guide 
• You give ID number for each case (NOT real 
identification numbers of your subjects) if you 
use paper survey. 
• If you use online survey, you need something 
to identify your cases. 
• You also can use Excel to do data entry. 
5
Example of a code book 
6 
A code book is about how you code your 
variables. What are in code book? 
1.Variable names 
2.Values for each response option 
3.How to recode variables
Enter data in SPSS 19.0 
7 
Columns: 
variables 
Rows: cases 
Under Data 
View
Enter variables 
8 
1. Click this 
Window 
1. Click Variable View 
2. Type variable name under 
Name column (e.g. Q01). 
NOTE: Variable name can be 64 
bytes long, and the first 
character must be a letter or 
one of the characters @, #, or 
$. 
3. Type: Numeric, string, etc. 
4. Label: description of variables. 
2. Type 
variable name 
3. Type: 
numeric or 
string 
4. Description 
of variable
Enter variables 
9 
Based on your 
code book!
Enter cases 
10 
Under Data 
View 
1. Two variables in the data set. 
2. They are: Code and Q01. 
3. Code is an ID variable, used to identify individual case 
(NOT people’s real IDs). 
4. Q01 is about participants’ ages: 1 = 12 years or 
younger, 2 = 13 years, 3 = 14 years…
Import data from Excel 
• Select File Open Data 
• Choose Excel as file type 
• Select the file you want to import 
• Then click Open 
11
Open Excel files in SPSS 
12
Import data from CVS file 
• CVS is a comma-separated values file. 
• If you use Qualtrics to collect data (online 
survey), you will get a CVS data file. 
• Select File Open Data 
• Choose All files as file type 
• Select the file you want to import 
• Then click Open 
13
Continue 
14
Continue 
15
Continue 
16
Continue 
17
Continue 
18
Continue 
19
Continue 
20 
Save this file 
as SPSS data
Clean data after import data files 
• Key in values and labels for each variable 
• Run frequency for each variable 
• Check outputs to see if you have variables 
with wrong values. 
• Check missing values and physical surveys if 
you use paper surveys, and make sure they 
are real missing. 
• Sometimes, you need to recode string 
variables into numeric variables 
21
Continue 
22 
Wrong 
entries
Variable transformation 
• Recode variables 
23 
1. Select Transform Recode 
into Different Variables 
2. Select variable that you want 
to transform (e.g. Q20): we 
want 
1= Yes and 0 = No 
3. Click Arrow button to put 
your variable into the right 
window 
4. Under Output Variable: type 
name for new variable and 
label, then click Change 
5. Click Old and New Values
Continue 
6. Type 1 under Old Value 
and 1 under New Value, 
click Add. Then type 2 
under Old Value, and 0 
under New Value, click 
Add. 
7. Click Continue after 
finish all the changes. 
8. Click Ok 
24
Variable transformation 
Compute variable (use YRBSS 2009 data) 
Example 1. Create a new variable: drug_use (During the past 30 
days, any use of cigarettes, alcohol, and marijuana is defined as 
use, else as non-use). There are two categories for the new 
variable (use vs. non-use). Coding: 1= Use and 0 = Non-use 
1. Use Q30, Q41, and Q47 from 2009 YRBSS survey 
2. Non-users means those who answered 0 days/times to all three 
questions. 
3. Go to Transform Compute Variable 
25
Continue 
4. Type “drug_use” under 
Target Variable 
5. Type “0” under Numeric 
Expression. 0 means 
Non-use 
6. Click If button. 
26
Continue 
7. With help of that 
Arrow button, type 
Q30= 1 & Q41 = 1 & Q47= 1 
then click Continue 
8. Do the same thing for 
Use, but the numeric 
expression is different: 
Q30> 1 | Q41> 1 | Q47>1 
27 
AND OR
Continue 
9. Click OK 
10. After click OK, 
a small window asks 
if you want to 
change existing 
variable because 
drug_use was already 
created when you 
first define non-use. 
11. Click ok. 
28
Continue 
Compute variables 
Example 2. Create a new variable drug_N that 
assesses total number of drugs that adolescents used 
during the last 30 days. 
1.Use Q30 (cigarettes), 41 (alcohol), 47 (marijuana), and 
50 (cocaine). The number of drugs used should be 
between 0 and 4. 
2.First, recode all four variables into two categories: 0 = 
non-use (0 days), 1 = use (at least 1 day/time) 
3.Four variables have 6 or 7 categories 
29
Continue 
4. Recode four variables: 1 (old) = 0 (new), 2-6/7 (old) = 1 (New). 
5. Then select Transform Compute Variable 
30
Continue 
6. Type drug_N under Target Variable 
7. Numeric Expression: SUM (Q30r,Q41r,Q47r,Q50r) 
8. Click OK 
31
Continue 
• Compute variables 
– Example 3: Convert string variable into numeric 
variable 
32 
1. Enter 1 at Numeric 
Expression. 
2. Click If button and type 
Q2 = ‘Female’ 
3. Then click Ok. 
4. Enter 2 at Numeric 
Expression. 
5. Click If button and type 
Q2 = ‘Male’ 
6. Then click Ok
Sort and select cases 
• Sort cases by variables: Data Sort Cases 
• You can use Sort Cases to find missing. 
33
Sort and select cases 
• Select cases 
– Example 1. Select Females for analysis. 
1.Go to Data Select Cases 
2.Under Select: check the second one 
3.Click If button 
34
Continue 
4. Q2 (gender) = 1, 
1 means Female 
5. Click Continue 
6. Click Ok 
35 
Unselected 
cases : 
Q2 = 2
Sort and select cases 
7. You will see a new variable: filter_$ (Variable 
view) 
36
Sort and select cases 
• Select cases 
– Example 2. Select cases who used any of cigarettes, alcohol, and marijuana 
during the last 30 days. 
1. Data Select Cases 
2. Click If button 
3. Type Q30 > 1 | Q41 > 1 | Q47 > 1, click Continue 
37
Basic statistical analysis 
• Descriptive statistics 
– Purposes: 
1.Find wrong entries 
2.Have basic knowledge about the sample and 
targeted variables in a study 
3.Summarize data 
Analyze Descriptive statistics Frequency 
38
Continue 
39
Frequency table 
40
41 
1. Skewness: a measure of the 
asymmetry of a distribution. 
The normal distribution is 
symmetric and has a skewness 
value of zero. 
Positive skewness: a long right tail. 
Negative skewness: a long left tail. 
Departure from symmetry : a 
skewness value more than twice 
its standard error. 
2. Kurtosis: A measure of the extent 
to which observations cluster around 
a central point. For a normal 
distribution, the value of the kurtosis 
statistic is zero. Leptokurtic data 
values are more peaked, whereas 
platykurtic data values are flatter and 
more dispersed along the X axis. 
Normal 
Curve
42

Spss beginners

  • 1.
  • 2.
    What is inthis workshop • SPSS interface: data view and variable view • How to enter data in SPSS • How to import external data into SPSS • How to clean and edit data • How to transform variables • How to sort and select cases • How to get descriptive statistics 2
  • 3.
    Data used inthe workshop • We use 2009 Youth Risk Behavior Surveillance System (YRBSS, CDC) as an example. – YRBSS monitors priority health-risk behaviors and the prevalence of obesity and asthma among youth and young adults. – The target population is high school students – Multiple health behaviors include drinking, smoking, exercise, eating habits, etc. 3
  • 4.
    SPSS interface •Data view – The place to enter data – Columns: variables – Rows: records • Variable view – The place to enter variables – List of all variables – Characteristics of all variables 4
  • 5.
    Before the dataentry • You need a code book/scoring guide • You give ID number for each case (NOT real identification numbers of your subjects) if you use paper survey. • If you use online survey, you need something to identify your cases. • You also can use Excel to do data entry. 5
  • 6.
    Example of acode book 6 A code book is about how you code your variables. What are in code book? 1.Variable names 2.Values for each response option 3.How to recode variables
  • 7.
    Enter data inSPSS 19.0 7 Columns: variables Rows: cases Under Data View
  • 8.
    Enter variables 8 1. Click this Window 1. Click Variable View 2. Type variable name under Name column (e.g. Q01). NOTE: Variable name can be 64 bytes long, and the first character must be a letter or one of the characters @, #, or $. 3. Type: Numeric, string, etc. 4. Label: description of variables. 2. Type variable name 3. Type: numeric or string 4. Description of variable
  • 9.
    Enter variables 9 Based on your code book!
  • 10.
    Enter cases 10 Under Data View 1. Two variables in the data set. 2. They are: Code and Q01. 3. Code is an ID variable, used to identify individual case (NOT people’s real IDs). 4. Q01 is about participants’ ages: 1 = 12 years or younger, 2 = 13 years, 3 = 14 years…
  • 11.
    Import data fromExcel • Select File Open Data • Choose Excel as file type • Select the file you want to import • Then click Open 11
  • 12.
    Open Excel filesin SPSS 12
  • 13.
    Import data fromCVS file • CVS is a comma-separated values file. • If you use Qualtrics to collect data (online survey), you will get a CVS data file. • Select File Open Data • Choose All files as file type • Select the file you want to import • Then click Open 13
  • 14.
  • 15.
  • 16.
  • 17.
  • 18.
  • 19.
  • 20.
    Continue 20 Savethis file as SPSS data
  • 21.
    Clean data afterimport data files • Key in values and labels for each variable • Run frequency for each variable • Check outputs to see if you have variables with wrong values. • Check missing values and physical surveys if you use paper surveys, and make sure they are real missing. • Sometimes, you need to recode string variables into numeric variables 21
  • 22.
  • 23.
    Variable transformation •Recode variables 23 1. Select Transform Recode into Different Variables 2. Select variable that you want to transform (e.g. Q20): we want 1= Yes and 0 = No 3. Click Arrow button to put your variable into the right window 4. Under Output Variable: type name for new variable and label, then click Change 5. Click Old and New Values
  • 24.
    Continue 6. Type1 under Old Value and 1 under New Value, click Add. Then type 2 under Old Value, and 0 under New Value, click Add. 7. Click Continue after finish all the changes. 8. Click Ok 24
  • 25.
    Variable transformation Computevariable (use YRBSS 2009 data) Example 1. Create a new variable: drug_use (During the past 30 days, any use of cigarettes, alcohol, and marijuana is defined as use, else as non-use). There are two categories for the new variable (use vs. non-use). Coding: 1= Use and 0 = Non-use 1. Use Q30, Q41, and Q47 from 2009 YRBSS survey 2. Non-users means those who answered 0 days/times to all three questions. 3. Go to Transform Compute Variable 25
  • 26.
    Continue 4. Type“drug_use” under Target Variable 5. Type “0” under Numeric Expression. 0 means Non-use 6. Click If button. 26
  • 27.
    Continue 7. Withhelp of that Arrow button, type Q30= 1 & Q41 = 1 & Q47= 1 then click Continue 8. Do the same thing for Use, but the numeric expression is different: Q30> 1 | Q41> 1 | Q47>1 27 AND OR
  • 28.
    Continue 9. ClickOK 10. After click OK, a small window asks if you want to change existing variable because drug_use was already created when you first define non-use. 11. Click ok. 28
  • 29.
    Continue Compute variables Example 2. Create a new variable drug_N that assesses total number of drugs that adolescents used during the last 30 days. 1.Use Q30 (cigarettes), 41 (alcohol), 47 (marijuana), and 50 (cocaine). The number of drugs used should be between 0 and 4. 2.First, recode all four variables into two categories: 0 = non-use (0 days), 1 = use (at least 1 day/time) 3.Four variables have 6 or 7 categories 29
  • 30.
    Continue 4. Recodefour variables: 1 (old) = 0 (new), 2-6/7 (old) = 1 (New). 5. Then select Transform Compute Variable 30
  • 31.
    Continue 6. Typedrug_N under Target Variable 7. Numeric Expression: SUM (Q30r,Q41r,Q47r,Q50r) 8. Click OK 31
  • 32.
    Continue • Computevariables – Example 3: Convert string variable into numeric variable 32 1. Enter 1 at Numeric Expression. 2. Click If button and type Q2 = ‘Female’ 3. Then click Ok. 4. Enter 2 at Numeric Expression. 5. Click If button and type Q2 = ‘Male’ 6. Then click Ok
  • 33.
    Sort and selectcases • Sort cases by variables: Data Sort Cases • You can use Sort Cases to find missing. 33
  • 34.
    Sort and selectcases • Select cases – Example 1. Select Females for analysis. 1.Go to Data Select Cases 2.Under Select: check the second one 3.Click If button 34
  • 35.
    Continue 4. Q2(gender) = 1, 1 means Female 5. Click Continue 6. Click Ok 35 Unselected cases : Q2 = 2
  • 36.
    Sort and selectcases 7. You will see a new variable: filter_$ (Variable view) 36
  • 37.
    Sort and selectcases • Select cases – Example 2. Select cases who used any of cigarettes, alcohol, and marijuana during the last 30 days. 1. Data Select Cases 2. Click If button 3. Type Q30 > 1 | Q41 > 1 | Q47 > 1, click Continue 37
  • 38.
    Basic statistical analysis • Descriptive statistics – Purposes: 1.Find wrong entries 2.Have basic knowledge about the sample and targeted variables in a study 3.Summarize data Analyze Descriptive statistics Frequency 38
  • 39.
  • 40.
  • 41.
    41 1. Skewness:a measure of the asymmetry of a distribution. The normal distribution is symmetric and has a skewness value of zero. Positive skewness: a long right tail. Negative skewness: a long left tail. Departure from symmetry : a skewness value more than twice its standard error. 2. Kurtosis: A measure of the extent to which observations cluster around a central point. For a normal distribution, the value of the kurtosis statistic is zero. Leptokurtic data values are more peaked, whereas platykurtic data values are flatter and more dispersed along the X axis. Normal Curve
  • 42.