Download to read offline

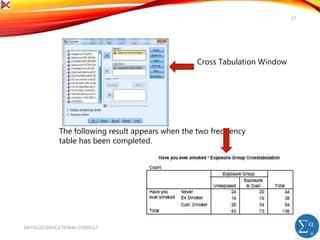
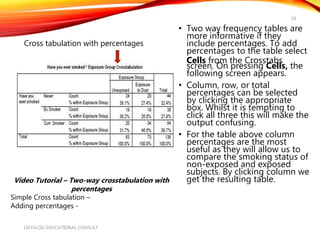
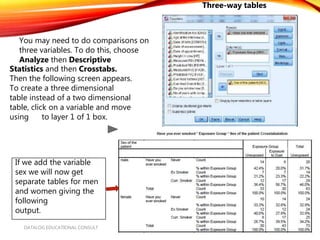


The document introduces SPSS for data management and descriptive statistics, covering file saving, backup, and retrieval processes. It details various techniques for generating descriptive statistics such as frequency analyses and cross-tabulations to identify data inconsistencies. Additionally, it provides step-by-step guidance for performing these analyses within the SPSS environment.


![Final diary products_as_carriers_of_probiotics_and_prebiotics[1]](https://cdn.slidesharecdn.com/ss_thumbnails/finaldiaryproductsascarriersofprobioticsandprebiotics1-210315173947-thumbnail.jpg?width=640&height=640&fit=bounds)


![谷歌留痕技术教程[ 𝙩𝙤𝙥 𝟮𝟯𝟯. 𝙘 𝙤𝙢 ]](https://cdn.slidesharecdn.com/ss_thumbnails/top233-260130173900-2eb784f9-thumbnail.jpg?width=640&height=640&fit=bounds)