Downloaded 75 times
![Redox Reactions in Aqueous
Media
[Paper 2- Co-ordination Chemistry]
- Jaiswal Priyanka Balister
M.Sc- II [Inorganic]
Semester III
Mithibai College](https://image.slidesharecdn.com/redoxreactionsinaqueousmedia-170615161010/75/Redox-reactions-in-aqueous-media-1-2048.jpg)


![ Latimer diagram for Manganese [acidic
medium]
The Latimer diagram for Mn illustrates its standard reduction potentials (in 1M
HCl) in oxidation states from +7 to 0.
It compresses into shorthand notation all the standard potentials for redox
reactions of element Mn.
Values for multi-electron reactions can be also calculated by first adding ∆Gº
(nFEº) values and then dividing by the total no of electrons.](https://image.slidesharecdn.com/redoxreactionsinaqueousmedia-170615161010/75/Redox-reactions-in-aqueous-media-4-2048.jpg)


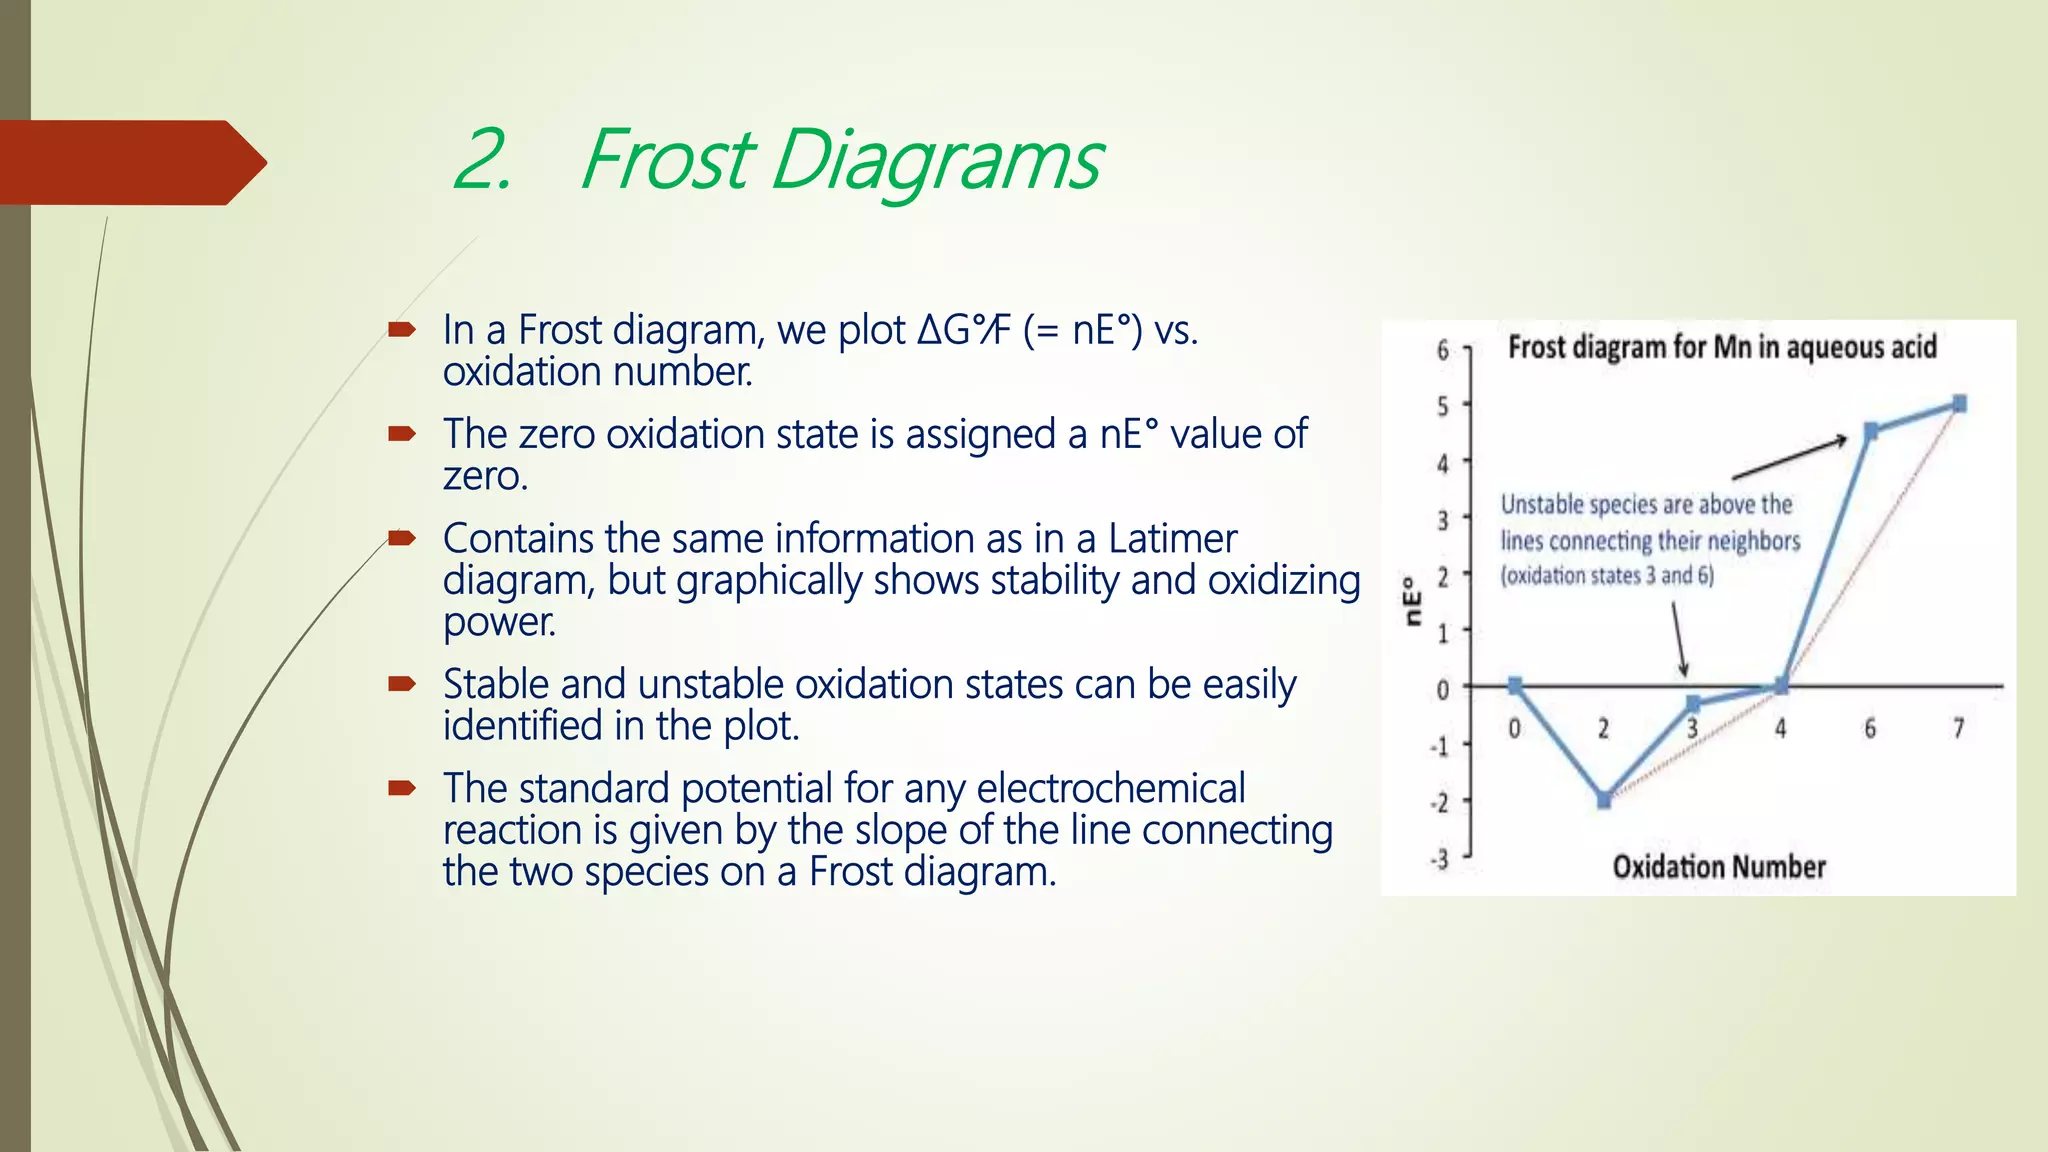


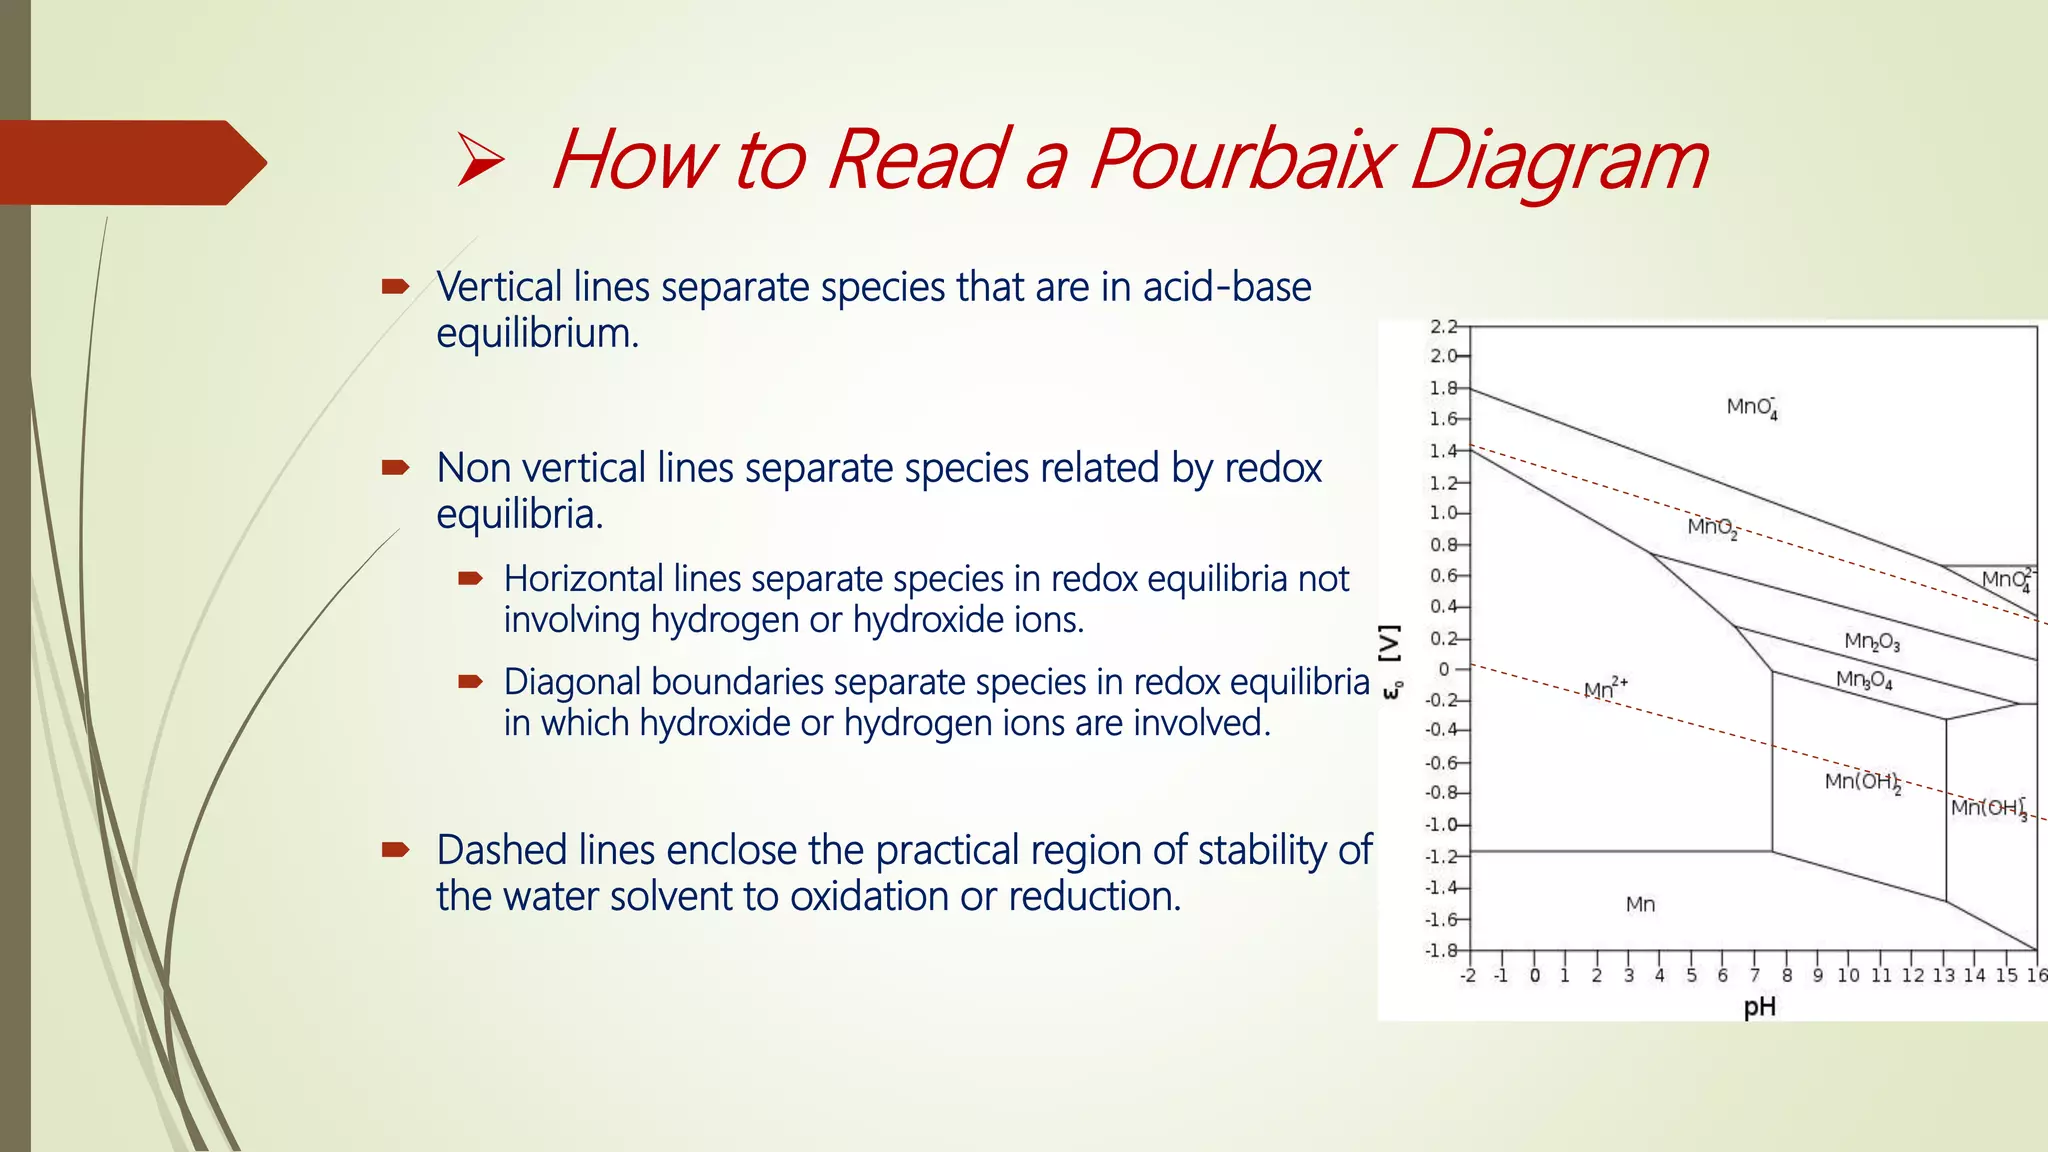


1) Latimer, Frost, and Pourbaix diagrams are used to predict and summarize redox reactions in aqueous solutions. Latimer diagrams list standard potentials for step-wise reductions while Frost diagrams plot free energy vs oxidation state. Pourbaix diagrams show predominant species as a function of both potential and pH. 2) Latimer and Frost diagrams are restricted to pH 0 or 14 while Pourbaix diagrams cover the full pH range from 0-14. Pourbaix diagrams indicate the most stable species under given conditions and can identify strong oxidizers, reducers, and species prone to disproportionation. 3) These diagram types are useful tools for predicting thermodynamic favorability and identifying stable vs unstable oxidation states of
![Theory of coordination_compounds[1]](https://cdn.slidesharecdn.com/ss_thumbnails/theoryofcoordinationcompounds1-171130080838-thumbnail.jpg?width=640&height=640&fit=bounds)


