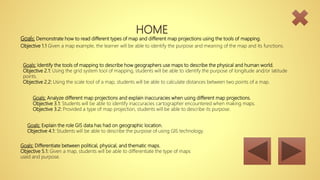
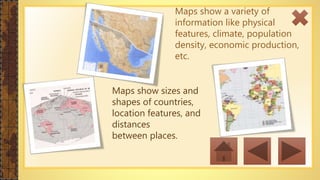
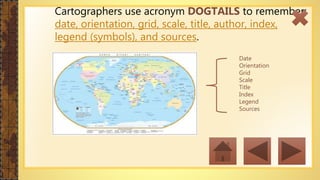
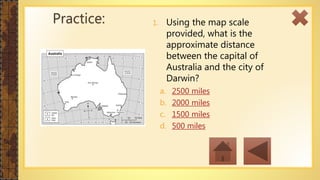
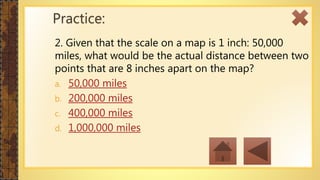
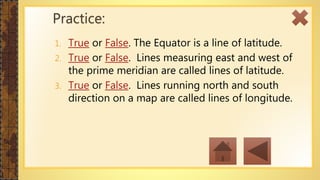
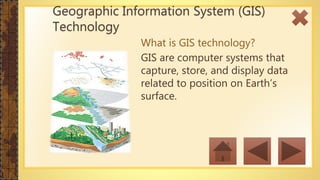
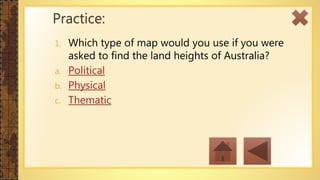
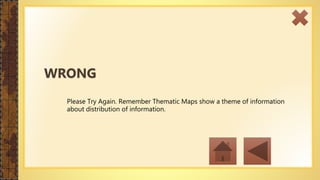
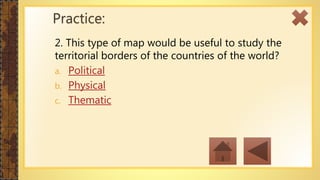
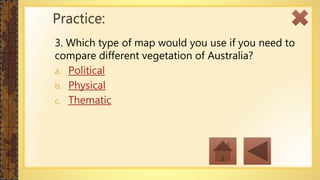
Instructional Module intended for first year high school students
for the purpose of refreshing prior map knowledge.
Map Reading Skills
Rebekah Hannon
EDET 722-J61
April 30, 2017
Goals: Demonstrate how to read different types of map and different map projections using the tools of mapping.
Objective 1.1 Given a map example, the learner will be able to identify the purpose and meaning of the map and its functions.
HOME
Goals: Identify the tools of mapping to describe how geographers use maps to describe the physical and human world.
Objective 2.1: Using the grid system tool of mapping, students will be able to identify the purpose of longitude and/or latitude
points.
Objective 2.2: Using the scale tool of a map, students will be able to calculate distances between two points of a map.
Goals: Analyze different map projections and explain inaccuracies when using different map projections.
Objective 3.1: Students will be able to identify inaccuracies cartographer encountered when making maps.
Objective 3.2: Provided a type of map projection, students will be able to describe its purpose.
Goals: Explain the role GIS data has had on geographic location.
Objective 4.1: Students will be able to describe the purpose of using GIS technology.
Goals: Differentiate between political, physical, and thematic maps.
Objective 5.1: Given a map, students will be able to differentiate the type of maps
used and purpose.
This map skills unit should be completed in
approximately 20 minutes. As you work through the unit,
you will complete practice exercises. At the completion
of the unit, you will complete a Posttest over the entire
module.
To move through each slide, use the buttons in the
bottom right corner to move forward or backwards
through the slides or return to the home screen. Use the
“X” in the upper right
corner to exit the module.
Navigation
Essential Background Knowledge
Oxford dictionary defines a
map as a diagrammatic
representation of an area of
land or sea showing physical
features, cities, roads, etc.
Maps show a variety of
information like physical
features, climate, population
density, economic production,
etc.
Maps show sizes and
shapes of countries,
location features, and
distances
between places.
Maps are visual Representation of data
Created by cartographers (map maker)
for many different reasons
1. According to the map,
what do the colors on
the map represent:
Practice:
a. Different regions of the country
b. Different numbers
c. Different temperatures
d. Political boundaries
THAT IS CORRECT!
Please Try Again, look at the title of the map.
WRONG
2. According to the map
what region of the US, has
the hottest average
temperature in July?
Practice:
a. Northeast
b. East Coast
c. The South
d. Northwest
THAT IS CORRECT!
Please Try Again, look to the map key/legend for help.
WRONG
1. Scale
All maps are scale models of
reality. Scale indicates the
relationship between the
distances on the map and the
actual distances on Earth.
Map Tools
Scale is represented in three different ways on map.
Graphic Scale (Bar
Scale)
Verbal Scale Representative
Horizontal line marked
off in miles, kilometers,
or other unit of measure
A written sentence
expressing distance on
the map to distance on
Earth
No specific unit, scale is
written as a fraction or
ratio.
Legend:
Scroll over the
map legend
to see the
scale of the
map.
Symbols are used by
cartographers to represent
geographic features.
2. Symbols
The map key or legend provides an explanation of the
various symbols.
Grid system on
maps are a series
of crossing lines
that create
squares or
rectangles.
These crossing
lines help people
locate on the map.
Grid System
 Latitude and Longitude lines make up the grid on
many maps.
Latitude and Longitude Lines
Latitude lines run east-west around the globe and
measure how far north or south of the Equator
something is located.
Longitude lines run
north, from pole to
pole measuring how
far east or west of the
Prime Meridian
something is located.
The intersection of latitude and longitude lines,
called coordinates, identify the exact location of a place.
Using the map, what are the
approximate coordinates of
Mexico?
(When you think you know click the
magnifying glass to check your
answer.)
25⁰N, 105⁰E (a negative in front of the #
indicates East direction)
Other features included on maps include date (time
map was made), orientation (compass rose), title
(purpose of map), author (cartographer), index
(exact locations), and sources (information source).
Other Map Tools
Cartographers use acronym DOGTAILS to remember:
date, orientation, grid, scale, title, author, index,
legend (symbols), and sources.
Date
Orientation
Grid
Scale
Title
Index
Legend
Sources
1. Using the map scale
provided, what is the
approximate distance
between the capital of
Australia and the city of
Darwin?
a. 2500 miles
b. 2000 miles
c. 1500 miles
d. 500 miles
Practice:
THAT IS CORRECT!
Please Try Again, use a ruler if needed.
WRONG
2. Given that the scale on a map is 1 inch: 50,000
miles, what would be the actual distance between two
points that are 8 inches apart on the map?
a. 50,000 miles
b. 200,000 miles
c. 400,000 miles
d. 1,000,000 miles
Practice:
THAT IS CORRECT!
Please Try Again, hint multiply.
WRONG
1. True or False. The Equator is a line of latitude.
2. True or False. Lines measuring east and west of
the prime meridian are called lines of latitude.
3. True or False. Lines running north and south
direction on a map are called lines of longitude.
Practice:
THAT IS CORRECT!
THAT IS CORRECT!
Please Try Again.
WRONG
What are map projections?
A means of showing the Earth’s curved surface on a
flat sheet.
Map Projections
Maps don’t represent Earth accurately because
Earth is round, and maps are flat.
Transferring Earth onto a flat piece of paper is called
projection.
Size, shape, and relative location of land masses
change in the process of transfer from the round
globe to a flat surface which is known as distortion.
Every map has some sort of distortion.
The larger the area (small scale map) covered by a
map, the greater the distortion. Large scale maps
have less distortion.
1. Planar Projections show Earth’s surface projected
onto a plane, or flat surface. Planar projections are
most accurate at their centers, where the plane
touches the globe.
(Scroll over the term Planar Projections to see an
example)
3 Types of Map Projections:
2. Conical Projection shows a cone intersecting the
globe along one or two lines of latitude when the
cone is unwrapped and made into a flat map,
latitude lines appear curved and lines of longitude
are straight. Regions between the equator and poles
are represented fairly accurately. Used for most
maps displaying the United States.
(Scroll over the term Conical Projection to see an
example)
Cylindrical (also known as Azimuthal) Projection is a
map projection where the Earth’s surface is projected
onto a tube, or cylinder, shape. Regions near the
equator are fairly accurate in shape and size and areas
around the poles are most distorted.
(Scroll over the term Cylindrical Projection to see an
example)
All map projections must consider two
important factors. Cartographers have to
decide whether the accuracy of the size
of objects is more important or the
accuracy of shape is more important.
Conformal
Maps show
true shapes of
small areas
but distort
size.
Equal area
maps or
equivalent
maps distort
shape and
direction
1. What is a map projection?
a. A way of representing the surface of a celestial
sphere on a flat surface.
b. A way of representing a flat surface on a globe
shape.
c. A way of projecting a map on a wall.
d. A picture of a map.
Practice:
THAT IS CORRECT!
Please Try Again.
WRONG
2. Inaccuracies in distance, shape, direction, and area
of specific maps are problems cartographers
encountered when making maps, these factors make
for ________ of maps.
a. Scales
b. Distortion
c. Legends
d. Grid Systems
Practice:
THAT IS CORRECT!
Please Try Again, remember all maps because of the transfer from a round
object to a flat object have to characteristic.
WRONG
3. A map projection that shows an area between
latitude and longitude equal in size to area on globe
is known as:
a. Cylindrical Projection
b. Conic Projection
c. Azimuthal Projection
d. Equal-Area Projection
Practice:
THAT IS CORRECT!
Please Try Again, think equal in size.
WRONG
4. A map projection that is made when contents of
the globe are moved onto a cone is:
a. Cylindrical Projection
b. Conic Projection
c. Azimuthal Projection
d. Equal-Area Projection
Practice:
THAT IS CORRECT!
Please Try Again, use the clue word found in the question.
WRONG
What is GIS technology?
GIS are computer systems that
capture, store, and display data
related to position on Earth’s
surface.
Geographic Information System (GIS)
Technology
This technology
combines multiple
sources of information
and allows multiple sets
of data to be displayed
on a single map.
GIS technology is used in a variety of occupational
fields and helps with analysis and decision making.
Federal, Local, State Governments: Planning and Organizing
Police Departments: Track Crime
Fire Departments: Finding the shortest route to emergencies
Real Estate Agents: Track properties, property values
Bankers: Track Tax Information
Health Care Professionals: Track the spread of disease and wellness
Communication Technology Companies: Planning Utility Expansions
Meteorologists: Tracking weather forecasting
Etc.
Many different
types of
information can be
compared and
contrasted using
GIS.
• Operational Expenses for Business
• Real Estate Site Selection
• Route/Corridor Selection
• Evacuation Planning
• Conservation, Natural Resource Extraction
• Etc.
Using GIS, one map can display sites that produce
pollution and sites that are sensitive to pollution.
Such a map would show vulnerable areas that are at
risk.
Example 1:
Using GIS, many different characteristics of a city can
be seen in one map. Information about average
income, voting patterns, and demographics can be
compared and contrasted in one map.
Example 2:
1. Geographic Information System (GIS) is defined as:
a. Digital images of Earth acquired by sensors on board orbiting space
borne platforms.
b. A number of different high-tech systems that acquire, analyze, manage,
store, or visualize various types of location-based data.
c. A technology using signals broadcast from satellites for navigation and
position determination on Earth.
d. Computer based mapping, analysis, and retrieval of location-based data.
Practice:
THAT IS CORRECT!
Please Try Again, remember GIS is a laying process.
WRONG
2. True or False. GIS technology is only utilized by
government agencies in planning and organizing their
geographic data.
Practice:
THAT IS CORRECT!
Please Try Again.
WRONG
Cartographers make many different types of maps.
Two major types of map types:
General Reference Maps and Thematic Maps
Map Types
Thematic maps display
information about
distribution or patterns of
human actions. A theme or
topic is emphasized and
information about people
other phenomenon are
examined.
General Reference Maps show geographic information
including locations of cities, roads, mountains, rivers,
etc.
They focus
more on
landforms like
deserts,
mountains, and
plains.
Physical
Maps
include the
same
information
found on a
political map,
but ….
Two Types of General Reference Maps
Political Maps
show
governmental
boundaries of
countries and
states. They
also include the
location of
major cities.
1. Which type of map would you use if you were
asked to find the land heights of Australia?
a. Political
b. Physical
c. Thematic
Practice:
THAT IS CORRECT!
Please Try Again. Remember political map shows boundaries and borders
between places.
WRONG
Please Try Again. Remember Thematic Maps show a theme of information
about distribution of information.
WRONG
2. This type of map would be useful to study the
territorial borders of the countries of the world?
a. Political
b. Physical
c. Thematic
Practice:
THAT IS CORRECT!
Please Try Again. Remember Thematic Maps show a theme of information
about distribution of information.
WRONG
Please Try Again. Remember Physical Maps show landforms such as rivers
and mountains.
WRONG
3. Which type of map would you use if you need to
compare different vegetation of Australia?
a. Political
b. Physical
c. Thematic
Practice:
THAT IS CORRECT!
Please Try Again. Remember political map shows boundaries and borders
between places.
WRONG
Please Try Again. Remember Physical Maps show landforms such as rivers
and mountains.
WRONG
Congratulations! You have finished the instructional
module on Map Reading Skills.
At this time, review over any unit objectives that you
may need extra practice.
Once you feel confident, click the here to complete
the Posttest or follow the link below.
https://goo.gl/forms/DRZVJnsTZnaHlRtn2
POSTTEST

RebekahHannonMapSkillsTutorial

  • 1.
    Instructional Module intendedfor first year high school students for the purpose of refreshing prior map knowledge. Map Reading Skills Rebekah Hannon EDET 722-J61 April 30, 2017
  • 2.
    Goals: Demonstrate howto read different types of map and different map projections using the tools of mapping. Objective 1.1 Given a map example, the learner will be able to identify the purpose and meaning of the map and its functions. HOME Goals: Identify the tools of mapping to describe how geographers use maps to describe the physical and human world. Objective 2.1: Using the grid system tool of mapping, students will be able to identify the purpose of longitude and/or latitude points. Objective 2.2: Using the scale tool of a map, students will be able to calculate distances between two points of a map. Goals: Analyze different map projections and explain inaccuracies when using different map projections. Objective 3.1: Students will be able to identify inaccuracies cartographer encountered when making maps. Objective 3.2: Provided a type of map projection, students will be able to describe its purpose. Goals: Explain the role GIS data has had on geographic location. Objective 4.1: Students will be able to describe the purpose of using GIS technology. Goals: Differentiate between political, physical, and thematic maps. Objective 5.1: Given a map, students will be able to differentiate the type of maps used and purpose.
  • 3.
    This map skillsunit should be completed in approximately 20 minutes. As you work through the unit, you will complete practice exercises. At the completion of the unit, you will complete a Posttest over the entire module. To move through each slide, use the buttons in the bottom right corner to move forward or backwards through the slides or return to the home screen. Use the “X” in the upper right corner to exit the module. Navigation
  • 4.
    Essential Background Knowledge Oxforddictionary defines a map as a diagrammatic representation of an area of land or sea showing physical features, cities, roads, etc.
  • 5.
    Maps show avariety of information like physical features, climate, population density, economic production, etc. Maps show sizes and shapes of countries, location features, and distances between places.
  • 6.
    Maps are visualRepresentation of data Created by cartographers (map maker) for many different reasons
  • 7.
    1. According tothe map, what do the colors on the map represent: Practice: a. Different regions of the country b. Different numbers c. Different temperatures d. Political boundaries
  • 8.
  • 9.
    Please Try Again,look at the title of the map. WRONG
  • 10.
    2. According tothe map what region of the US, has the hottest average temperature in July? Practice: a. Northeast b. East Coast c. The South d. Northwest
  • 11.
  • 12.
    Please Try Again,look to the map key/legend for help. WRONG
  • 13.
    1. Scale All mapsare scale models of reality. Scale indicates the relationship between the distances on the map and the actual distances on Earth. Map Tools
  • 14.
    Scale is representedin three different ways on map. Graphic Scale (Bar Scale) Verbal Scale Representative Horizontal line marked off in miles, kilometers, or other unit of measure A written sentence expressing distance on the map to distance on Earth No specific unit, scale is written as a fraction or ratio.
  • 15.
    Legend: Scroll over the maplegend to see the scale of the map.
  • 17.
    Symbols are usedby cartographers to represent geographic features. 2. Symbols
  • 18.
    The map keyor legend provides an explanation of the various symbols.
  • 19.
    Grid system on mapsare a series of crossing lines that create squares or rectangles. These crossing lines help people locate on the map. Grid System
  • 20.
     Latitude andLongitude lines make up the grid on many maps. Latitude and Longitude Lines
  • 21.
    Latitude lines runeast-west around the globe and measure how far north or south of the Equator something is located. Longitude lines run north, from pole to pole measuring how far east or west of the Prime Meridian something is located.
  • 22.
    The intersection oflatitude and longitude lines, called coordinates, identify the exact location of a place. Using the map, what are the approximate coordinates of Mexico? (When you think you know click the magnifying glass to check your answer.)
  • 23.
    25⁰N, 105⁰E (anegative in front of the # indicates East direction)
  • 24.
    Other features includedon maps include date (time map was made), orientation (compass rose), title (purpose of map), author (cartographer), index (exact locations), and sources (information source). Other Map Tools
  • 25.
    Cartographers use acronymDOGTAILS to remember: date, orientation, grid, scale, title, author, index, legend (symbols), and sources. Date Orientation Grid Scale Title Index Legend Sources
  • 26.
    1. Using themap scale provided, what is the approximate distance between the capital of Australia and the city of Darwin? a. 2500 miles b. 2000 miles c. 1500 miles d. 500 miles Practice:
  • 27.
  • 28.
    Please Try Again,use a ruler if needed. WRONG
  • 29.
    2. Given thatthe scale on a map is 1 inch: 50,000 miles, what would be the actual distance between two points that are 8 inches apart on the map? a. 50,000 miles b. 200,000 miles c. 400,000 miles d. 1,000,000 miles Practice:
  • 30.
  • 31.
    Please Try Again,hint multiply. WRONG
  • 32.
    1. True orFalse. The Equator is a line of latitude. 2. True or False. Lines measuring east and west of the prime meridian are called lines of latitude. 3. True or False. Lines running north and south direction on a map are called lines of longitude. Practice:
  • 33.
  • 34.
  • 35.
  • 36.
    What are mapprojections? A means of showing the Earth’s curved surface on a flat sheet. Map Projections
  • 37.
    Maps don’t representEarth accurately because Earth is round, and maps are flat. Transferring Earth onto a flat piece of paper is called projection.
  • 38.
    Size, shape, andrelative location of land masses change in the process of transfer from the round globe to a flat surface which is known as distortion. Every map has some sort of distortion.
  • 39.
    The larger thearea (small scale map) covered by a map, the greater the distortion. Large scale maps have less distortion.
  • 40.
    1. Planar Projectionsshow Earth’s surface projected onto a plane, or flat surface. Planar projections are most accurate at their centers, where the plane touches the globe. (Scroll over the term Planar Projections to see an example) 3 Types of Map Projections:
  • 42.
    2. Conical Projectionshows a cone intersecting the globe along one or two lines of latitude when the cone is unwrapped and made into a flat map, latitude lines appear curved and lines of longitude are straight. Regions between the equator and poles are represented fairly accurately. Used for most maps displaying the United States. (Scroll over the term Conical Projection to see an example)
  • 44.
    Cylindrical (also knownas Azimuthal) Projection is a map projection where the Earth’s surface is projected onto a tube, or cylinder, shape. Regions near the equator are fairly accurate in shape and size and areas around the poles are most distorted. (Scroll over the term Cylindrical Projection to see an example)
  • 46.
    All map projectionsmust consider two important factors. Cartographers have to decide whether the accuracy of the size of objects is more important or the accuracy of shape is more important.
  • 47.
    Conformal Maps show true shapesof small areas but distort size.
  • 48.
    Equal area maps or equivalent mapsdistort shape and direction
  • 49.
    1. What isa map projection? a. A way of representing the surface of a celestial sphere on a flat surface. b. A way of representing a flat surface on a globe shape. c. A way of projecting a map on a wall. d. A picture of a map. Practice:
  • 50.
  • 51.
  • 52.
    2. Inaccuracies indistance, shape, direction, and area of specific maps are problems cartographers encountered when making maps, these factors make for ________ of maps. a. Scales b. Distortion c. Legends d. Grid Systems Practice:
  • 53.
  • 54.
    Please Try Again,remember all maps because of the transfer from a round object to a flat object have to characteristic. WRONG
  • 55.
    3. A mapprojection that shows an area between latitude and longitude equal in size to area on globe is known as: a. Cylindrical Projection b. Conic Projection c. Azimuthal Projection d. Equal-Area Projection Practice:
  • 56.
  • 57.
    Please Try Again,think equal in size. WRONG
  • 58.
    4. A mapprojection that is made when contents of the globe are moved onto a cone is: a. Cylindrical Projection b. Conic Projection c. Azimuthal Projection d. Equal-Area Projection Practice:
  • 59.
  • 60.
    Please Try Again,use the clue word found in the question. WRONG
  • 61.
    What is GIStechnology? GIS are computer systems that capture, store, and display data related to position on Earth’s surface. Geographic Information System (GIS) Technology
  • 62.
    This technology combines multiple sourcesof information and allows multiple sets of data to be displayed on a single map.
  • 63.
    GIS technology isused in a variety of occupational fields and helps with analysis and decision making. Federal, Local, State Governments: Planning and Organizing Police Departments: Track Crime Fire Departments: Finding the shortest route to emergencies Real Estate Agents: Track properties, property values Bankers: Track Tax Information Health Care Professionals: Track the spread of disease and wellness Communication Technology Companies: Planning Utility Expansions Meteorologists: Tracking weather forecasting Etc.
  • 64.
    Many different types of informationcan be compared and contrasted using GIS. • Operational Expenses for Business • Real Estate Site Selection • Route/Corridor Selection • Evacuation Planning • Conservation, Natural Resource Extraction • Etc.
  • 65.
    Using GIS, onemap can display sites that produce pollution and sites that are sensitive to pollution. Such a map would show vulnerable areas that are at risk. Example 1:
  • 66.
    Using GIS, manydifferent characteristics of a city can be seen in one map. Information about average income, voting patterns, and demographics can be compared and contrasted in one map. Example 2:
  • 67.
    1. Geographic InformationSystem (GIS) is defined as: a. Digital images of Earth acquired by sensors on board orbiting space borne platforms. b. A number of different high-tech systems that acquire, analyze, manage, store, or visualize various types of location-based data. c. A technology using signals broadcast from satellites for navigation and position determination on Earth. d. Computer based mapping, analysis, and retrieval of location-based data. Practice:
  • 68.
  • 69.
    Please Try Again,remember GIS is a laying process. WRONG
  • 70.
    2. True orFalse. GIS technology is only utilized by government agencies in planning and organizing their geographic data. Practice:
  • 71.
  • 72.
  • 73.
    Cartographers make manydifferent types of maps. Two major types of map types: General Reference Maps and Thematic Maps Map Types
  • 74.
    Thematic maps display informationabout distribution or patterns of human actions. A theme or topic is emphasized and information about people other phenomenon are examined.
  • 75.
    General Reference Mapsshow geographic information including locations of cities, roads, mountains, rivers, etc.
  • 76.
    They focus more on landformslike deserts, mountains, and plains. Physical Maps include the same information found on a political map, but …. Two Types of General Reference Maps
  • 77.
    Political Maps show governmental boundaries of countriesand states. They also include the location of major cities.
  • 78.
    1. Which typeof map would you use if you were asked to find the land heights of Australia? a. Political b. Physical c. Thematic Practice:
  • 79.
  • 80.
    Please Try Again.Remember political map shows boundaries and borders between places. WRONG
  • 81.
    Please Try Again.Remember Thematic Maps show a theme of information about distribution of information. WRONG
  • 82.
    2. This typeof map would be useful to study the territorial borders of the countries of the world? a. Political b. Physical c. Thematic Practice:
  • 83.
  • 84.
    Please Try Again.Remember Thematic Maps show a theme of information about distribution of information. WRONG
  • 85.
    Please Try Again.Remember Physical Maps show landforms such as rivers and mountains. WRONG
  • 86.
    3. Which typeof map would you use if you need to compare different vegetation of Australia? a. Political b. Physical c. Thematic Practice:
  • 87.
  • 88.
    Please Try Again.Remember political map shows boundaries and borders between places. WRONG
  • 89.
    Please Try Again.Remember Physical Maps show landforms such as rivers and mountains. WRONG
  • 90.
    Congratulations! You havefinished the instructional module on Map Reading Skills. At this time, review over any unit objectives that you may need extra practice. Once you feel confident, click the here to complete the Posttest or follow the link below. https://goo.gl/forms/DRZVJnsTZnaHlRtn2 POSTTEST