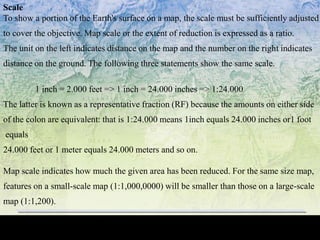
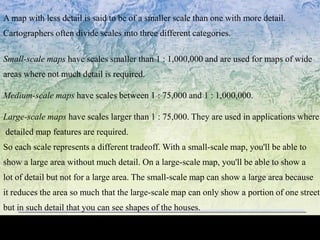
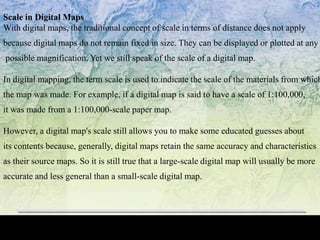
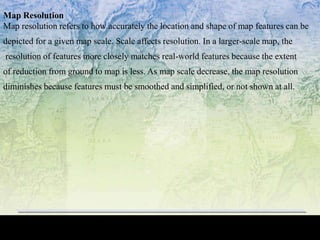
The document discusses key concepts in geographic information systems (GIS) including map fundamentals, features, properties, and scales. It explains that maps represent spatial data through location and attribute information. Locational data conveys where features are on Earth, while attribute data describes characteristics. Maps can show points, lines, polygons and their properties at different scales from small to large.
Data Visualization GIS and Maps, The Visualization Process Visualization Strategies: Present or explore? The cartographic toolbox: What kind of data do I have?, How can I map my data? How to map?: How to map qualitative data, How to map quantitative data, How to map the terrain elevation, How to map time series Map Cosmetics, Map Dissemination
Topics:
1. Mapping Concepts
2. Analysis with paper based Maps
3. Limitations of Paper based Maps
4. Computer Aided Cartography History and Development
5. GIS Definition
6. Advantage of Digital Maps
Introduction to various GIS software, google earth. Intro types, types of maps, map projections and hands on to Q GIS software. Introduction to latitude longitude system, shape file generation, geo referencing and digitization.
basic concept of geographic data,GIS and its component,data acquisition ,raster, vector formats,spatial data,topology and data model data output ,GIS applications
How to Add Chatter in the odoo 17 ERP ModuleCeline George
In Odoo, the chatter is like a chat tool that helps you work together on records. You can leave notes and track things, making it easier to talk with your team and partners. Inside chatter, all communication history, activity, and changes will be displayed.
A review of the growth of the Israel Genealogy Research Association Database Collection for the last 12 months. Our collection is now passed the 3 million mark and still growing. See which archives have contributed the most. See the different types of records we have, and which years have had records added. You can also see what we have for the future.
Thinking of getting a dog? Be aware that breeds like Pit Bulls, Rottweilers, and German Shepherds can be loyal and dangerous. Proper training and socialization are crucial to preventing aggressive behaviors. Ensure safety by understanding their needs and always supervising interactions. Stay safe, and enjoy your furry friends!
Biological screening of herbal drugs: Introduction and Need for
Phyto-Pharmacological Screening, New Strategies for evaluating
Natural Products, In vitro evaluation techniques for Antioxidants, Antimicrobial and Anticancer drugs. In vivo evaluation techniques
for Anti-inflammatory, Antiulcer, Anticancer, Wound healing, Antidiabetic, Hepatoprotective, Cardio protective, Diuretics and
Antifertility, Toxicity studies as per OECD guidelines
How to Build a Module in Odoo 17 Using the Scaffold MethodCeline George
Odoo provides an option for creating a module by using a single line command. By using this command the user can make a whole structure of a module. It is very easy for a beginner to make a module. There is no need to make each file manually. This slide will show how to create a module using the scaffold method.
it describes the bony anatomy including the femoral head , acetabulum, labrum . also discusses the capsule , ligaments . muscle that act on the hip joint and the range of motion are outlined. factors affecting hip joint stability and weight transmission through the joint are summarized.
Advantages and Disadvantages of CMS from an SEO Perspective
map.ppt
1. Fundamentals of GIS
Mapping Concepts, Features & Properties
A map represents geographic features or other spatial phenomena by graphically
conveying information about locations and attributes. Locational information describes
the position of particular geographic features on the Earth's surface, as well as the
spatial relationship between features, such as the shortest path from a fire station to
a library, the proximity of competing businesses, and so on. Attribute information
describes characteristics of the geographic features represented, such as the feature
type, its name or number and quantitative information such as its area or length.
2. Objective of mapping is to provide :
descriptions of geographic phenomenon
spatial and non spatial information
map features like Point, Line, & Polygon.
Map Characteristics
In addition to feature locations and their attributes,
the other technical characteristics that define maps and their use includes:
Map Scale
Map Accuracy
Map Extent and
Data Base Extent
3. Map Features
Locational information is usually represented by points for features such
as wells and telephone pole locations, lines for features such as streams,
pipelines and contour lines and areas for features such as lakes, counties and
census tracts.
Point feature
A point feature represents as single location. It defines a map object
too small to show as a line or area feature. A special symbol of label
usually depicts a point location.
Line feature
A line feature is a set of connected, ordered coordinates representing
the linear shape of a map object that may be too narrow to display as
an area such as a road or feature with no width such as a contour line.
Area feature
An area feature is a closed figure whose boundary encloses a homogeneous area,
such as a state country soil type or lake.
4. Scale
To show a portion of the Earth's surface on a map, the scale must be sufficiently adjusted
to cover the objective. Map scale or the extent of reduction is expressed as a ratio.
The unit on the left indicates distance on the map and the number on the right indicates
distance on the ground. The following three statements show the same scale.
1 inch = 2.000 feet => 1 inch = 24.000 inches => 1:24.000
The latter is known as a representative fraction (RF) because the amounts on either side
of the colon are equivalent: that is 1:24.000 means 1inch equals 24.000 inches or1 foot
equals
24.000 feet or 1 meter equals 24.000 meters and so on.
Map scale indicates how much the given area has been reduced. For the same size map,
features on a small-scale map (1:1,000,0000) will be smaller than those on a large-scale
map (1:1,200).
5. A map with less detail is said to be of a smaller scale than one with more detail.
Cartographers often divide scales into three different categories.
Small-scale maps have scales smaller than 1 : 1,000,000 and are used for maps of wide
areas where not much detail is required.
Medium-scale maps have scales between 1 : 75,000 and 1 : 1,000,000.
Large-scale maps have scales larger than 1 : 75,000. They are used in applications where
detailed map features are required.
So each scale represents a different tradeoff. With a small-scale map, you'll be able to
show a large area without much detail. On a large-scale map, you'll be able to show a
lot of detail but not for a large area. The small-scale map can show a large area because
it reduces the area so much that the large-scale map can only show a portion of one street,
but in such detail that you can see shapes of the houses.
6. Scale in Digital Maps
With digital maps, the traditional concept of scale in terms of distance does not apply
because digital maps do not remain fixed in size. They can be displayed or plotted at any
possible magnification. Yet we still speak of the scale of a digital map.
In digital mapping, the term scale is used to indicate the scale of the materials from which
the map was made. For example, if a digital map is said to have a scale of 1:100,000,
it was made from a 1:100,000-scale paper map.
However, a digital map's scale still allows you to make some educated guesses about
its contents because, generally, digital maps retain the same accuracy and characteristics
as their source maps. So it is still true that a large-scale digital map will usually be more
accurate and less general than a small-scale digital map.
7. Map Resolution
Map resolution refers to how accurately the location and shape of map features can be
depicted for a given map scale. Scale affects resolution. In a larger-scale map, the
resolution of features more closely matches real-world features because the extent
of reduction from ground to map is less. As map scale decrease, the map resolution
diminishes because features must be smoothed and simplified, or not shown at all.
8. Map Accuracy
Many factors besides resolution, influence how accurately features can be depicted,
including the quality of source data, the map scale, your drafting skill and the width of
lines drawn on the ground.
A fine drafting pen will draw line's 1/100 of an inch wide.
Such a line represents a corridor on the ground, which is almost 53 feet wide.
9. Some measurements of a map's accuracy are :
•Absolute accuracy of a map refers to the relationship between a geographic position
on a map (a street corner, for instance) and its real-world position measured on the
surface of the earth. Absolute accuracy is primarily important for complex data
requirements such as those for surveying and engineering-based applications.
•Relative accuracy refers to the displacement between two points on a map
(both distance and angle), compared to the displacement of those same points in the real
world. Relative accuracy is often more important and easier to obtain than absolute
accuracy because users rarely need to know absolute positions. More often, they need to
find a position relative to some known landmark, which is what relative accuracy provide
Users with simple data requirements generally need only relative accuracy.
10. Map Extent
The aerial extent of map is the area on the Earth's surface
represented on the map.
It is the limit of the area covered, usually defined by rectangle
just large enough to include all mapped features.
The size of the study area depends on the map scale.
The smaller the scale the larger the area covered.
11. Types of Information in a Digital Map
Three general types of information can be included in digital
maps:
Geographic information, which provides the position and shapes
of specific geographic features.
Attribute information, which provides additional non-graphic
information about each feature.
Display information, which describes how the features
will appear on the screen.
12. Geographic Information
The geographic information in a digital map provides the position
and shape of each map feature. For example, a road map's
geographic information is the location of each road on the map.
In a vector map, a feature's position is normally expressed as sets
of X, Y pairs or X, Y, Z triples, using the coordinate system defined
for the map (see the discussion of coordinate systems, below). Most
vector geographic information systems support three fundamental
geometric objects:
Point: A single pair of coordinates.
Line: Two or more points in a specific sequence.
Polygon: An area enclosed by a line.
Some systems also support more complex entities, such as regions,
circles, ellipses, arcs, and cur
13. Attribute Information
Attribute data describes specific map features but is not inherently
graphic. For example, an attribute associated with a road might be
its name or the date it was last paved. Attributes are often stored in
database files kept separately from the graphic portion of the map.
Attributes pertain only to vector maps; they are seldom associated
with raster images.
GIS software packages maintain internal links tying each graphical
map entity to its attribute information. The nature of these links
varies widely across systems. In some, the link is implicit, and the
user has no control over it. Other systems have explicit links that the
user can modify. Links in these systems take the form of database
keys. Each map feature has a key value stored with it; the key
identifies the specific database record that contains the feature's
attribute information.
14. Display Information
The display information in a digital-map data set describes how the
map is to be displayed or plotted. Common display information
includes feature colours, line widths and line types (solid, dashed,
dotted, single, or double); how the names of roads and other
features are shown on the map; and whether or not lakes, parks, or
other area features are colour coded.
However, many users do not consider the quality of display
information when they evaluate a data set. Yet map display strongly
affects the information you and your audience can obtain from the
map - no matter how simple or complex the project. A technically
flawless, but unattractive or hard-to-read map will not achieve the
goal of conveying information easily to the user.
15. Layering
Most GIS software has a system of layers, which can be used to
divide a large map into manageable pieces. For example, all roads
could be on one layer and all hydrographic features on another.
Major layers can be further classified into sub-layers, such as
different types of roads - highways, city streets, and so on. Layer
names are particularly important in CAD-based mapping and GIS
programs, which have excellent tools for handling them.
For example, a map could have its roads on a layer called RD, its
railroads on a layer called RR, its road bridges on a layer called RD-
BRIDGE, and its railroad bridges on a layer called RR-BRIDGE.
This scheme is mnemonic because it is easy to tell a layer's
contents from its name, and it's hierarchical because the user can
easily select all the roads, railroads, bridges, road bridges, or
railroad bridges.
16. Maps can be broadly classified in to two groups:
1.Topographical maps
2.Thematic maps
Topographical Maps
It is a reference map showing the outline of selected man-made and
natural features of the earth. It often acts as a frame for other
features Topography refers to the shape of surface represented by
contours or shading. It also shows lands, railway and other
prominent features.
Thematic maps
Thematic maps are an important source of GIS information. These
are tools to communicate geographical concepts such as Density of
population, Climate, movement of goods and people, land use etc. It
has many classifications.
17. Principal Functions of GIS
Data Capture
Database Management and Update
Geographic Analysis
Presenting Results