The document serves as an introduction to world geography, covering the seven continents, four oceans, and key geographical concepts such as location, place, and human-environment interaction. It outlines the tools used in geography, including maps and globes, and explains different map projections like planar, cylindrical, and conic. Additionally, it discusses the global grid system, the characteristics of various map types (physical, political, thematic), and introduces Geographic Information Systems (GIS) for data processing and map creation.
INTRO TO WORLDGEOGRAPHY:
GEOGRAPHY SKILLS
Mrs. Minks Social Studies
2.
WARM-UP 8.12.14
On anindex card, answer the following questions:
1. Name the seven continents.
2. Name the four oceans.
3. What is the highest mountain in the world?
4. What is the largest desert in Africa?
5. What is the longest river in the world?
6. What is the largest river in the United States?
3.
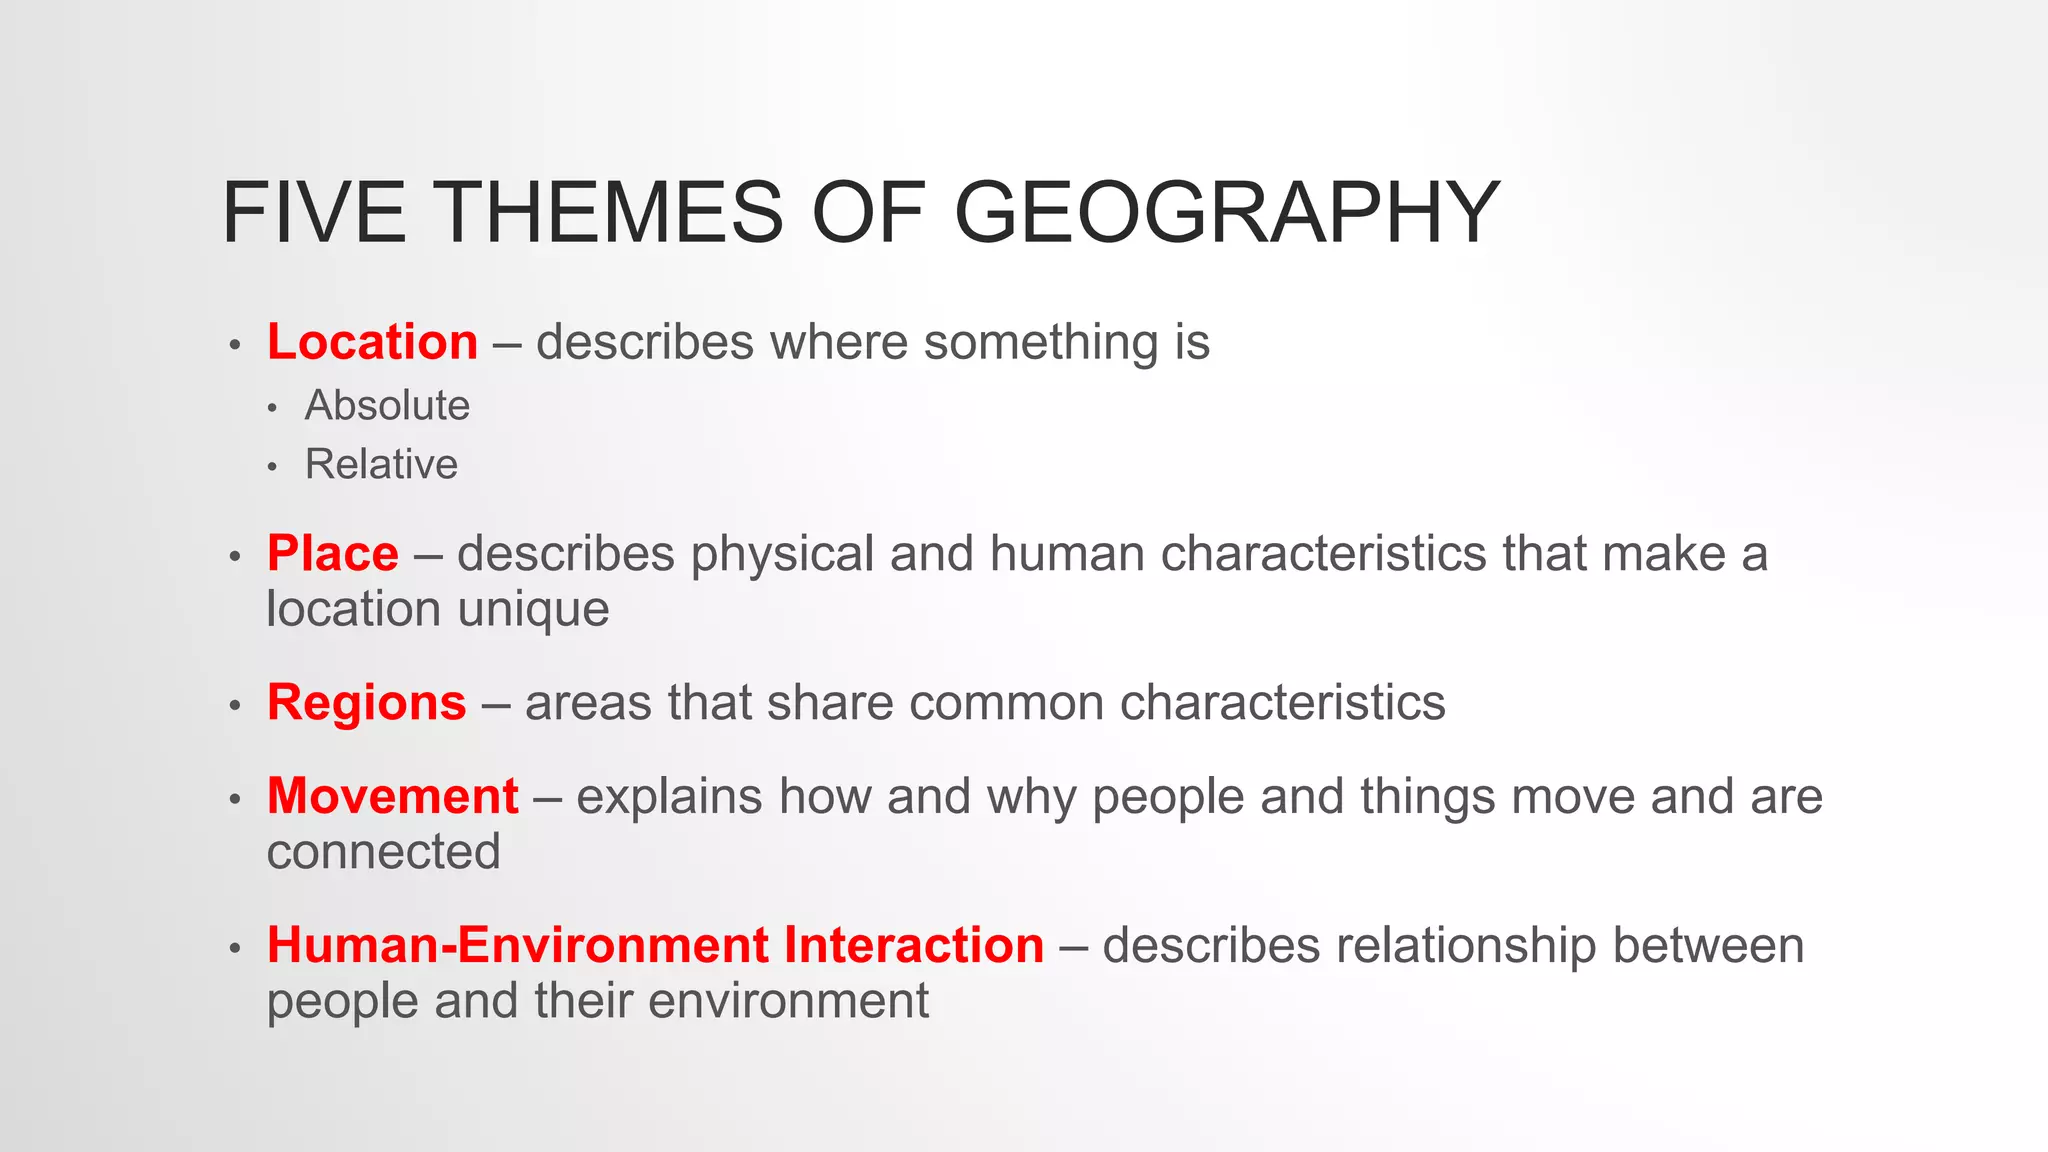
FIVE THEMES OFGEOGRAPHY
• Location – describes where something is
• Absolute
• Relative
• Place – describes physical and human characteristics that make a
location unique
• Regions – areas that share common characteristics
• Movement – explains how and why people and things move and are
connected
• Human-Environment Interaction – describes relationship between
people and their environment
4.
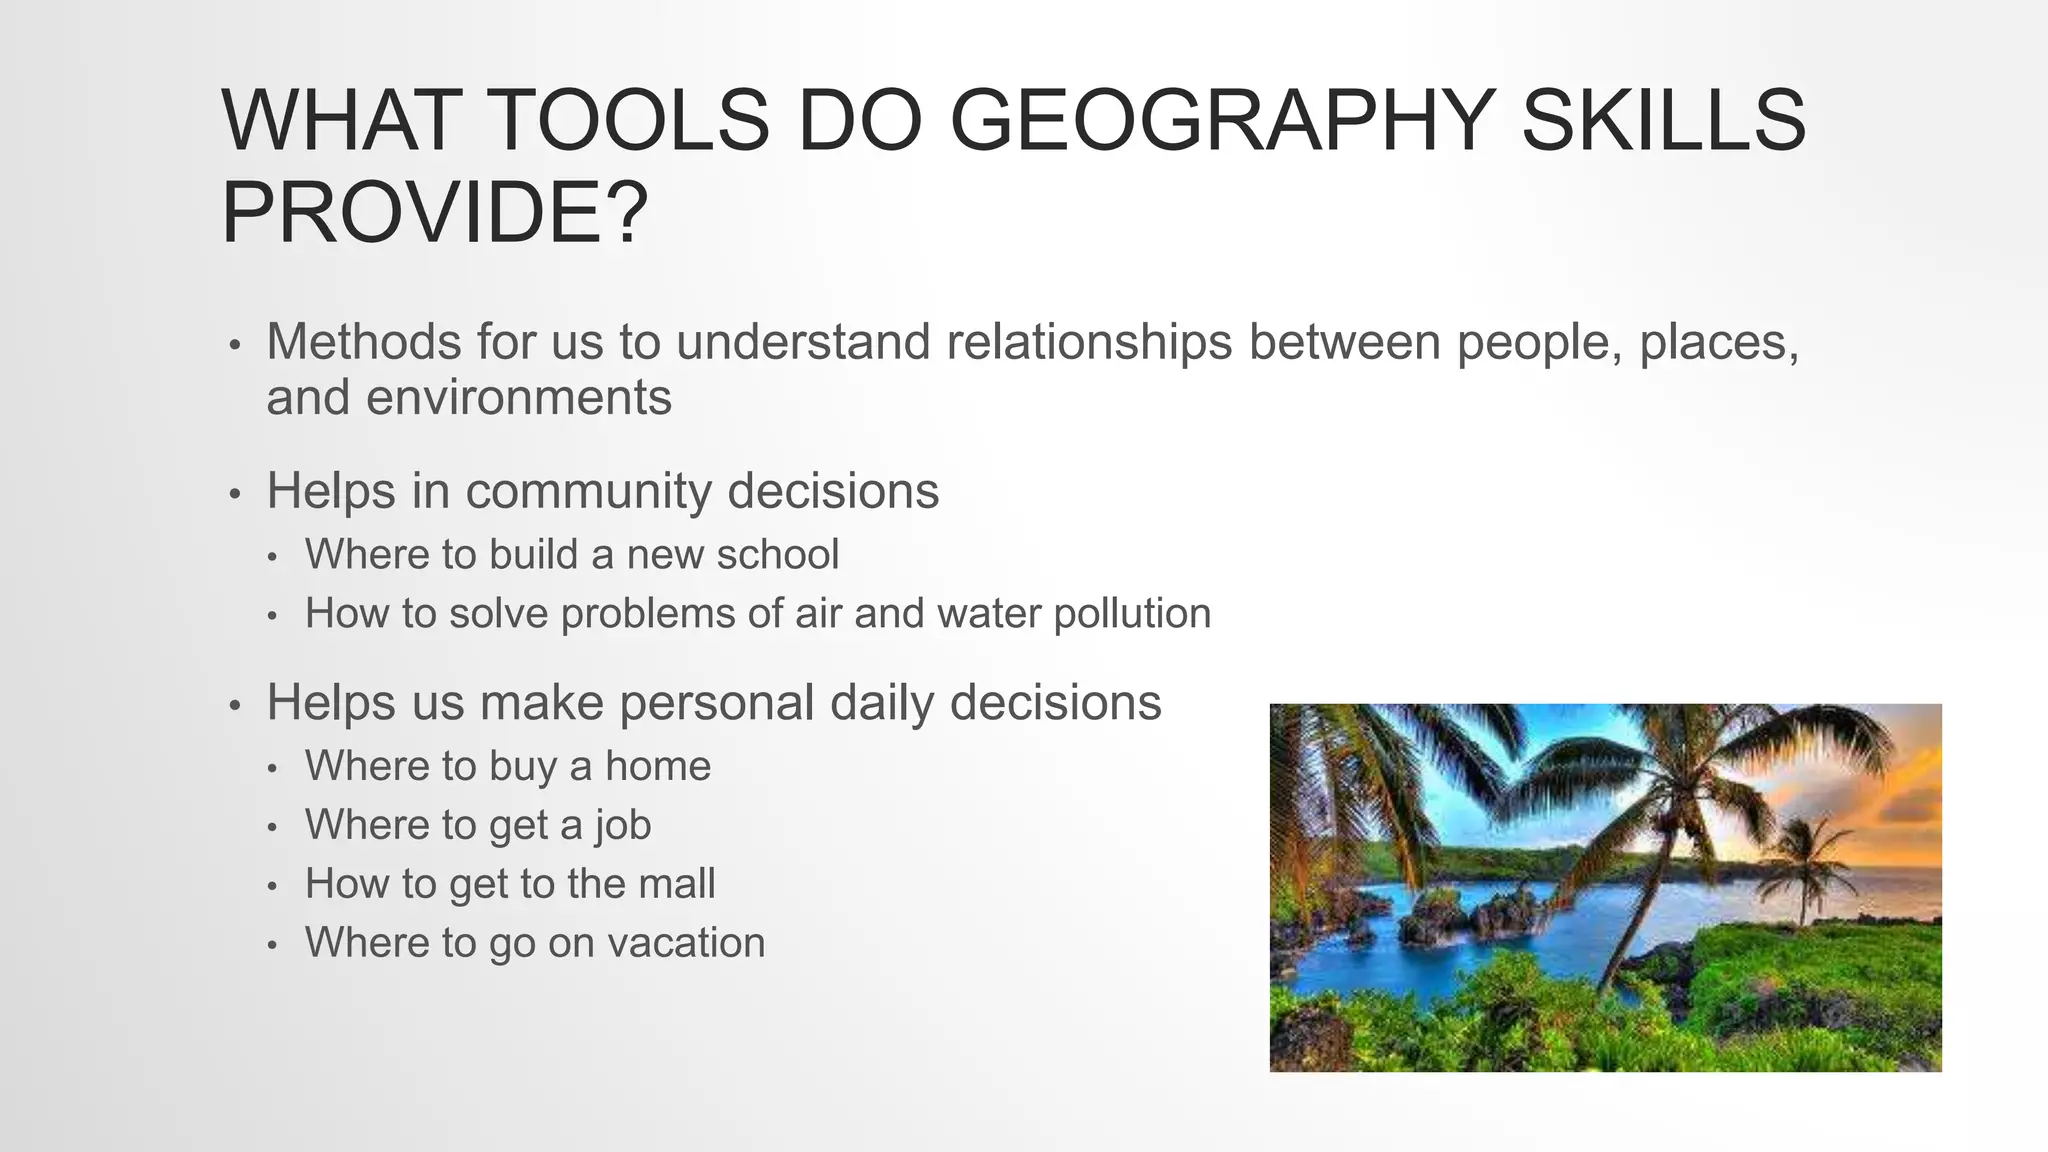
WHAT TOOLS DOGEOGRAPHY SKILLS
PROVIDE?
• Methods for us to understand relationships between people, places,
and environments
• Helps in community decisions
• Where to build a new school
• How to solve problems of air and water pollution
• Helps us make personal daily decisions
• Where to buy a home
• Where to get a job
• How to get to the mall
• Where to go on vacation
5.
GLOBES AND MAPS
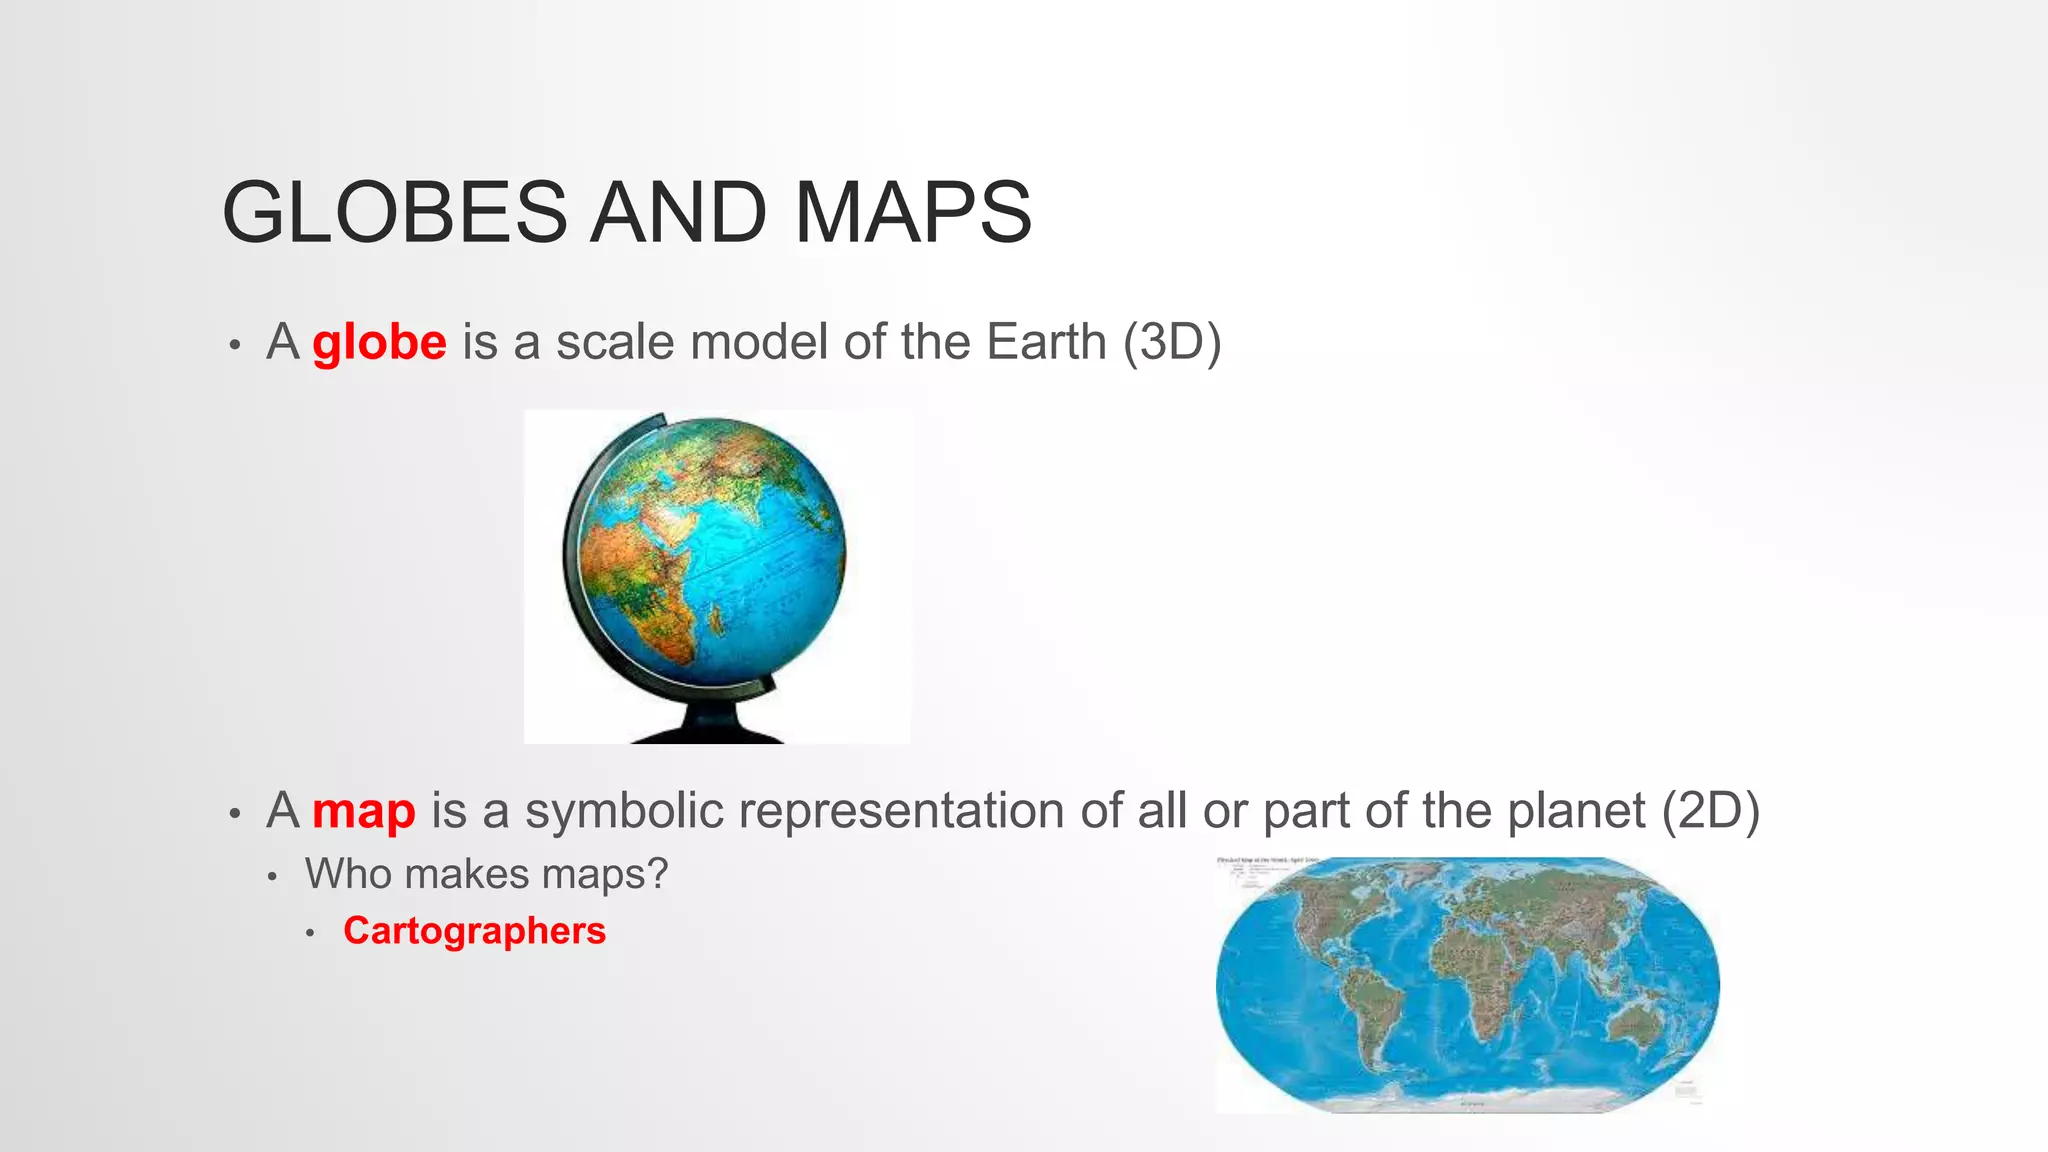
•A globe is a scale model of the Earth (3D)
• A map is a symbolic representation of all or part of the planet (2D)
• Who makes maps?
• Cartographers
6.
GREAT CIRCLE
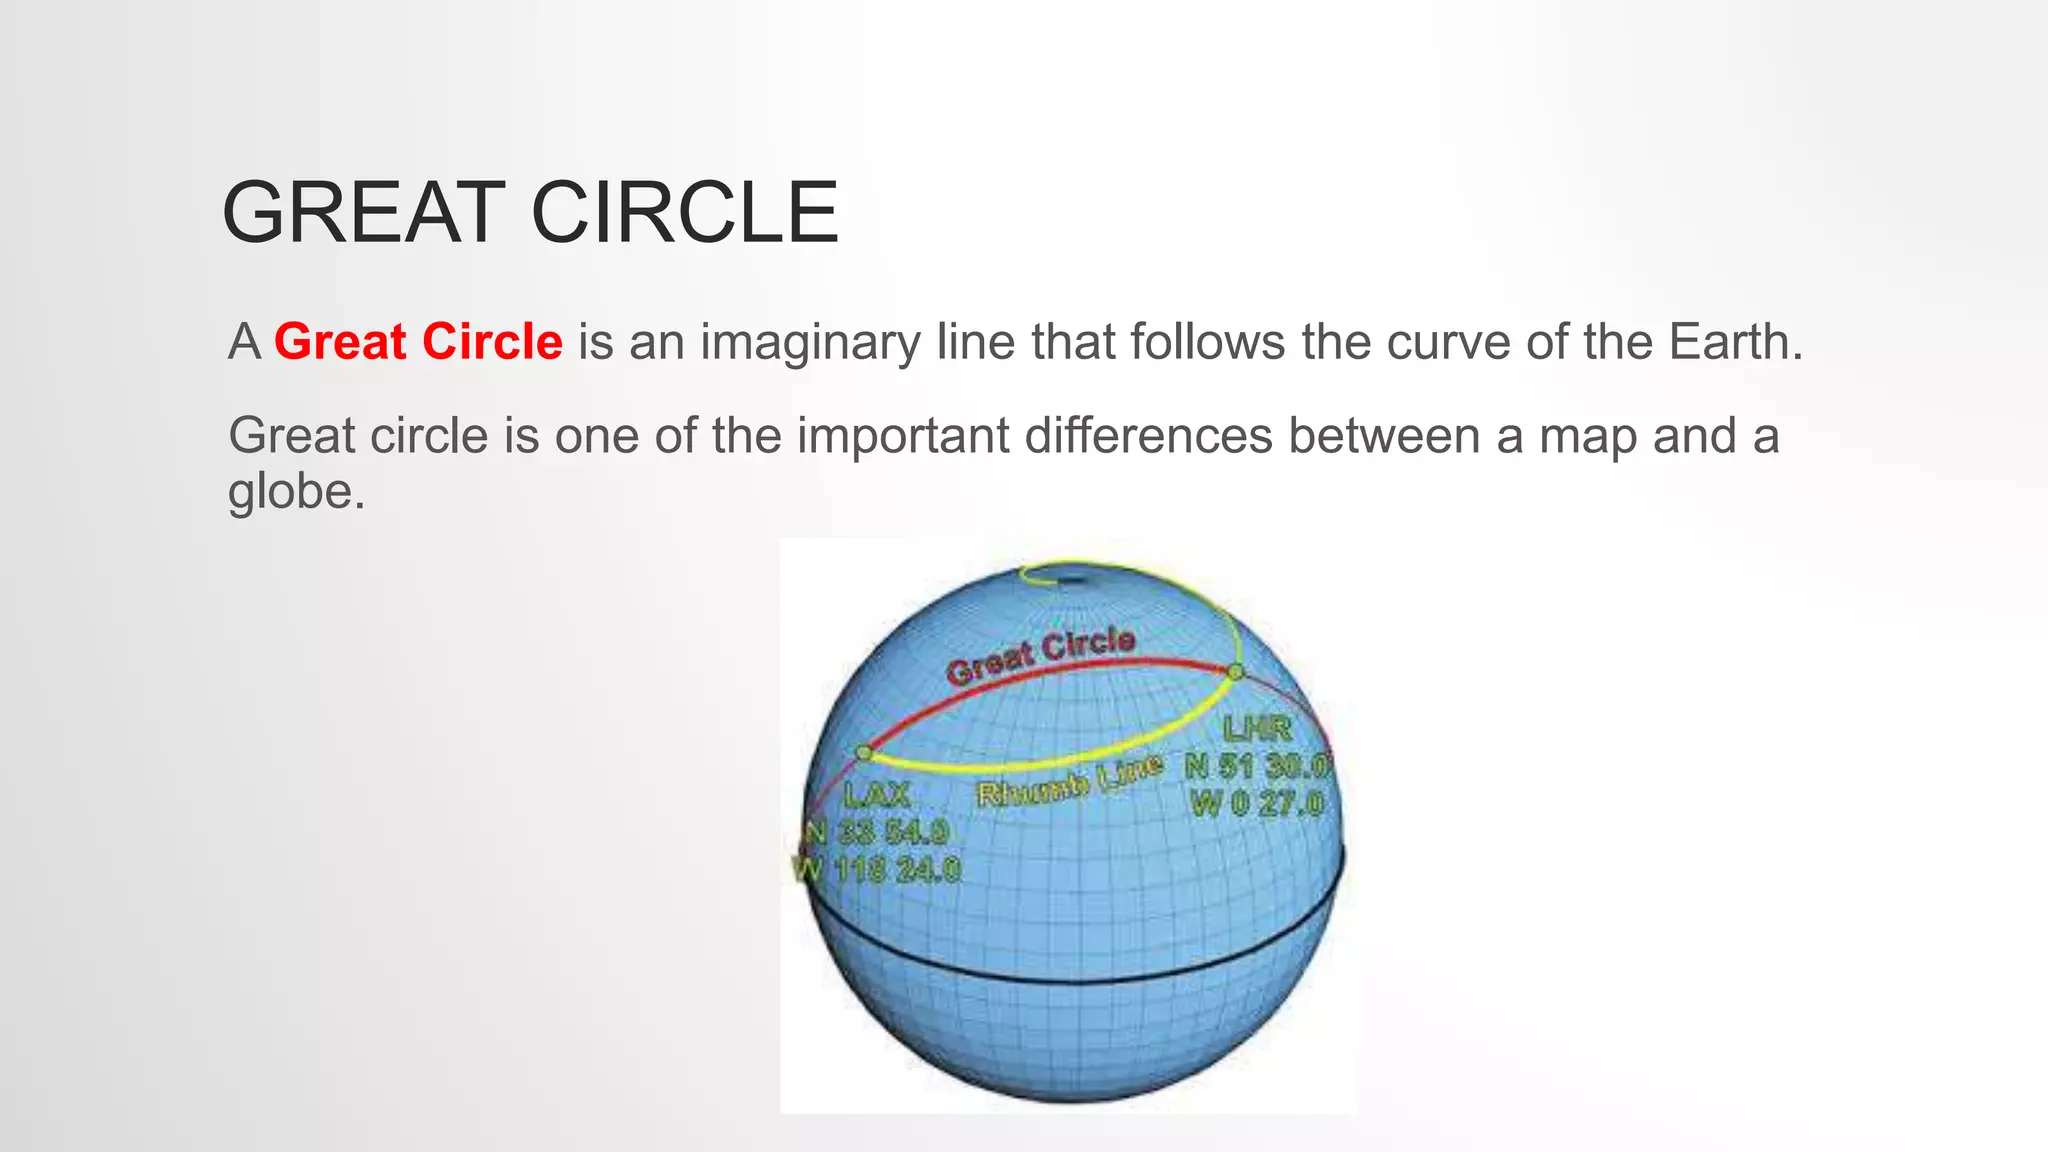
A GreatCircle is an imaginary line that follows the curve of the Earth.
Great circle is one of the important differences between a map and a
globe.
7.
PROJECTIONS
• To createmaps, cartographers project the round Earth onto a flat
surface making a map projection.
• Distance, shape, direction, or size may be distorted by a projection.
• The purpose of the map usually dictates which projection is used.
The three basic categories of map projections are:
• Planar Projection
• Cylindrical Projection
• Conic Projection
8.
PLANAR PROJECTION
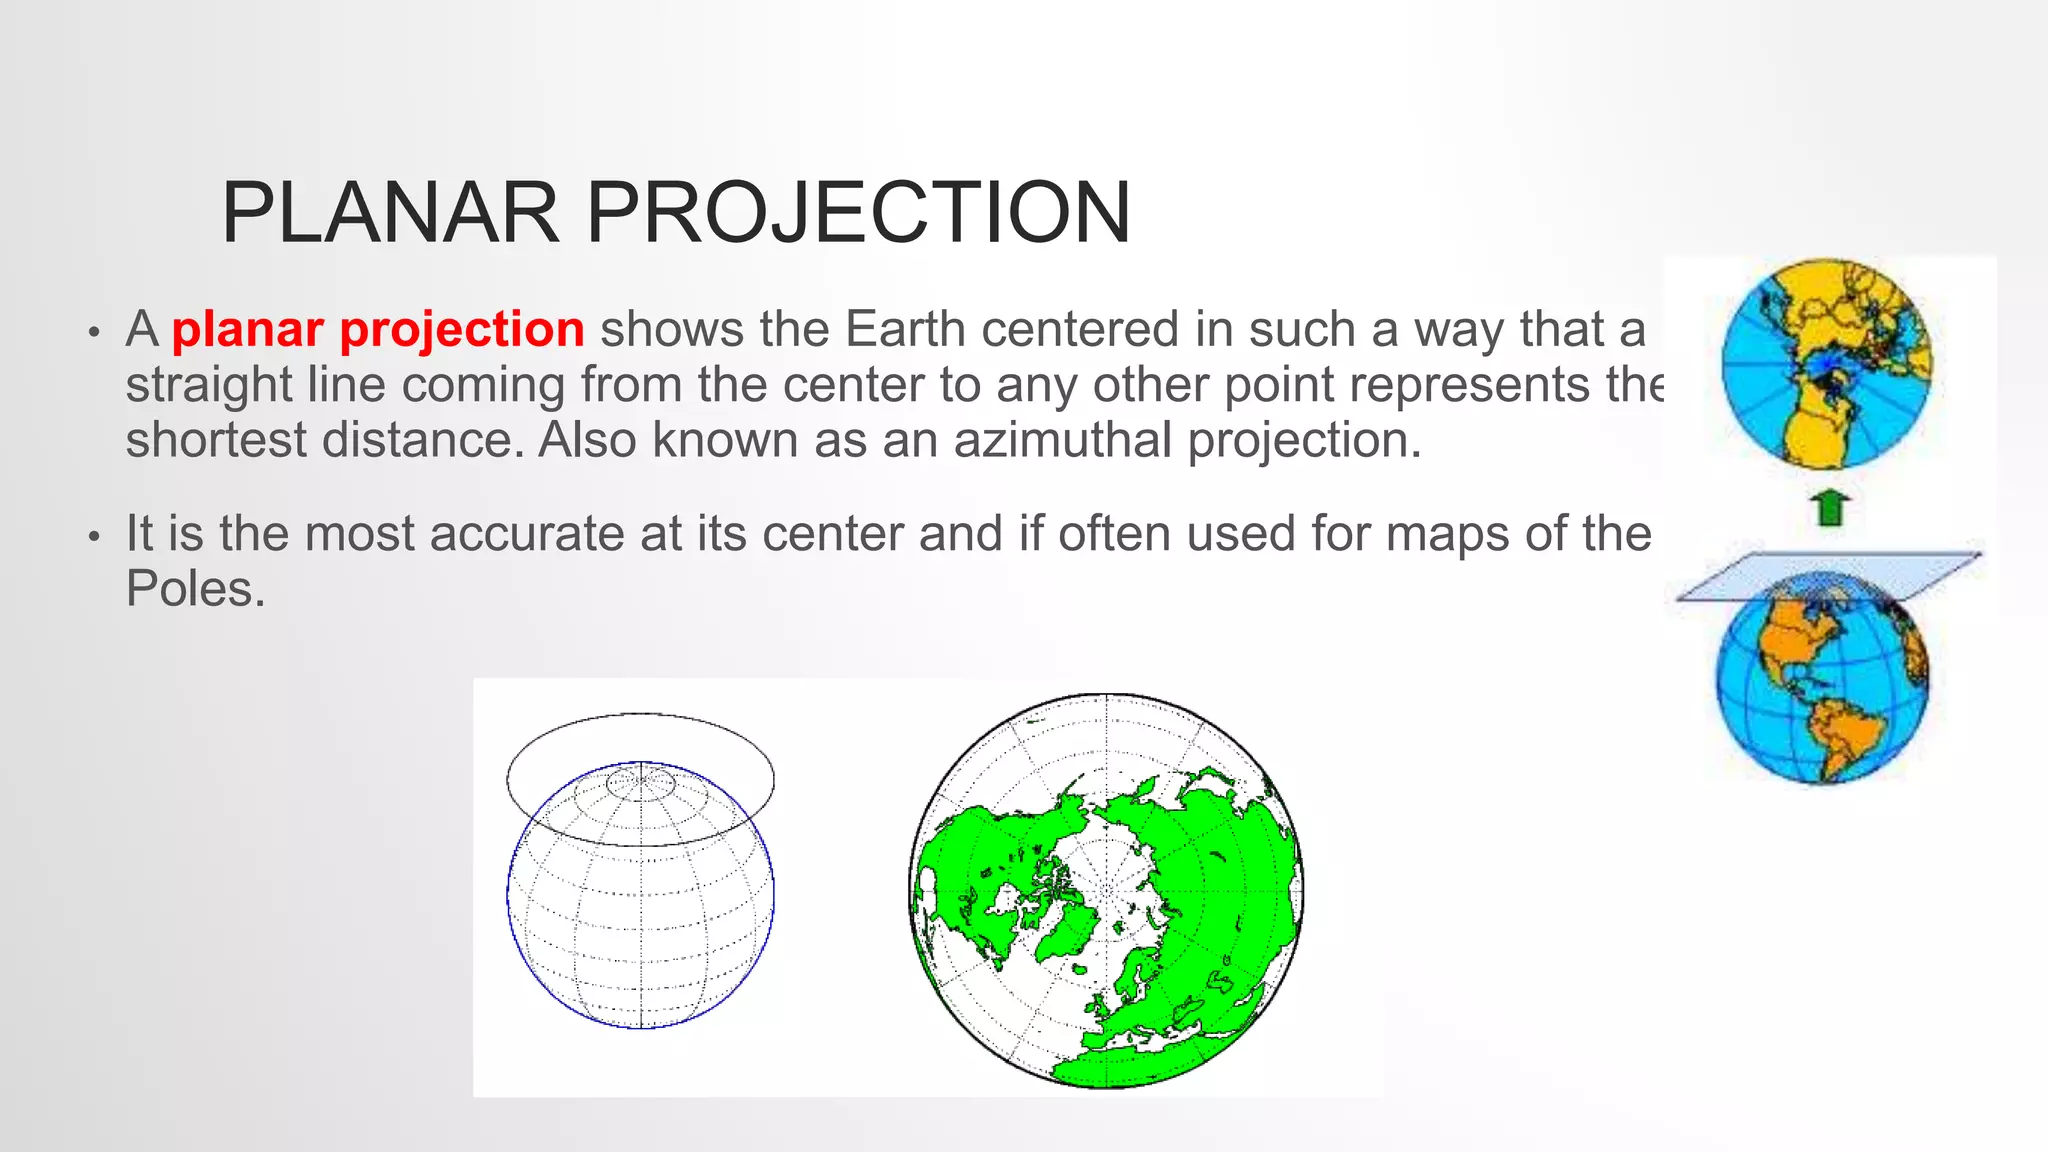
• Aplanar projection shows the Earth centered in such a way that a
straight line coming from the center to any other point represents the
shortest distance. Also known as an azimuthal projection.
• It is the most accurate at its center and if often used for maps of the
Poles.
9.
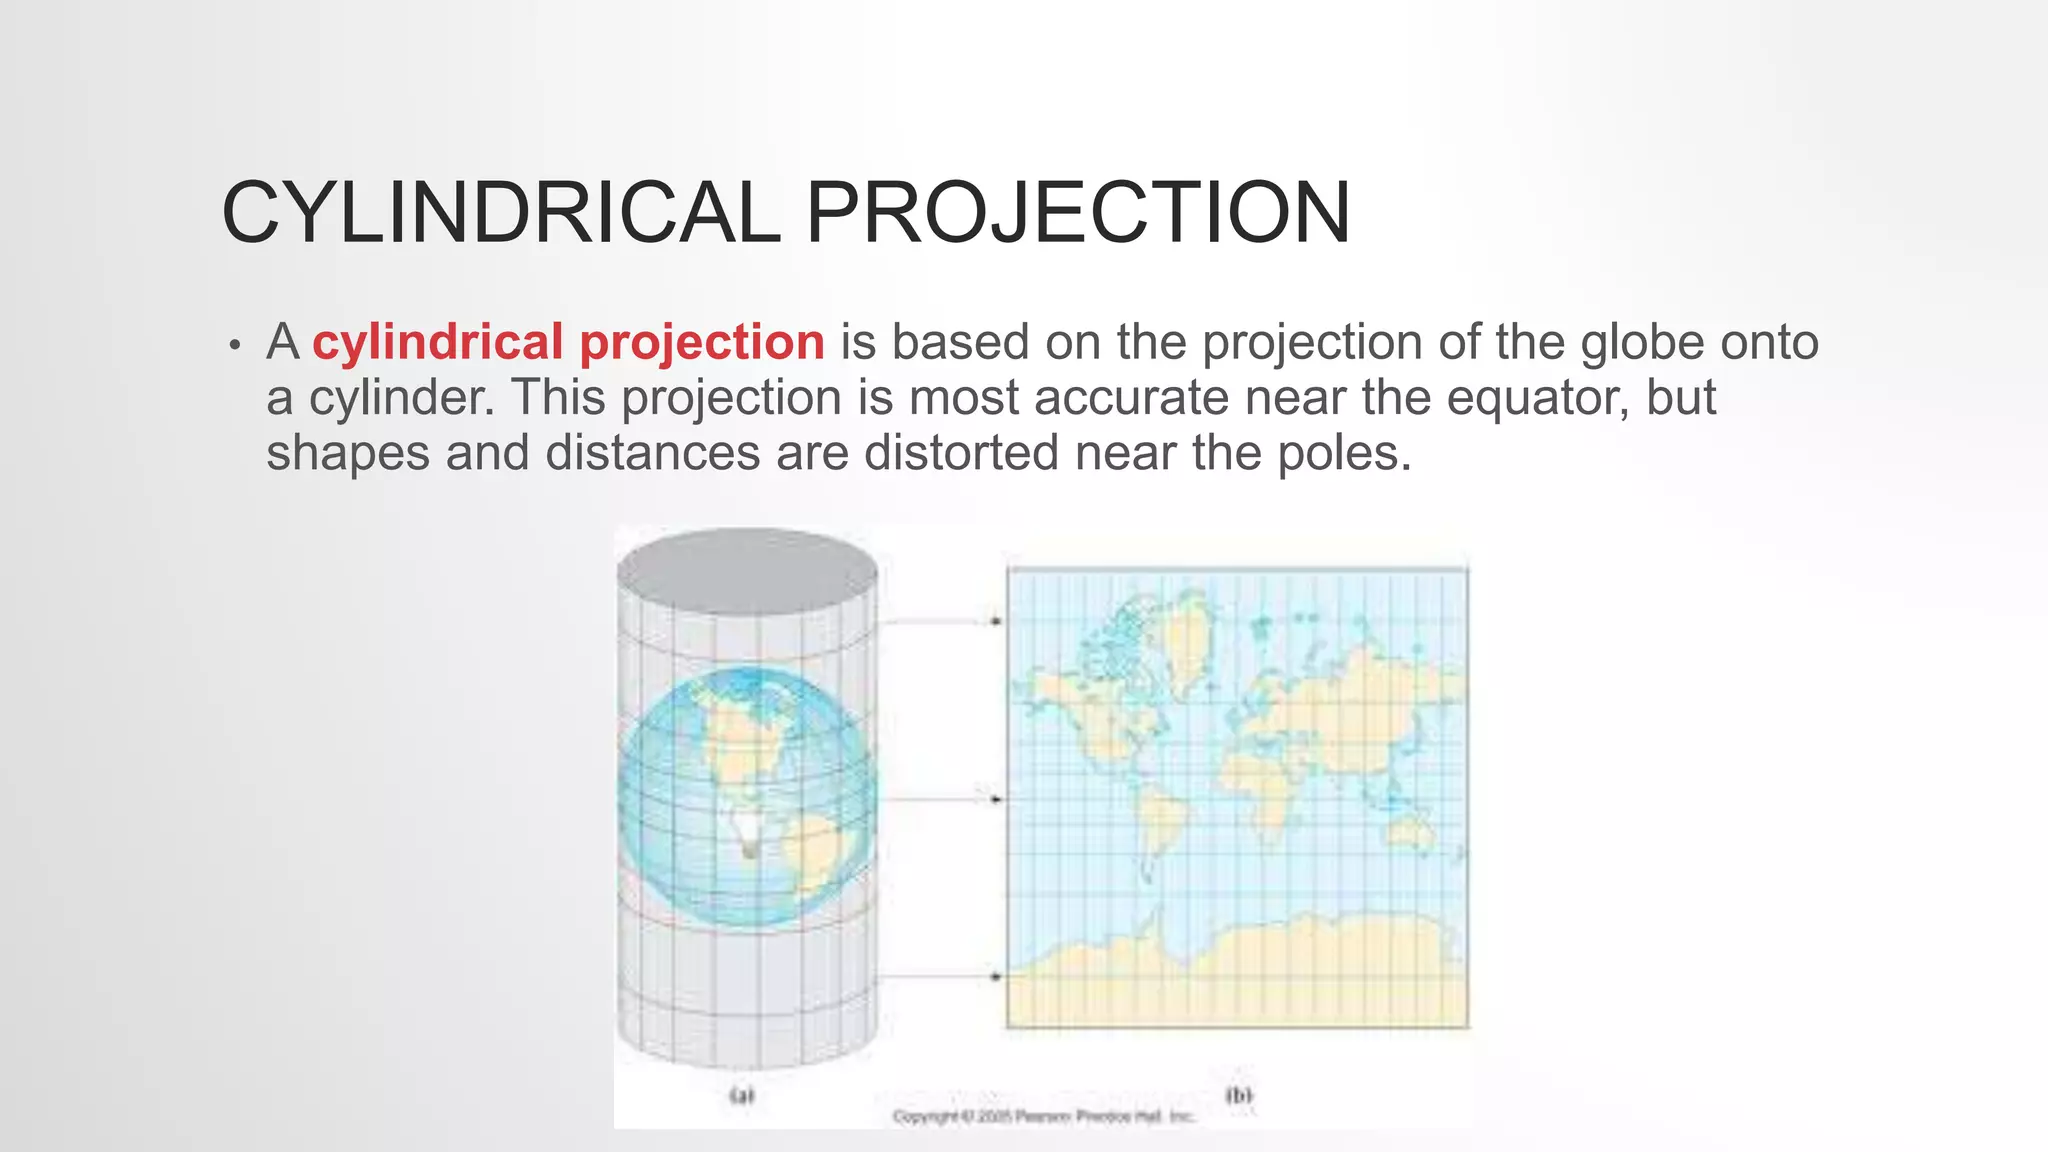
CYLINDRICAL PROJECTION
• Acylindrical projection is based on the projection of the globe onto
a cylinder. This projection is most accurate near the equator, but
shapes and distances are distorted near the poles.
10.
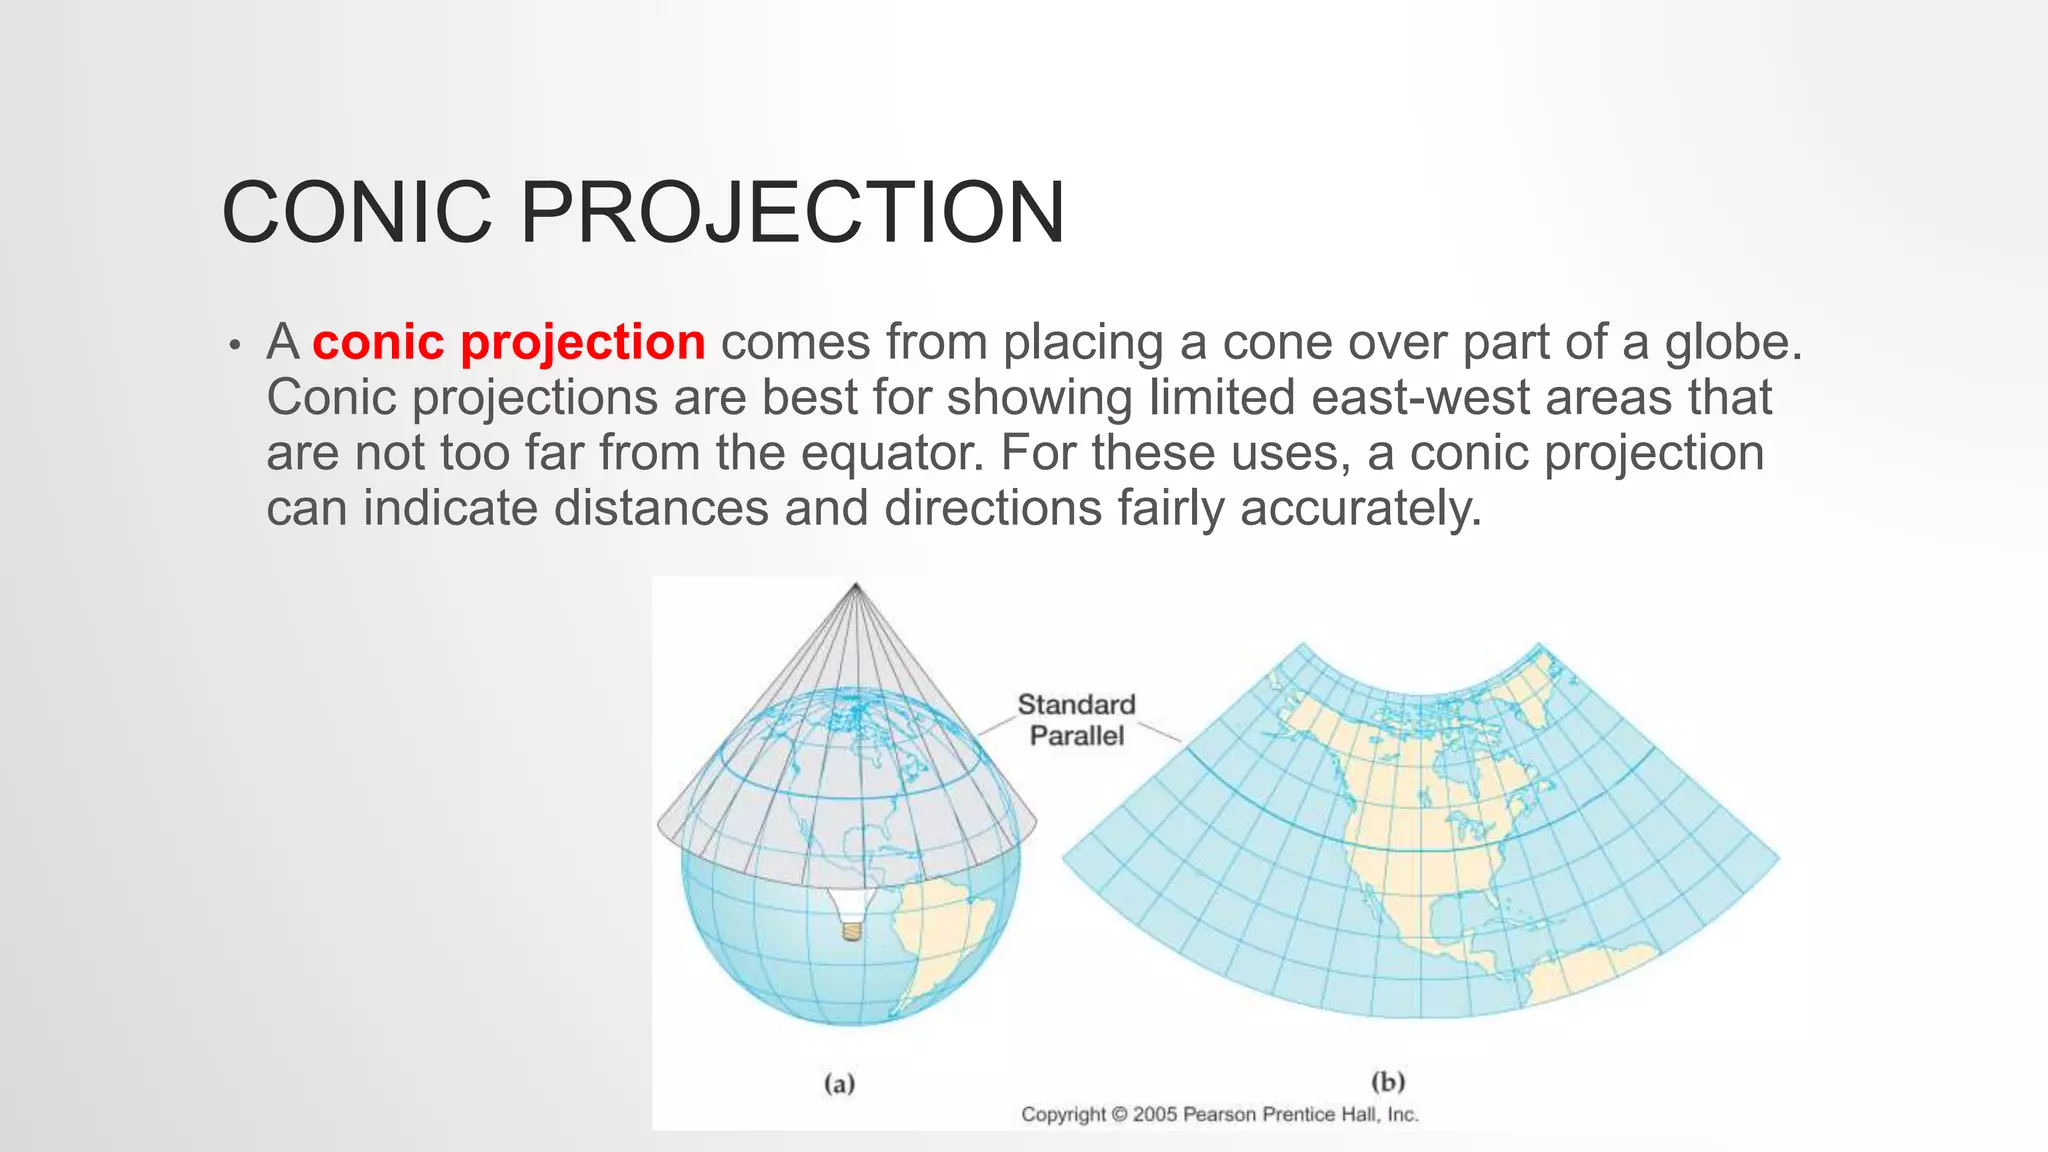
CONIC PROJECTION
• Aconic projection comes from placing a cone over part of a globe.
Conic projections are best for showing limited east-west areas that
are not too far from the equator. For these uses, a conic projection
can indicate distances and directions fairly accurately.
WARM-UP 8.13.14
On anindex card answer the following:
How many hemispheres are there and what are they?
Of latitude and longitude, which one’s lines are parallel?
14.
DETERMINING LOCATION
• Gridsystem
• Hemisphere
• Latitude: circle the Earth parallel to the Equator and measure the
distance north or south
• Longitude: meridians that circle the Earth from Pole to Pole and
measure distance east or west of the Prime Meridian at 0° longitude.
HEMISPHERES
• Northern hemisphere– everything north of Equator
• Southern hemisphere – everything south of Equator
• Eastern hemisphere – everything east of Prime Meridian
• Western hemisphere – everything west of Prime Meridian
17.
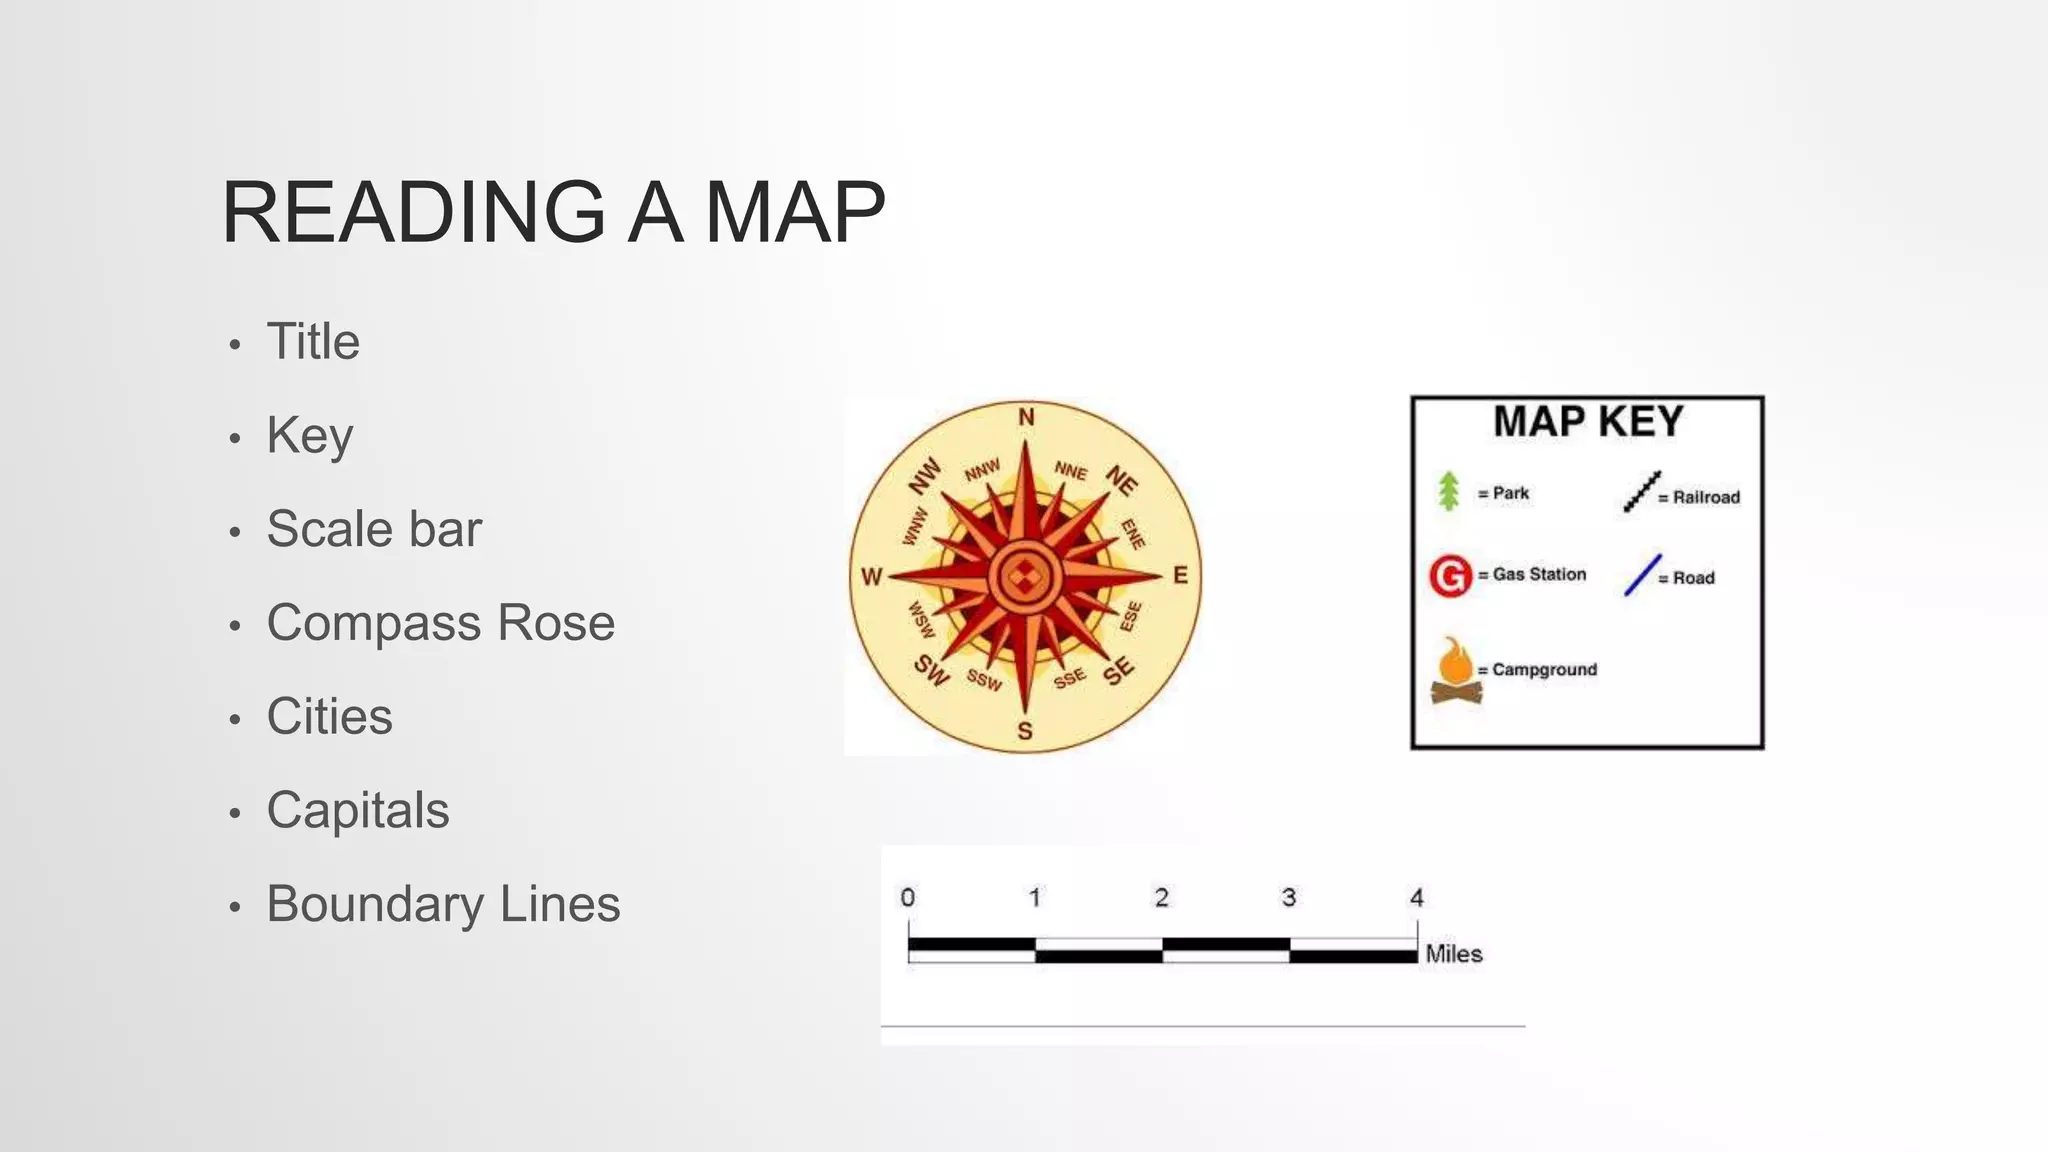
READING A MAP
•Title
• Key
• Scale bar
• Compass Rose
• Cities
• Capitals
• Boundary Lines
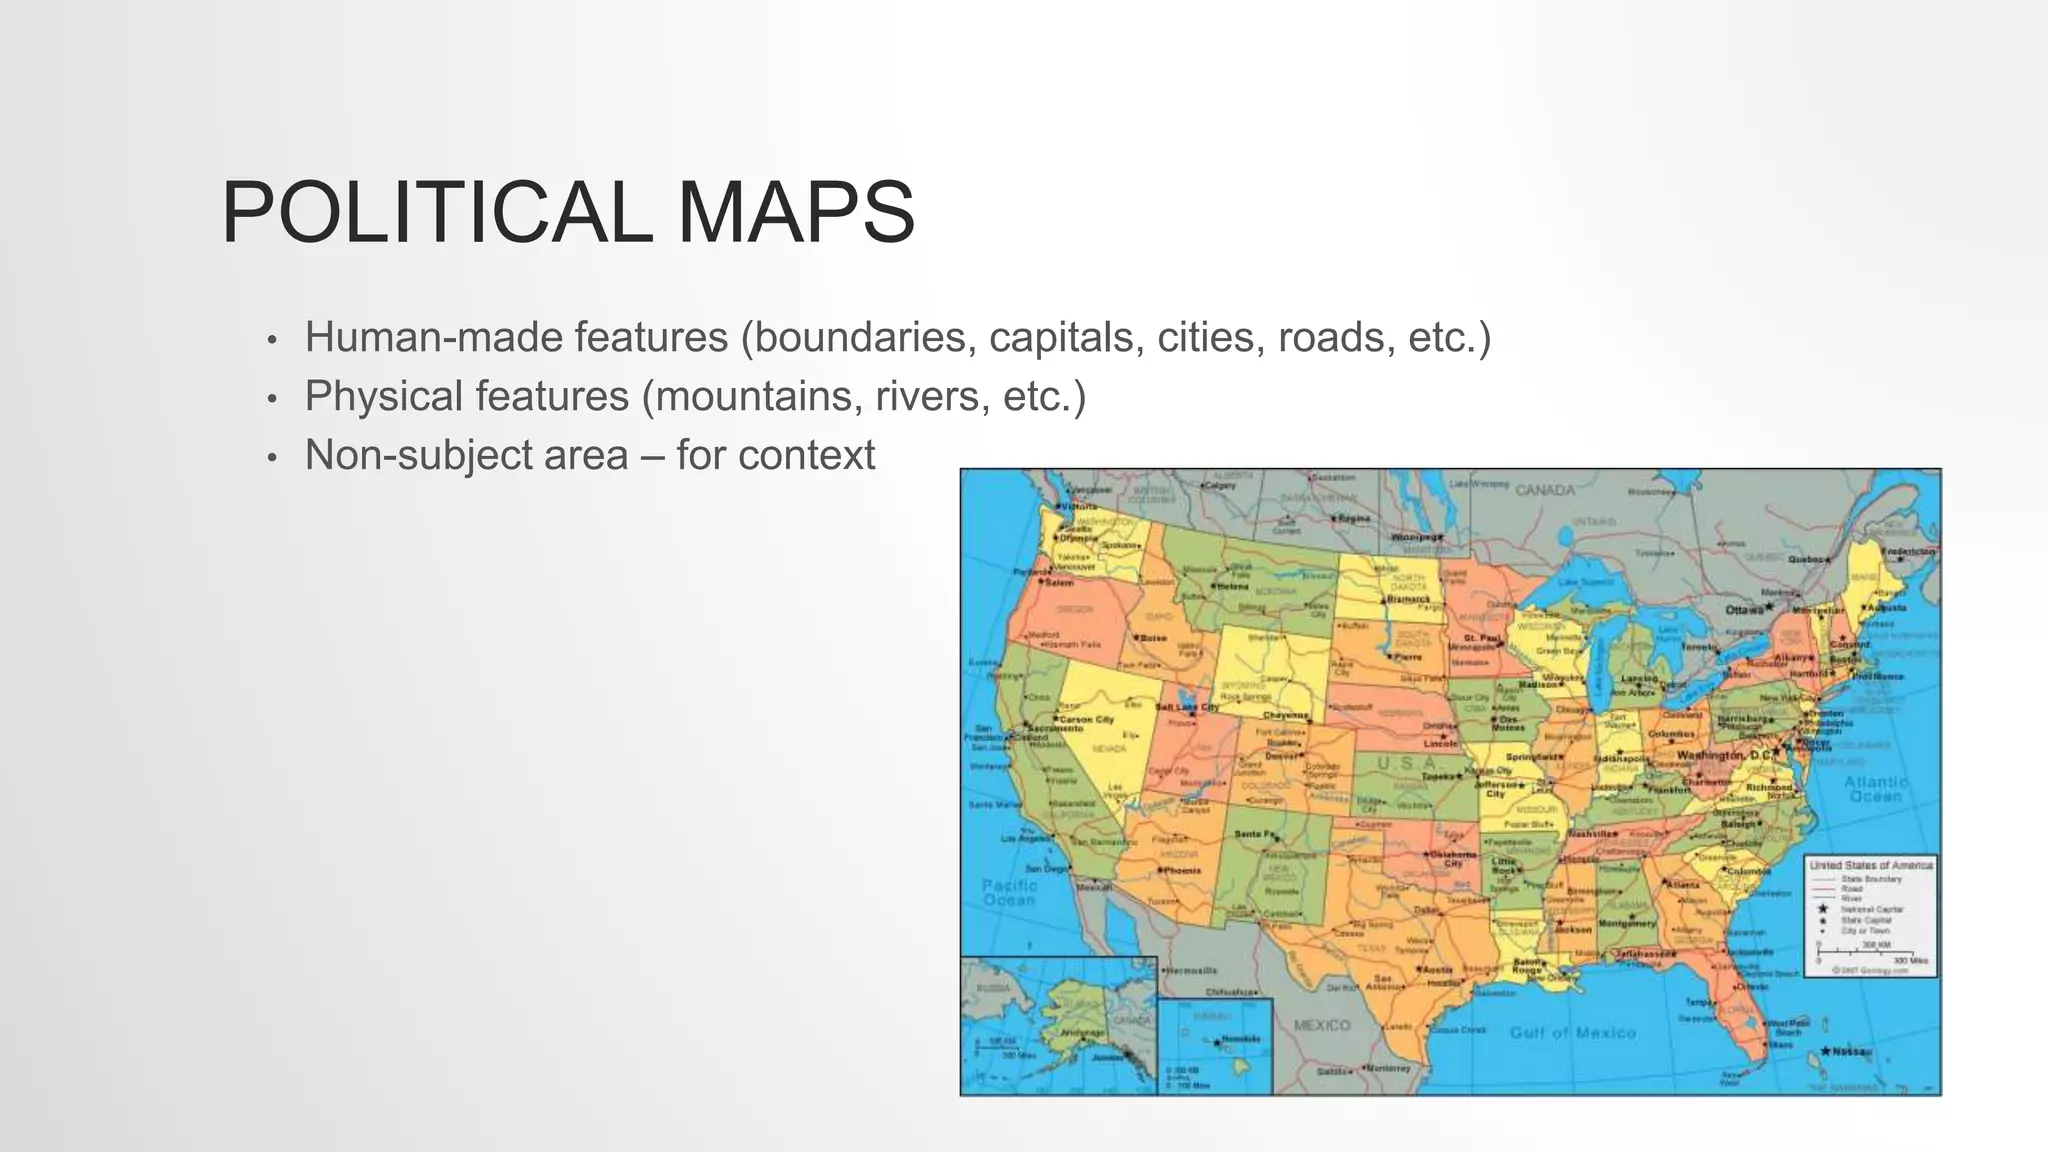
POLITICAL MAPS
• Human-madefeatures (boundaries, capitals, cities, roads, etc.)
• Physical features (mountains, rivers, etc.)
• Non-subject area – for context
20.
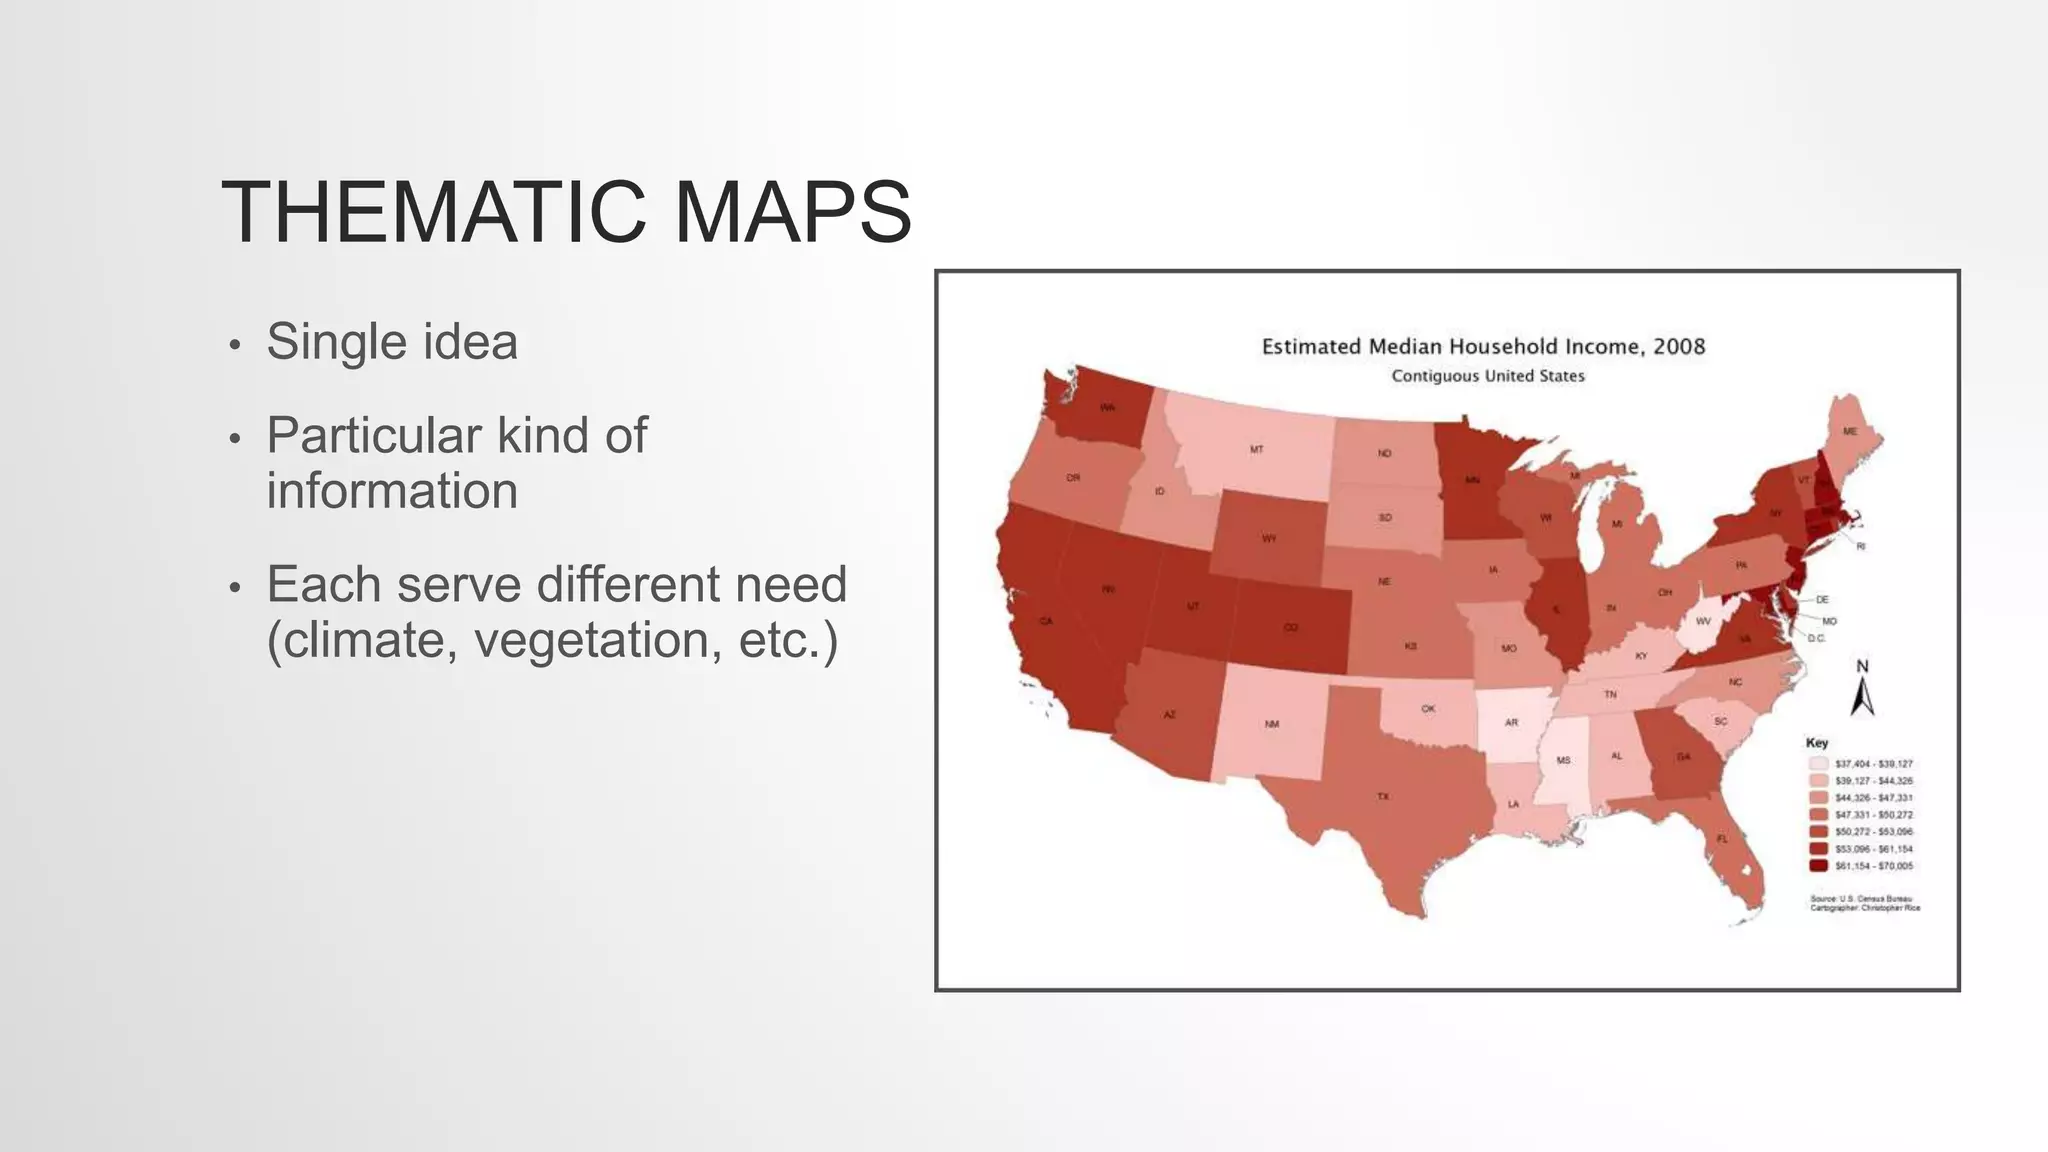
THEMATIC MAPS
• Singleidea
• Particular kind of
information
• Each serve different need
(climate, vegetation, etc.)
21.
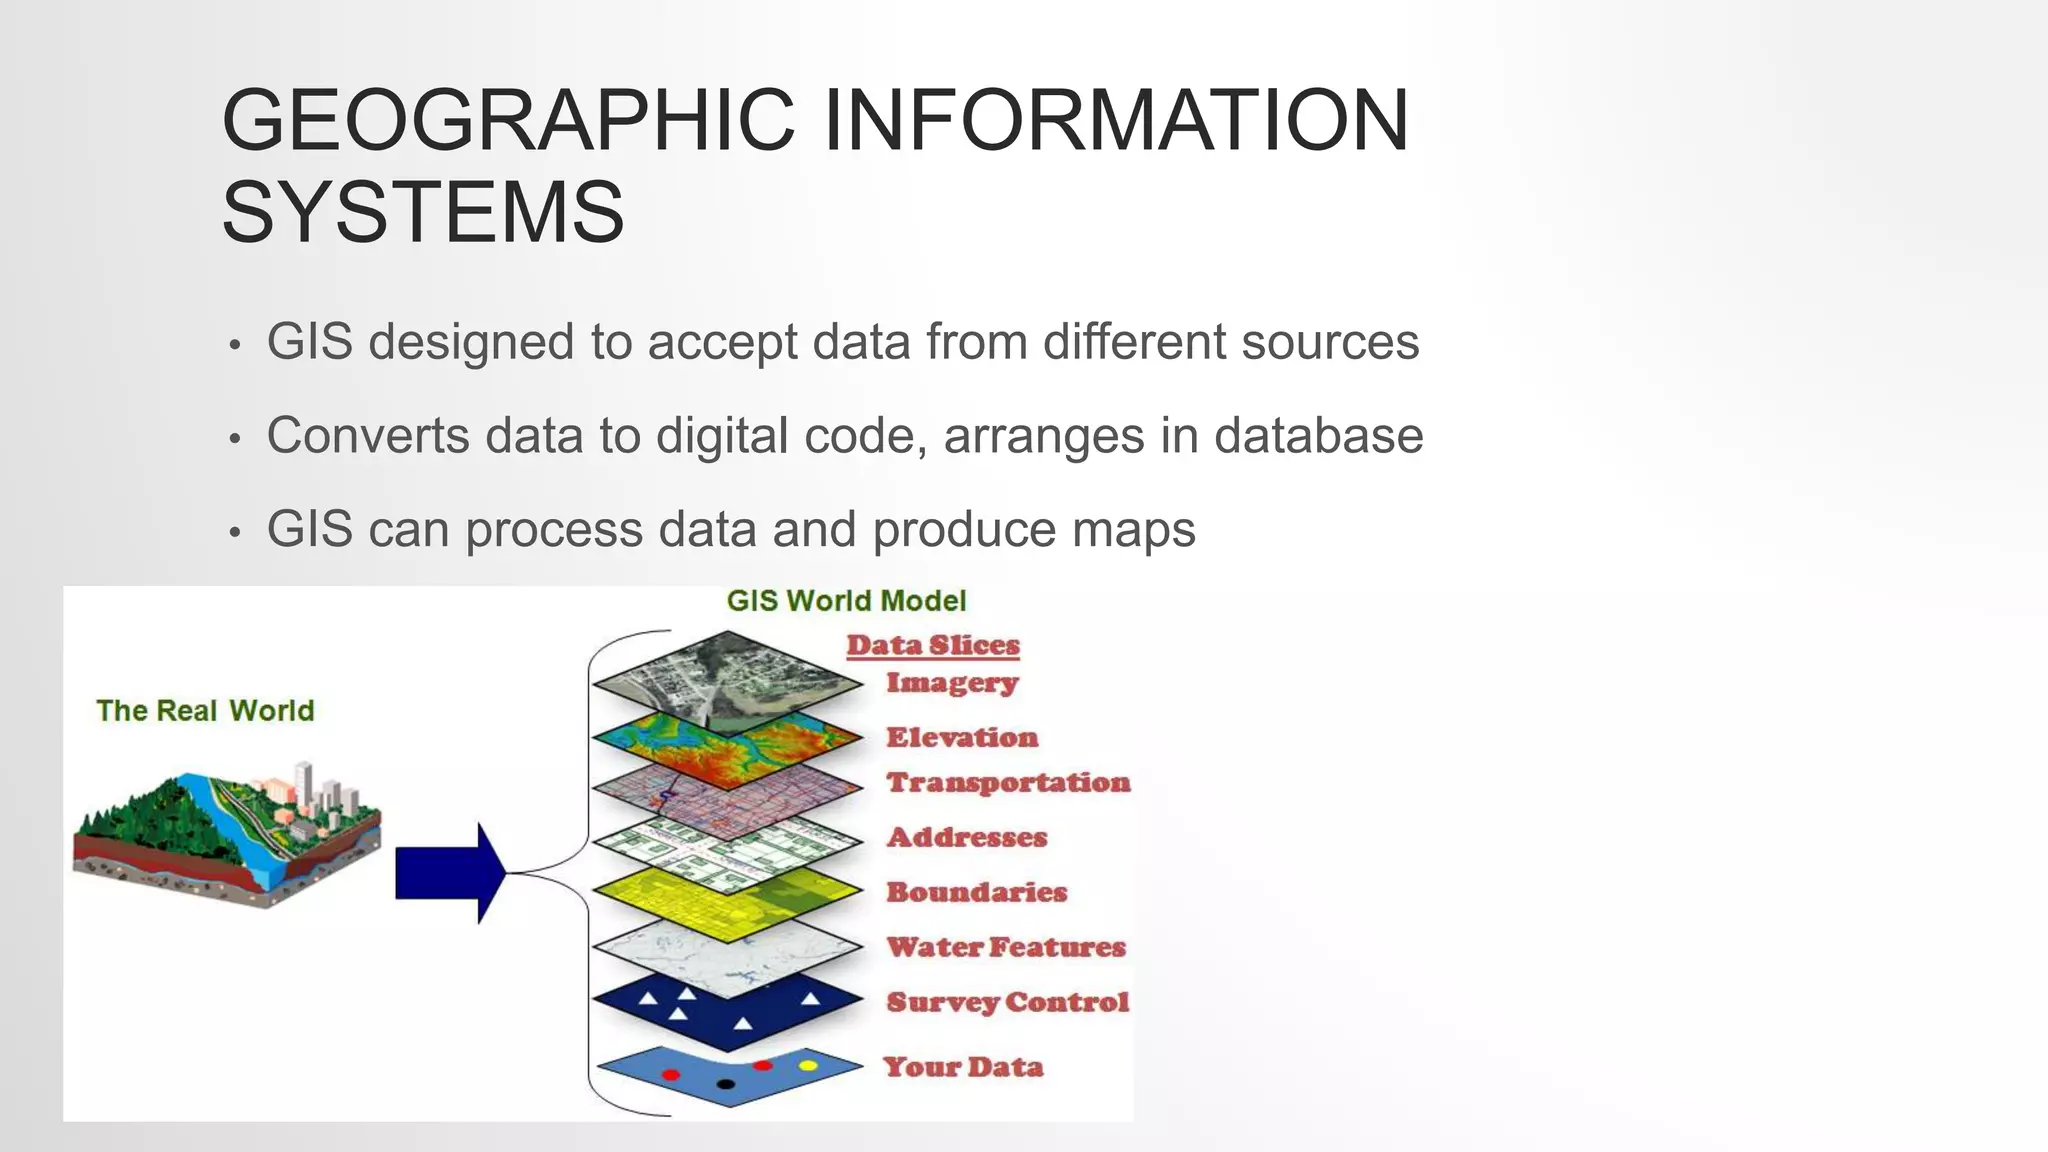
GEOGRAPHIC INFORMATION
SYSTEMS
• GISdesigned to accept data from different sources
• Converts data to digital code, arranges in database
• GIS can process data and produce maps
Editor's Notes
#6 A globe present the most accurate depiction of geographic information such as area, distance, and direction because it is round like the Earth. However, it shows little close-up detail. Maps can show small areas in great detail.
#7 Because Earth is curved a straight line on a map is not always the shortest distance between two points. So to find the shortest distance between two places stretch a string around a globe from one point to the other. Ship captains and airline pilots use great circle routes to reduce travel time and save fuel. On a flat map the great circle distance appears to be longer. Tokyo to Japan is about 315 miles shorter using great circle route.
#15 Geography is said to begin with the question Where? The basic tool for answering this question is location. Lines on globes and maps provide info that can help locate places. The lines cross one another forming a grid system which helps you find exact places. Hemisphere is one of the halves into which the Earth is divided; this helps geographers classify and describe places on Earth. Most places are located in two of the four hemispheres.
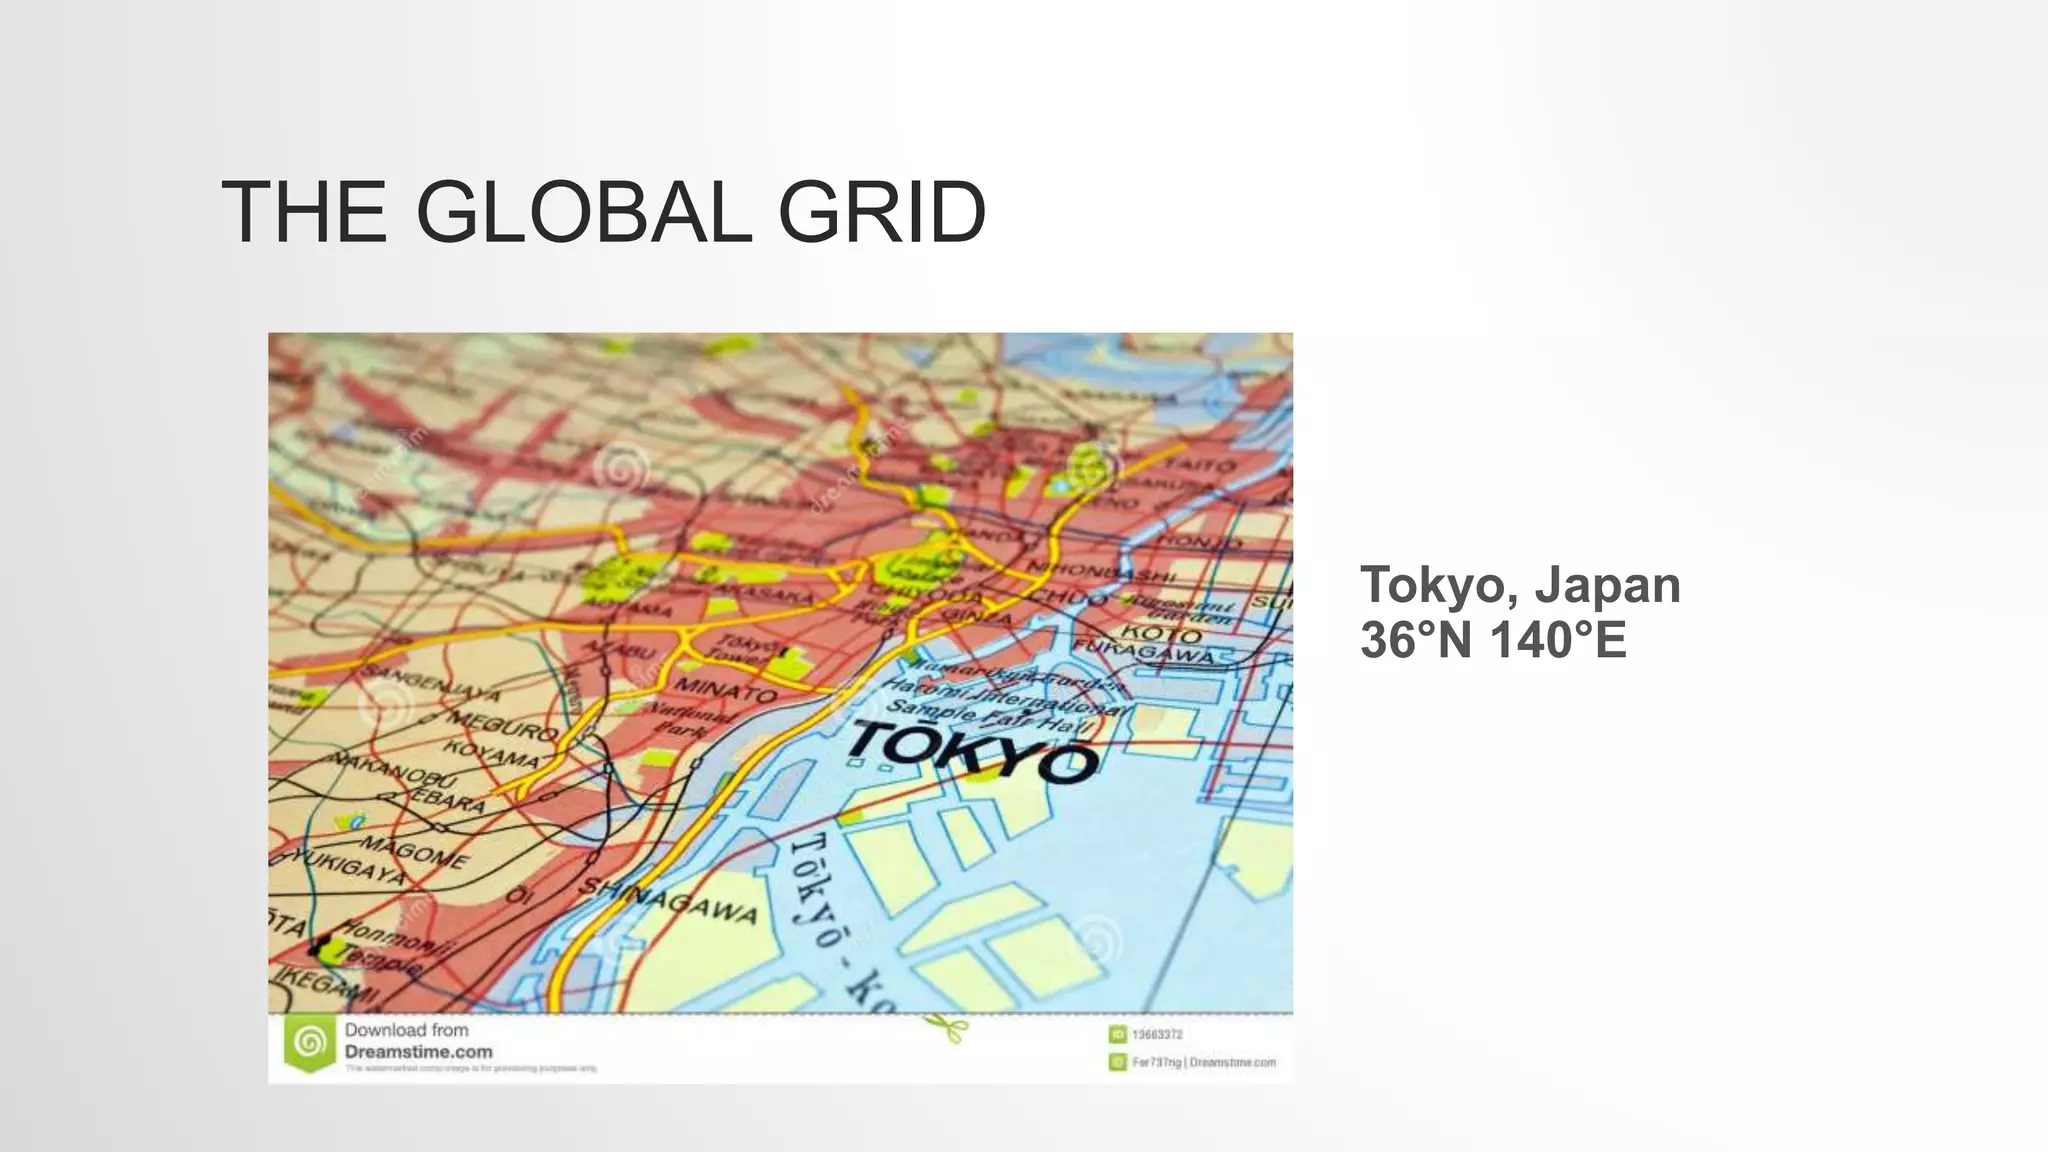
#16 Every place has a global address or absolute location and that can be identified by naming the latitude and longitude lines that cross exactly at that place. E.g., Tokyo is located at 36°N latitude and 140°E longitude.
#18 Title tells what kind of info map is showing; key list and explains symbols, colors, and lines – sometimes called a legend; scale bar shows relationship between map measurements and actual distances on earth; compass rose indicates direction; cities are represented by dots; capitals are often represented by a star w/I a circle; boundary lines on political maps highlight borders between countries and states.
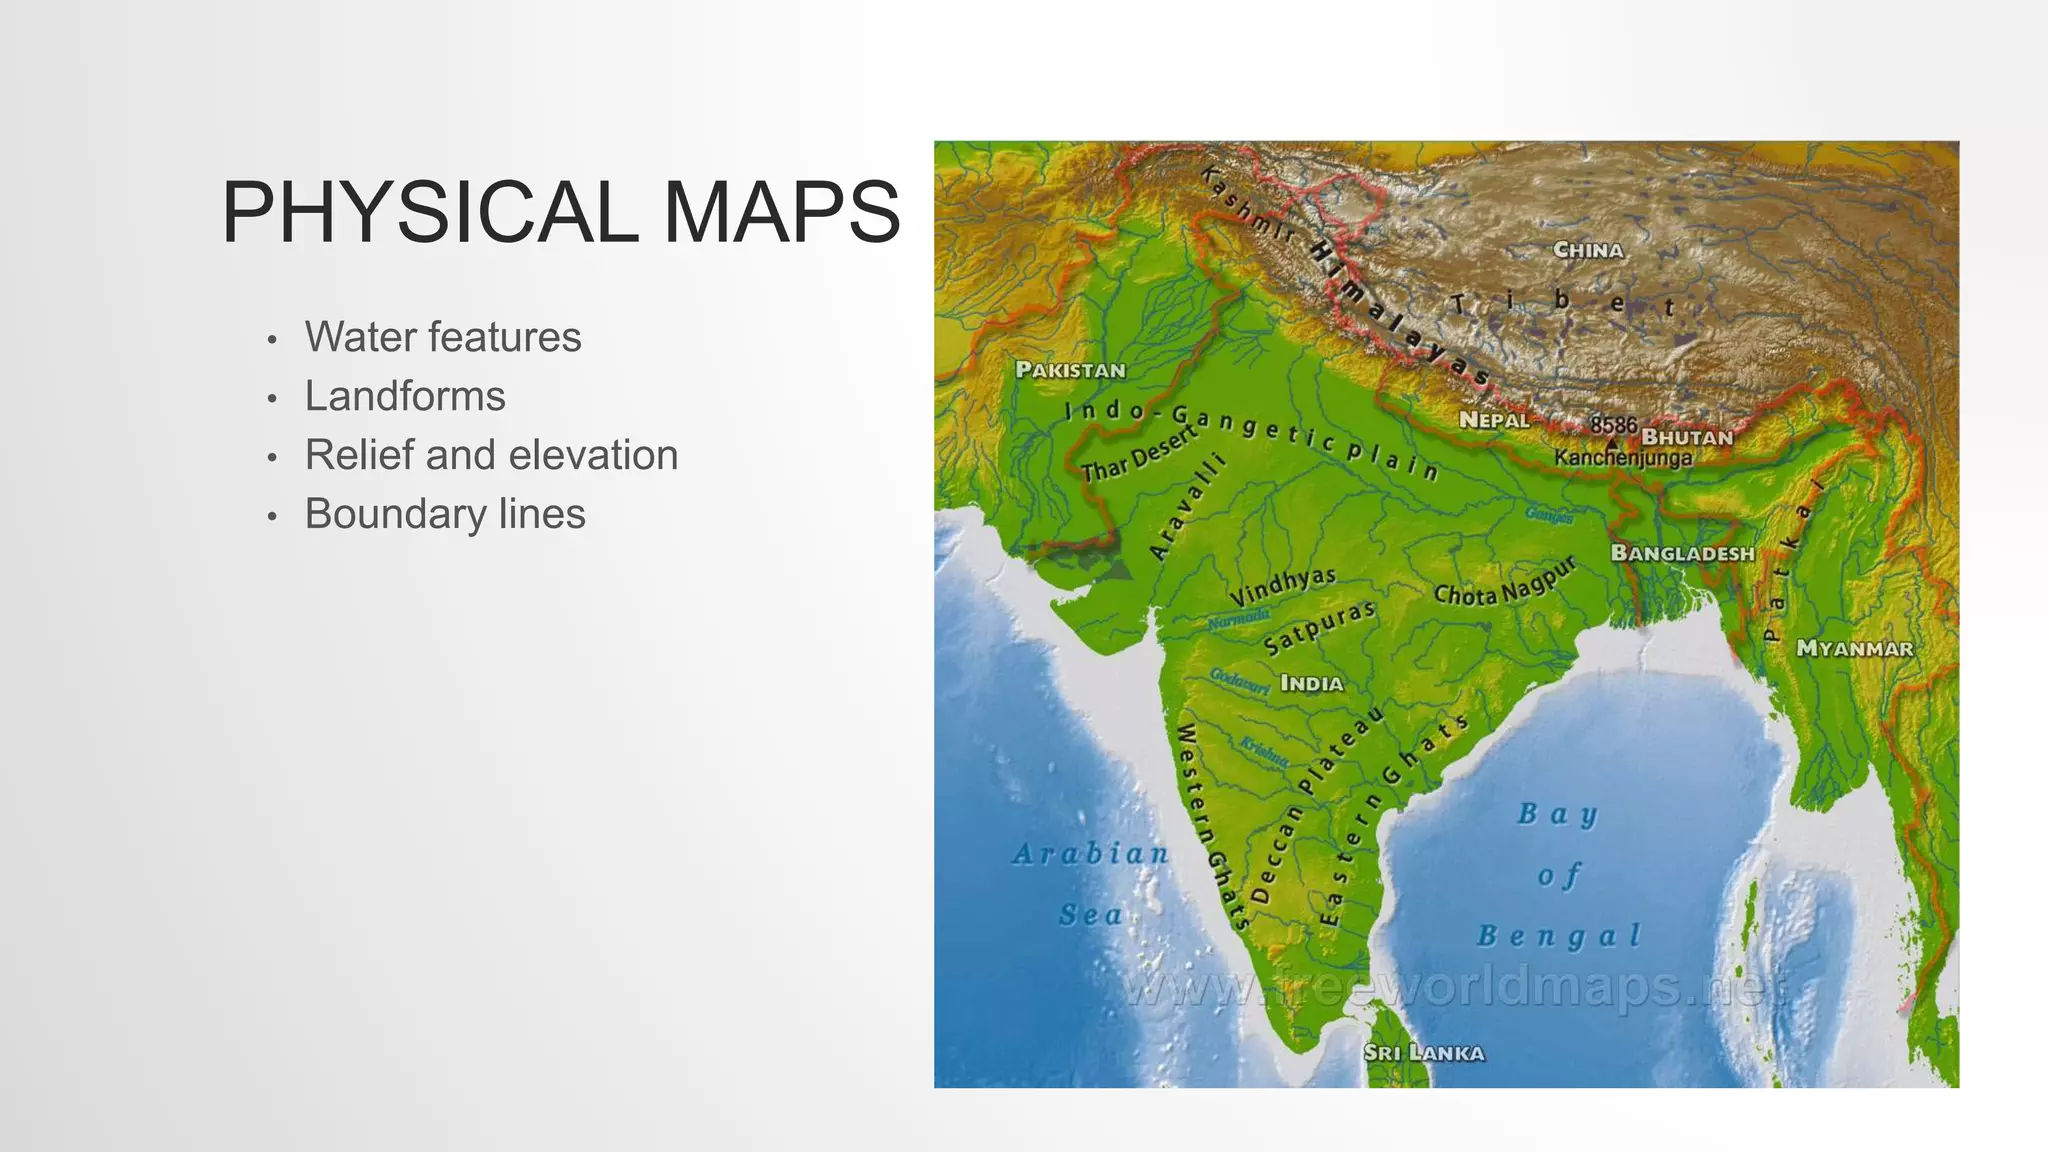
#19 Physcial maps show location and topography or shape of Earths physical features. Relief is differences in elevation or height.
#20 Political maps show boundaries and locations of political units such as countries, states, counties, cities, and towns. Many features on political map are human-made.
#21 Thematic maps empahsize a single idea or particular kind of information. Many different kinds such as ones that show climate, natural vegetation, population density, economic activities, etc.
#22 Different sources GIS collects data from: maps, satellite images, printed text, statistics. With GIS each kind of information on a map is saved as separate electronic layer. GIS technology allows cartographers to make and change maps quickly and easily.


![Introto geography[1]](https://cdn.slidesharecdn.com/ss_thumbnails/introtogeography1-130411124640-phpapp02-thumbnail.jpg?width=640&height=640&fit=bounds)


