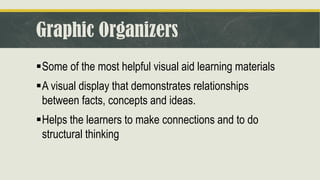
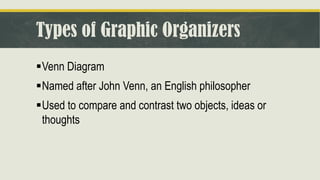
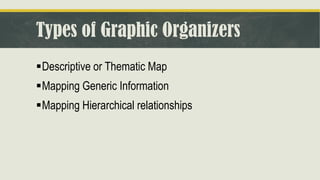
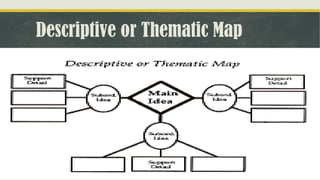
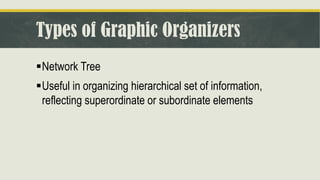
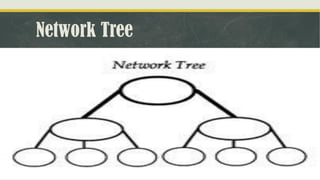
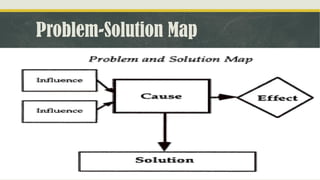
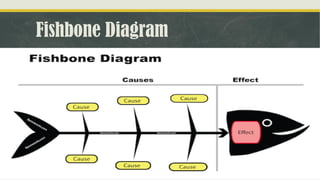
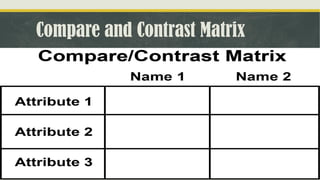
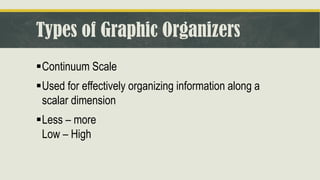
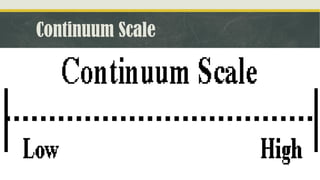
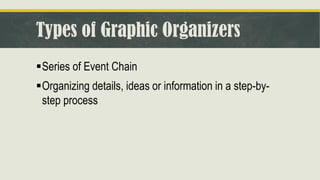
Graphic Organizers
Reading and Writing
Graphic Organizers
▪Some of the most helpful visual aid learning materials
▪A visual display that demonstrates relationships
between facts, concepts and ideas.
▪Helps the learners to make connections and to do
structural thinking
Types of Graphic Organizers
▪Venn Diagram
▪Named after John Venn, an English philosopher
▪Used to compare and contrast two objects, ideas or
thoughts
Venn Diagram
Types of Graphic Organizers
▪Descriptive or Thematic Map
▪Mapping Generic Information
▪Mapping Hierarchical relationships
Descriptive or Thematic Map
Types of Graphic Organizers
▪Network Tree
▪Useful in organizing hierarchical set of information,
reflecting superordinate or subordinate elements
Network Tree
Types of Graphic Organizers
▪Spider Map
▪Useful when organizing information or ideas that does
not fit into a hierarchy
▪Also useful for brainstorming
Spider Map
Types of Graphic Organizers
▪Problem-Solution Map
▪Useful in determining and analyzing the cause of a
certain problem, and stating the consequential effect of
that certain cause, and determining the appropriate
solution
Problem-Solution Map
Types of Graphic Organizers
▪Problem-Solution Outline
▪Useful in analyzing and comparing different solutions
for a single problem
Problem-Solution Outline
Types of Graphic Organizers
▪Sequential Episodic Map
▪Useful for determining and mapping the influences that
led to the cause of the problem and what are its
corresponding effects
Sequential Episodic Map
Types of Graphic Organizers
▪Fishbone Diagram
▪Invented by Dr. Kaoru Ishikawa, a Japanese quality
control expert
▪Uses for determining and mapping potential causes
according to their level of importance and hierarchy
and its effect/s
Fishbone Diagram
Types of Graphic Organizers
▪Fishbone Map
▪Used when analyzing non-redundant cause-effect
relationships
Fishbone Map
Types of Graphic Organizers
▪Comparative and Contrastive Map
▪Used when comparing and contrasting details,
characteristics or information about two significant
object
Comparative and Contrastive Map
Types of Graphic Organizers
▪Compare and Contrast Matrix
▪Used when comparing and contrasting details,
characteristics or information about two significant
object
▪Tabular form of Comparative and Contrastive Map
Compare and Contrast Matrix
Types of Graphic Organizers
▪Continuum Scale
▪Used for effectively organizing information along a
scalar dimension
▪Less – more
Low – High
Continuum Scale
Types of Graphic Organizers
▪Series of Event Chain
▪Organizing details, ideas or information in a step-by-
step process
Series of Events Chain
Types of Graphic Organizers
▪Cycle Map
▪Useful in organizing information that forms a cyclical
pattern
▪Has no absolute or beginning
Cycle Map

Reading and Writing - Graphic Organizers

  • 1.
  • 2.
    Graphic Organizers ▪Some ofthe most helpful visual aid learning materials ▪A visual display that demonstrates relationships between facts, concepts and ideas. ▪Helps the learners to make connections and to do structural thinking
  • 3.
    Types of GraphicOrganizers ▪Venn Diagram ▪Named after John Venn, an English philosopher ▪Used to compare and contrast two objects, ideas or thoughts
  • 4.
  • 5.
    Types of GraphicOrganizers ▪Descriptive or Thematic Map ▪Mapping Generic Information ▪Mapping Hierarchical relationships
  • 6.
  • 7.
    Types of GraphicOrganizers ▪Network Tree ▪Useful in organizing hierarchical set of information, reflecting superordinate or subordinate elements
  • 8.
  • 9.
    Types of GraphicOrganizers ▪Spider Map ▪Useful when organizing information or ideas that does not fit into a hierarchy ▪Also useful for brainstorming
  • 10.
  • 11.
    Types of GraphicOrganizers ▪Problem-Solution Map ▪Useful in determining and analyzing the cause of a certain problem, and stating the consequential effect of that certain cause, and determining the appropriate solution
  • 12.
  • 13.
    Types of GraphicOrganizers ▪Problem-Solution Outline ▪Useful in analyzing and comparing different solutions for a single problem
  • 14.
  • 15.
    Types of GraphicOrganizers ▪Sequential Episodic Map ▪Useful for determining and mapping the influences that led to the cause of the problem and what are its corresponding effects
  • 16.
  • 17.
    Types of GraphicOrganizers ▪Fishbone Diagram ▪Invented by Dr. Kaoru Ishikawa, a Japanese quality control expert ▪Uses for determining and mapping potential causes according to their level of importance and hierarchy and its effect/s
  • 18.
  • 19.
    Types of GraphicOrganizers ▪Fishbone Map ▪Used when analyzing non-redundant cause-effect relationships
  • 20.
  • 21.
    Types of GraphicOrganizers ▪Comparative and Contrastive Map ▪Used when comparing and contrasting details, characteristics or information about two significant object
  • 22.
  • 23.
    Types of GraphicOrganizers ▪Compare and Contrast Matrix ▪Used when comparing and contrasting details, characteristics or information about two significant object ▪Tabular form of Comparative and Contrastive Map
  • 24.
  • 25.
    Types of GraphicOrganizers ▪Continuum Scale ▪Used for effectively organizing information along a scalar dimension ▪Less – more Low – High
  • 26.
  • 27.
    Types of GraphicOrganizers ▪Series of Event Chain ▪Organizing details, ideas or information in a step-by- step process
  • 28.
  • 29.
    Types of GraphicOrganizers ▪Cycle Map ▪Useful in organizing information that forms a cyclical pattern ▪Has no absolute or beginning
  • 30.