SlideShare a Scribd company logo
Assessment Tools
Criteria Excellent Good Fair
OBJECTIVES
30
CONTENT ALIGNS
WITH THE OBJECTIVES
AND ILLUSTRATIONS
RELATED WITH
DISEASES 12/15
CONTENT ALLIGNS
WITH OBJECTIVES
AND ILLUSTRATIONS
RELATED WITH
DISEASES GOOD
6/10
CONTENT ALLIGNS
WITH DISEASES IS NOT
SUFFICIENT.
2/5
INTEGRATION
TECHNOLOGY
20
TECHNOLOGY
INTEGRATED WITH
THE DISEASES IS
EXCELLENT 9/10
TECHNOLOGY
RELATED WITH THE
DISEASES IS NOT UP
TO THE MARK.3/5
TECHNOLOGY
RELATED WITH THE
DISEASES IS NOT UP
TO THE MARK. 2/5
IMPLEMENTATION
20 PROJECT CAN BE
EASILY MPLEMENTED
TO ALL CLASSES
FROM 9TH TO 12TH. 9/10
PROJECT CANNOT BE
IMPLEMENTED TO
ALL CLASSES IN CASE
OF PRACTICAL
WORK.2/5
PROJECT CANNOT BE
RELATED TO SOME
LOWER CLASSES
CURRICULUM.HENCE IT
IS NOT IMPLEMENTED
TO ALL CLASSES. 0/5
GRAPHS AND
PICTURES
10
GRAPHS AND
PICTURES RELATED
WITH THE DISEASES
EXCELLENT/10
GRAPHS AND
PICTURE RELATED
WITH DISEASES IS
NOT UP TO THE
MARK. 0/5
GRAPHS AND PICTURE
RELATED WITH
DISEASES IS NOT
CLEAR.
0/5
SOUNDS
10
SOUNDS RELATED TO
THE TITLES OF THE
SLIDES CONCERNED
WITH THE DISEASES
ARE EXCELLENT. 3/5
SOUNDS RELATED
WITH THE DISEASES
ARE GOOD.
3/3
SOUNDS RELATED
WITH DIAGRAM SLIDE
ARE NOT PROPER. 1/2
LAYOUT
10
PRESENTATIONS OF
SLIDES ARE IN
SEQUENTIAL ORDER.
7/5
PRESENTATION OF
SLIDES IN
ACCORDANCE WITH
THE DETAILS OF THE
SUBJECT IS NOT
SUFFICIENT.3/3
PRESENTATION OF THE
DISEASES IS NOT
SUFFICIENT. 0/2
These tools are for immediate use with students in the classroom. They are suitable for use in
many different contexts and are aimed at improving assessment practices. A range of schools
across Victoria have used some of these tools and their feedback and suggestions for use are
included.
The tools are grouped under the following headings:
Graphic organisers - tools to visually represent thoughts, ideas, knowledge and concepts. They
help to organise thoughts and to promote understanding. This section contains sample graphic
organisers and some examples of how they were successfully used by schools for various
purposes.
Star Spider Fishbone Cloud Tree Chain
Continu
um Cycle Clocks
Flowch
art
Venn
Chart/M
atrix
Pie
Chart/
Circle
Graph
T-Chart
Y-
Chart
PMI KWHL
Semant
ic
Feature
Analysi
s
Cause
and
Effect
Compa
re and
Contras
t
Decision
Making
Fact/Opi
nion
Vocabular
y
Paragr
aph
Persuas
ion
Main/Supp
oring Ideas
5 W's
Newspa
per
Charac
ter
Traits
Story
Map/
Book
Report
Non-
Fiction
Book
Report
Brainstor
ming
Charts
Plants
Animal
Report
Geography
Report
Native
Americ
ans
Biograp
hy
Astrono
my
Report
Math
Scientific
Method
Reading
Logs
Wheels
Review and reflection tools - enable students to review and reflect on their knowledge,
progress, and what they have learnt and achieved during a unit, topic or project. Some tools are
specifically designed for early years students.
Feedback tools - enable students to provide feedback on their work and performance. It also
includes strategies for teachers to increase the wait time when asking questions in class.
Rubrics - printed sets of criteria for assessing knowledge, performance or product and for
giving feedback. The following tools are examples of rubrics and how they are used in schools.
Tools for planning and auditing assessment practices
The following tools can be used by teachers and school leadership teams when planning and
auditing their assessment practices:
Familiarisation and discussion tools - help develop a common understanding of assessment in
a school and are designed to familiarise teachers with formative assessment and the purpose of
assessment for learning, as learning and of learning.
Audit tool (PDF - 39Kb) - supports discussion on current assessment approaches in schools
and audit these against the Victorian Essential Learning Standards (VELS).
Graphic Organizers
Graphic organizers (some of which are also called
concept maps, entity relationship charts, and mind
maps) are a pictorial way of constructing knowledge
and organizing information. They help the student
convert and compress a lot of seemingly disjointed
information into a structured, simple-to-read, graphic
display. The resulting visual display conveys
complex information in a simple-to-understand
manner.
Increasing Understanding by Creating Graphic Organizers:
The process of converting a mass of
data/information/ideas into a graphic map gives the
student an increased understanding and insight into the
topic at hand. To create the map, the student must
concentrate on the relationships between the items and
examine the meanings attached to each of them. While
creating a map, the student must also prioritize the information, determining which
parts of the material are the most important and should be focused upon, and where
each item should be placed in the map.
The creation of graphic organizers also helps the
student generate ideas as they develop and note
their thoughts visually. The possibilities associated
with a topic become clearer as the student's ideas
are classified visually.
Uses of Graphic Organizers:
Graphic organizers can be used to structure writing
projects, to help in problem solving, decision
making, studying, planning research and
brainstorming.
Creating Graphic Organizers:
Graphic organizers can be drawn free-hand or printed. To go to
printouts of many graphic organizers, click on one of the links
above or below.
Adding color-coding and/or pictures to a graphic organizer further increases the
utility and readability of the visual display.
How to Choose a Graphic Organizer for Your Topic/Task (click on a graphic
organizer below to go to printable worksheets):
The task at hand determines the type of graphic organizer that is appropriate. The
following is a list of common graphic organizers - choose the format that best fits
your topic.
Star: If the topic involves investigating attributes associated with a single
topic, use a star diagram as your graphic organizer. Example: Finding
methods that help your study skills (like taking notes, reading, doing homework,
memorizing, etc.).
Spider: If the topic involves investigating attributes associated with a
single topic, and then obtaining more details on each of these ideas, use a
spider diagram as your graphic organizer. This is like the star graphic organizer
with one more level of detail. Example: Finding methods that help your study
skills (like taking notes, reading, memorizing, etc.), and investigating the factors
involved in performing each of the methods.
Fishbone: If the topic involves investigating multiple cause-and-effect
factors associated with a complex topic and how they inter-relate, use a
fishbone diagram as your graphic organizer. Example: Examining the effects of
improved farming methods.
Cloud/Cluster: If the topic involves generating a web of ideas based on a
stimulus topic, use a clustering diagram as your graphic organizer.
Example: brainstorming.
Tree: If the topic involves a chain of events with a beginning and with
multiple outcomes at each node (like a family tree), use a tree as your
graphic organizer. Example: Displaying the probabilistic results of tossing coins.
Chain of Events: If the topic involves a linear chain of events, with a
definite beginning, middle, and end, use a chain of events graphic
organizer. Example: Analyzing the plot of a story.
Continuum/Timeline: If the topic has definite beginning and ending
points, and a number of divisions or sequences in between, use a
continuum/timeline. Example: Displaying milestones in a person's life.
Clock: If the topic involves a clock-like cycle, use a clock graphic
organizer. Example topic: Recording the events in a typical school day or
making a story clock to summarize a story.
Cycle of Events: If the topic involves a recurring cycle of events, with no
beginning and no end, use a cyclic graphic organizer. Example topic:
Documenting the stages in the lifecycle of an animal.
Flowchart: If the topic involves a chain of instructions to follow, with a
beginning and multiple possible outcomes at some node, with rules at some
nodes, use a flowchart. Example: Computer programmers sometimes use
flowcharts to organize the algorithm before writing a program.
Venn Diagram: If the task involves examining the similarities and
differences between two or three items, use a Venn diagram. Example:
Examining the similarities and differences between fish and whales, or comparing
a book and the accompanying movie.
Chart/Matrix Diagram: If the task involves condensing and organizing
data about traits of many items, use a chart/matrix. Example: Creating a
display of key inventions, who invented them, when, where and why they were
invented, etc.
Y-Chart Diagram: If the task involves analyzing and organizing with
respect to three qualities, use a Y-Chart. Example: Fill out a Y-Chart to
describe what you know about an animal, including what it looks like, what it
sounds like, and what it feels like. Or describe a character in a book, including
what the charater looks like, sounds like, and how the charater feels.
T-Chart Diagram: If the task involves analyzing or comparing with two
aspects of the topic, use a T-Chart. Example: Fill out a T-Chart to evaluate the pros
and cons associated with a decision.
Fact/Opinion: If the task involves distinguishing the facts vs. the opinions
in a theme or text, use fact/opinion charts. Example: Fill out a fact/opinion
chart to evaluate the facts and opinions presented in a news article.
PMI Diagram: If the task involves analyzing the plusses, minuses, and
implicatios of a decision or an action, use a PMI Chart. Example: Fill out a
PMI Chart to help evaluate the positive, negative and interesting points associated
with taking a new job.
Decision Making Diagrams: If the task is making a decision, use a
graphic organizer to enumerate possible alternatives and the pros and cons
of each. Example: Fill out a desicion making diagram to help decide which elective
courses you'd like to take next quarter.
Semantic Feature Analysis Charts: If the task is comparing
characteristics among a group of items, use Semantic Feature Analysis .
Example: Fill out a Semantic Feature Analysis chart to compare and contrast the
care needed for various pets.
Cause and Effect Diagrams: If the task is examining possible causes and
effects in a process, use a cause and effect graphic organizer . Example:
Fill out a cause-and-effect diagram to trace the steps in a feedback loop..
KWHL Diagram: If the task involves analyzing and organizing what you
know and what you want to learn about a topic, use a KWHL chart. K
stands for what you already KNOW about the subject. W stands for what you
WANT to learn. H stands for figuring out HOW you can learn more about the
topic. L stands for what you LEARN as you read. Example: Fill out a KWHL chart
before, during, and after you read about a topic.
Pie Charts: If the task involves showing divisions with a group, use a pie
chart. Example: Draw a pie chart to show what percentages of a population
have blue eyes, green eyes, or brown eyes.
Vocabulary Map: Graphic organizers can be useful in helping a student
learn new vocabulary words, having them list the word, its part of speech
(noun, verb, adjective, adverb, etc.), a synonym, an antonym, a drawing that
represents the word, and a sentence using the word.
Paragraph Structure: These graphic organizers help you organize the
structure of a paragraph, including a topic sentence, sentences with support
details, and a conclusion sentence.
5 W's Diagram: If the task involves analyzing the Five W's (Who, When,
Where, What, and Why) of a story or event. Example: Fill out a 5 W's
Chart to help evaluate and understand the major points of a newspaper story.
Story Map: Story maps can help a student summarize, analyze and
understand a story or event.
Character Traits: Graphic organizers help the student identify the traits of
fictional characters by looking at events surrounding the character in the
text.
Biography Diagrams Graphic organizers are useful to help prepare for
writing a biography. Before writing, the graphic organizer prompts the
student to think about and list the major events in the person's life.
Animal Report Diagrams: Many graphic organizers are useful to help
prepare for writing a report on animals. Before writing, the student should
think about and list the major topics that will be researched and covered in the
report.
Geography Report Diagrams: These graphic organizers are useful to for
doings a short report on a country or other area. The student draws a map
and flag, and looks up basic information on the area.
Math Diagrams: Many graphic organizers are useful to learn and do math,
include Venn diagrams, star diagrams, charts, flowcharts, trees, etc.
Scientific Method Diagrams: Graphic organizers used to prepare and
organize a scientific experiment.

More Related Content

What's hot

Concept map
Concept mapConcept map
Concept map
hariom2015
 
Lesson plans: the 8 questions to ask yourself
Lesson plans: the 8 questions to ask yourselfLesson plans: the 8 questions to ask yourself
Lesson plans: the 8 questions to ask yourself
Craig Hansen
 
Reflective Writing
Reflective WritingReflective Writing
Reflective Writing
erikbohemia
 
Teaching the scientific method
Teaching the scientific methodTeaching the scientific method
Teaching the scientific method
Stefaan Vande Walle
 
Quoting, Paraphrasing and Summarizing
Quoting, Paraphrasing and SummarizingQuoting, Paraphrasing and Summarizing
Quoting, Paraphrasing and Summarizing
Zakir Hossain/ICS, Zurich
 
Science exhibition ppt
Science exhibition pptScience exhibition ppt
Science exhibition ppt
navyalekshmi
 
Teacher training
Teacher trainingTeacher training
Teacher training
Christina Dioneda
 
Critical thinking vs. creative thinking
Critical thinking vs. creative thinkingCritical thinking vs. creative thinking
Critical thinking vs. creative thinking
JANNETH OBISPO
 
Promoting creative thinking through classroom activities
Promoting creative thinking through classroom activitiesPromoting creative thinking through classroom activities
Promoting creative thinking through classroom activities
Eduardo Santos
 
Reflective Writing
Reflective WritingReflective Writing
Reflective Writing
mysciencespace
 
Strategies for creative and critical thinking
Strategies for creative and critical thinkingStrategies for creative and critical thinking
Strategies for creative and critical thinking
GCPratt
 
Educational research
Educational researchEducational research
Educational research
meenuch
 
Interrogating the text , Critical thinking
Interrogating the  text , Critical thinkingInterrogating the  text , Critical thinking
Interrogating the text , Critical thinking
Nazish Jamali
 
APA (American Psychological Association) Citation and Referencing
APA (American Psychological Association) Citation and ReferencingAPA (American Psychological Association) Citation and Referencing
APA (American Psychological Association) Citation and Referencing
Bakht Munir
 
Research Problem, Hypothesis and the Conceptual Model
Research Problem, Hypothesis and the Conceptual Model Research Problem, Hypothesis and the Conceptual Model
Research Problem, Hypothesis and the Conceptual Model
jane rose caylan
 
e-content steps mcq.pdf
e-content steps mcq.pdfe-content steps mcq.pdf
e-content steps mcq.pdf
ANISHARAJ16
 
What is Reflective Writing?
What is Reflective Writing?What is Reflective Writing?
What is Reflective Writing?
Unimelb Academic Skills
 
Reflective Writing
Reflective WritingReflective Writing
Reflective Writing
lesleymorrell
 
Concept mapping1
Concept mapping1Concept mapping1
Concept mapping1
surendra sharma
 
What makes effective questioning?
What makes effective questioning?What makes effective questioning?
What makes effective questioning?
David Drake
 

What's hot (20)

Concept map
Concept mapConcept map
Concept map
 
Lesson plans: the 8 questions to ask yourself
Lesson plans: the 8 questions to ask yourselfLesson plans: the 8 questions to ask yourself
Lesson plans: the 8 questions to ask yourself
 
Reflective Writing
Reflective WritingReflective Writing
Reflective Writing
 
Teaching the scientific method
Teaching the scientific methodTeaching the scientific method
Teaching the scientific method
 
Quoting, Paraphrasing and Summarizing
Quoting, Paraphrasing and SummarizingQuoting, Paraphrasing and Summarizing
Quoting, Paraphrasing and Summarizing
 
Science exhibition ppt
Science exhibition pptScience exhibition ppt
Science exhibition ppt
 
Teacher training
Teacher trainingTeacher training
Teacher training
 
Critical thinking vs. creative thinking
Critical thinking vs. creative thinkingCritical thinking vs. creative thinking
Critical thinking vs. creative thinking
 
Promoting creative thinking through classroom activities
Promoting creative thinking through classroom activitiesPromoting creative thinking through classroom activities
Promoting creative thinking through classroom activities
 
Reflective Writing
Reflective WritingReflective Writing
Reflective Writing
 
Strategies for creative and critical thinking
Strategies for creative and critical thinkingStrategies for creative and critical thinking
Strategies for creative and critical thinking
 
Educational research
Educational researchEducational research
Educational research
 
Interrogating the text , Critical thinking
Interrogating the  text , Critical thinkingInterrogating the  text , Critical thinking
Interrogating the text , Critical thinking
 
APA (American Psychological Association) Citation and Referencing
APA (American Psychological Association) Citation and ReferencingAPA (American Psychological Association) Citation and Referencing
APA (American Psychological Association) Citation and Referencing
 
Research Problem, Hypothesis and the Conceptual Model
Research Problem, Hypothesis and the Conceptual Model Research Problem, Hypothesis and the Conceptual Model
Research Problem, Hypothesis and the Conceptual Model
 
e-content steps mcq.pdf
e-content steps mcq.pdfe-content steps mcq.pdf
e-content steps mcq.pdf
 
What is Reflective Writing?
What is Reflective Writing?What is Reflective Writing?
What is Reflective Writing?
 
Reflective Writing
Reflective WritingReflective Writing
Reflective Writing
 
Concept mapping1
Concept mapping1Concept mapping1
Concept mapping1
 
What makes effective questioning?
What makes effective questioning?What makes effective questioning?
What makes effective questioning?
 

Viewers also liked

Faculty cum system administrator time table
Faculty cum system administrator time tableFaculty cum system administrator time table
Faculty cum system administrator time table
K G MALLIKARJAN
 
Chemistry slot test 6
Chemistry slot test   6Chemistry slot test   6
Chemistry slot test 6
K G MALLIKARJAN
 
Curriculam ict
Curriculam ictCurriculam ict
Curriculam ict
K G MALLIKARJAN
 
Chemistry slot test 7
Chemistry slot test  7Chemistry slot test  7
Chemistry slot test 7
K G MALLIKARJAN
 
Chemistry slot test 4
Chemistry slot test   4Chemistry slot test   4
Chemistry slot test 4
K G MALLIKARJAN
 
Chemistry slot test 8
Chemistry slot test   8Chemistry slot test   8
Chemistry slot test 8
K G MALLIKARJAN
 
Chemistry slot test 2
Chemistry slot test 2Chemistry slot test 2
Chemistry slot test 2
K G MALLIKARJAN
 
Chemistry slot test 3
Chemistry slot test 3Chemistry slot test 3
Chemistry slot test 3
K G MALLIKARJAN
 
Nvs2 numerical made easy
Nvs2   numerical made easyNvs2   numerical made easy
Nvs2 numerical made easy
K G MALLIKARJAN
 
Concave mirror
Concave mirrorConcave mirror
Concave mirror
K G MALLIKARJAN
 
Chemistry slot test 1
Chemistry slot test 1Chemistry slot test 1
Chemistry slot test 1
K G MALLIKARJAN
 
Resoning
ResoningResoning
Resoning
K G MALLIKARJAN
 

Viewers also liked (12)

Faculty cum system administrator time table
Faculty cum system administrator time tableFaculty cum system administrator time table
Faculty cum system administrator time table
 
Chemistry slot test 6
Chemistry slot test   6Chemistry slot test   6
Chemistry slot test 6
 
Curriculam ict
Curriculam ictCurriculam ict
Curriculam ict
 
Chemistry slot test 7
Chemistry slot test  7Chemistry slot test  7
Chemistry slot test 7
 
Chemistry slot test 4
Chemistry slot test   4Chemistry slot test   4
Chemistry slot test 4
 
Chemistry slot test 8
Chemistry slot test   8Chemistry slot test   8
Chemistry slot test 8
 
Chemistry slot test 2
Chemistry slot test 2Chemistry slot test 2
Chemistry slot test 2
 
Chemistry slot test 3
Chemistry slot test 3Chemistry slot test 3
Chemistry slot test 3
 
Nvs2 numerical made easy
Nvs2   numerical made easyNvs2   numerical made easy
Nvs2 numerical made easy
 
Concave mirror
Concave mirrorConcave mirror
Concave mirror
 
Chemistry slot test 1
Chemistry slot test 1Chemistry slot test 1
Chemistry slot test 1
 
Resoning
ResoningResoning
Resoning
 

Similar to Assessment tools

02. Techniques-in-Selecting-and-Organizing-Information.pptx
02. Techniques-in-Selecting-and-Organizing-Information.pptx02. Techniques-in-Selecting-and-Organizing-Information.pptx
02. Techniques-in-Selecting-and-Organizing-Information.pptx
Angelyn Lingatong
 
EED406 2014 E-tivity 3
EED406 2014 E-tivity 3EED406 2014 E-tivity 3
EED406 2014 E-tivity 3
aayrton
 
Tqm new tools
Tqm new toolsTqm new tools
Tqm new tools
Arun Kumar
 
NEW SEVEN TOOLS OF QUALITY MANAGEMENT
NEW SEVEN TOOLS OF QUALITY MANAGEMENTNEW SEVEN TOOLS OF QUALITY MANAGEMENT
NEW SEVEN TOOLS OF QUALITY MANAGEMENT
ANNA UNIVERSITY
 
Tqm new tools
Tqm new toolsTqm new tools
Tqm new tools
ANNA UNIVERSITY
 
Graphic organizer as thinking technology
Graphic organizer as thinking technologyGraphic organizer as thinking technology
Graphic organizer as thinking technology
tech wuo
 
ENG10_WK 1_DIST 5_BOBIS-TAMPUS.pptx
ENG10_WK 1_DIST 5_BOBIS-TAMPUS.pptxENG10_WK 1_DIST 5_BOBIS-TAMPUS.pptx
ENG10_WK 1_DIST 5_BOBIS-TAMPUS.pptx
MARIEROSEDICHOS
 
7 New QC Tools.ppt
7 New QC Tools.ppt7 New QC Tools.ppt
7 New QC Tools.ppt
neeru.s
 
Webquest Descriptive Statistics of the NCAA
Webquest Descriptive Statistics of the NCAAWebquest Descriptive Statistics of the NCAA
Webquest Descriptive Statistics of the NCAA
srthomas
 
Descriptive Statistics in the NCAA
Descriptive Statistics in the NCAADescriptive Statistics in the NCAA
Descriptive Statistics in the NCAA
srkthomas
 
2webquest Srkthomas Statistics
2webquest Srkthomas Statistics2webquest Srkthomas Statistics
2webquest Srkthomas Statistics
srthomas
 
Team icon
Team iconTeam icon
Team icon
benchhood
 
@Quality management tools
@Quality management tools@Quality management tools
@Quality management tools
keshavrasal
 
Assignment InstructionsYouTube httpswww.youtube.comPCTECH.docx
Assignment InstructionsYouTube httpswww.youtube.comPCTECH.docxAssignment InstructionsYouTube httpswww.youtube.comPCTECH.docx
Assignment InstructionsYouTube httpswww.youtube.comPCTECH.docx
howard4little59962
 
New 7 Management Tools
New 7 Management ToolsNew 7 Management Tools
New 7 Management Tools
venkatasirish
 
Learning outcomes what why and how
Learning outcomes what why and howLearning outcomes what why and how
Learning outcomes what why and how
Shakir Al-Awqati
 
New Quality Tools in total quality management
New Quality Tools in total quality managementNew Quality Tools in total quality management
New Quality Tools in total quality management
Tamilselvan S
 
Teachcht
TeachchtTeachcht
Teachcht
Romane Forbes
 
Continuos improvement tools ii
Continuos improvement tools iiContinuos improvement tools ii
Continuos improvement tools ii
DEPROCESS
 
The Seven Management Tools - Total Quality Management
The Seven Management Tools - Total Quality ManagementThe Seven Management Tools - Total Quality Management
The Seven Management Tools - Total Quality Management
Snehal Nemane
 

Similar to Assessment tools (20)

02. Techniques-in-Selecting-and-Organizing-Information.pptx
02. Techniques-in-Selecting-and-Organizing-Information.pptx02. Techniques-in-Selecting-and-Organizing-Information.pptx
02. Techniques-in-Selecting-and-Organizing-Information.pptx
 
EED406 2014 E-tivity 3
EED406 2014 E-tivity 3EED406 2014 E-tivity 3
EED406 2014 E-tivity 3
 
Tqm new tools
Tqm new toolsTqm new tools
Tqm new tools
 
NEW SEVEN TOOLS OF QUALITY MANAGEMENT
NEW SEVEN TOOLS OF QUALITY MANAGEMENTNEW SEVEN TOOLS OF QUALITY MANAGEMENT
NEW SEVEN TOOLS OF QUALITY MANAGEMENT
 
Tqm new tools
Tqm new toolsTqm new tools
Tqm new tools
 
Graphic organizer as thinking technology
Graphic organizer as thinking technologyGraphic organizer as thinking technology
Graphic organizer as thinking technology
 
ENG10_WK 1_DIST 5_BOBIS-TAMPUS.pptx
ENG10_WK 1_DIST 5_BOBIS-TAMPUS.pptxENG10_WK 1_DIST 5_BOBIS-TAMPUS.pptx
ENG10_WK 1_DIST 5_BOBIS-TAMPUS.pptx
 
7 New QC Tools.ppt
7 New QC Tools.ppt7 New QC Tools.ppt
7 New QC Tools.ppt
 
Webquest Descriptive Statistics of the NCAA
Webquest Descriptive Statistics of the NCAAWebquest Descriptive Statistics of the NCAA
Webquest Descriptive Statistics of the NCAA
 
Descriptive Statistics in the NCAA
Descriptive Statistics in the NCAADescriptive Statistics in the NCAA
Descriptive Statistics in the NCAA
 
2webquest Srkthomas Statistics
2webquest Srkthomas Statistics2webquest Srkthomas Statistics
2webquest Srkthomas Statistics
 
Team icon
Team iconTeam icon
Team icon
 
@Quality management tools
@Quality management tools@Quality management tools
@Quality management tools
 
Assignment InstructionsYouTube httpswww.youtube.comPCTECH.docx
Assignment InstructionsYouTube httpswww.youtube.comPCTECH.docxAssignment InstructionsYouTube httpswww.youtube.comPCTECH.docx
Assignment InstructionsYouTube httpswww.youtube.comPCTECH.docx
 
New 7 Management Tools
New 7 Management ToolsNew 7 Management Tools
New 7 Management Tools
 
Learning outcomes what why and how
Learning outcomes what why and howLearning outcomes what why and how
Learning outcomes what why and how
 
New Quality Tools in total quality management
New Quality Tools in total quality managementNew Quality Tools in total quality management
New Quality Tools in total quality management
 
Teachcht
TeachchtTeachcht
Teachcht
 
Continuos improvement tools ii
Continuos improvement tools iiContinuos improvement tools ii
Continuos improvement tools ii
 
The Seven Management Tools - Total Quality Management
The Seven Management Tools - Total Quality ManagementThe Seven Management Tools - Total Quality Management
The Seven Management Tools - Total Quality Management
 

More from K G MALLIKARJAN

Polio - YOUTH AWARENESS PROGRAMME
Polio - YOUTH AWARENESS PROGRAMMEPolio - YOUTH AWARENESS PROGRAMME
Polio - YOUTH AWARENESS PROGRAMME
K G MALLIKARJAN
 
Hiv aids
Hiv aidsHiv aids
Hiv aids
K G MALLIKARJAN
 
Anode rays
Anode raysAnode rays
Anode rays
K G MALLIKARJAN
 
Adaptation in animals
Adaptation in animalsAdaptation in animals
Adaptation in animals
K G MALLIKARJAN
 
Cancer presentation1
Cancer presentation1Cancer presentation1
Cancer presentation1
K G MALLIKARJAN
 
Cancer presentation1
Cancer presentation1Cancer presentation1
Cancer presentation1
K G MALLIKARJAN
 
Elephantiasis presentation1
Elephantiasis presentation1Elephantiasis presentation1
Elephantiasis presentation1
K G MALLIKARJAN
 
Tuberosis presentation1
Tuberosis presentation1Tuberosis presentation1
Tuberosis presentation1
K G MALLIKARJAN
 
Leprosy presentation1
Leprosy presentation1Leprosy presentation1
Leprosy presentation1
K G MALLIKARJAN
 
ORGANIC CHEMISTRY REASONING QUESTIONS
ORGANIC CHEMISTRY REASONING QUESTIONSORGANIC CHEMISTRY REASONING QUESTIONS
ORGANIC CHEMISTRY REASONING QUESTIONS
K G MALLIKARJAN
 

More from K G MALLIKARJAN (10)

Polio - YOUTH AWARENESS PROGRAMME
Polio - YOUTH AWARENESS PROGRAMMEPolio - YOUTH AWARENESS PROGRAMME
Polio - YOUTH AWARENESS PROGRAMME
 
Hiv aids
Hiv aidsHiv aids
Hiv aids
 
Anode rays
Anode raysAnode rays
Anode rays
 
Adaptation in animals
Adaptation in animalsAdaptation in animals
Adaptation in animals
 
Cancer presentation1
Cancer presentation1Cancer presentation1
Cancer presentation1
 
Cancer presentation1
Cancer presentation1Cancer presentation1
Cancer presentation1
 
Elephantiasis presentation1
Elephantiasis presentation1Elephantiasis presentation1
Elephantiasis presentation1
 
Tuberosis presentation1
Tuberosis presentation1Tuberosis presentation1
Tuberosis presentation1
 
Leprosy presentation1
Leprosy presentation1Leprosy presentation1
Leprosy presentation1
 
ORGANIC CHEMISTRY REASONING QUESTIONS
ORGANIC CHEMISTRY REASONING QUESTIONSORGANIC CHEMISTRY REASONING QUESTIONS
ORGANIC CHEMISTRY REASONING QUESTIONS
 

Recently uploaded

PIMS Job Advertisement 2024.pdf Islamabad
PIMS Job Advertisement 2024.pdf IslamabadPIMS Job Advertisement 2024.pdf Islamabad
PIMS Job Advertisement 2024.pdf Islamabad
AyyanKhan40
 
clinical examination of hip joint (1).pdf
clinical examination of hip joint (1).pdfclinical examination of hip joint (1).pdf
clinical examination of hip joint (1).pdf
Priyankaranawat4
 
Introduction to AI for Nonprofits with Tapp Network
Introduction to AI for Nonprofits with Tapp NetworkIntroduction to AI for Nonprofits with Tapp Network
Introduction to AI for Nonprofits with Tapp Network
TechSoup
 
Main Java[All of the Base Concepts}.docx
Main Java[All of the Base Concepts}.docxMain Java[All of the Base Concepts}.docx
Main Java[All of the Base Concepts}.docx
adhitya5119
 
Liberal Approach to the Study of Indian Politics.pdf
Liberal Approach to the Study of Indian Politics.pdfLiberal Approach to the Study of Indian Politics.pdf
Liberal Approach to the Study of Indian Politics.pdf
WaniBasim
 
How to Fix the Import Error in the Odoo 17
How to Fix the Import Error in the Odoo 17How to Fix the Import Error in the Odoo 17
How to Fix the Import Error in the Odoo 17
Celine George
 
C1 Rubenstein AP HuG xxxxxxxxxxxxxx.pptx
C1 Rubenstein AP HuG xxxxxxxxxxxxxx.pptxC1 Rubenstein AP HuG xxxxxxxxxxxxxx.pptx
C1 Rubenstein AP HuG xxxxxxxxxxxxxx.pptx
mulvey2
 
World environment day ppt For 5 June 2024
World environment day ppt For 5 June 2024World environment day ppt For 5 June 2024
World environment day ppt For 5 June 2024
ak6969907
 
Executive Directors Chat Leveraging AI for Diversity, Equity, and Inclusion
Executive Directors Chat  Leveraging AI for Diversity, Equity, and InclusionExecutive Directors Chat  Leveraging AI for Diversity, Equity, and Inclusion
Executive Directors Chat Leveraging AI for Diversity, Equity, and Inclusion
TechSoup
 
A Survey of Techniques for Maximizing LLM Performance.pptx
A Survey of Techniques for Maximizing LLM Performance.pptxA Survey of Techniques for Maximizing LLM Performance.pptx
A Survey of Techniques for Maximizing LLM Performance.pptx
thanhdowork
 
ISO/IEC 27001, ISO/IEC 42001, and GDPR: Best Practices for Implementation and...
ISO/IEC 27001, ISO/IEC 42001, and GDPR: Best Practices for Implementation and...ISO/IEC 27001, ISO/IEC 42001, and GDPR: Best Practices for Implementation and...
ISO/IEC 27001, ISO/IEC 42001, and GDPR: Best Practices for Implementation and...
PECB
 
Digital Artifact 1 - 10VCD Environments Unit
Digital Artifact 1 - 10VCD Environments UnitDigital Artifact 1 - 10VCD Environments Unit
Digital Artifact 1 - 10VCD Environments Unit
chanes7
 
Smart-Money for SMC traders good time and ICT
Smart-Money for SMC traders good time and ICTSmart-Money for SMC traders good time and ICT
Smart-Money for SMC traders good time and ICT
simonomuemu
 
Types of Herbal Cosmetics its standardization.
Types of Herbal Cosmetics its standardization.Types of Herbal Cosmetics its standardization.
Types of Herbal Cosmetics its standardization.
Ashokrao Mane college of Pharmacy Peth-Vadgaon
 
The basics of sentences session 5pptx.pptx
The basics of sentences session 5pptx.pptxThe basics of sentences session 5pptx.pptx
The basics of sentences session 5pptx.pptx
heathfieldcps1
 
S1-Introduction-Biopesticides in ICM.pptx
S1-Introduction-Biopesticides in ICM.pptxS1-Introduction-Biopesticides in ICM.pptx
S1-Introduction-Biopesticides in ICM.pptx
tarandeep35
 
A Independência da América Espanhola LAPBOOK.pdf
A Independência da América Espanhola LAPBOOK.pdfA Independência da América Espanhola LAPBOOK.pdf
A Independência da América Espanhola LAPBOOK.pdf
Jean Carlos Nunes Paixão
 
Top five deadliest dog breeds in America
Top five deadliest dog breeds in AmericaTop five deadliest dog breeds in America
Top five deadliest dog breeds in America
Bisnar Chase Personal Injury Attorneys
 
RPMS TEMPLATE FOR SCHOOL YEAR 2023-2024 FOR TEACHER 1 TO TEACHER 3
RPMS TEMPLATE FOR SCHOOL YEAR 2023-2024 FOR TEACHER 1 TO TEACHER 3RPMS TEMPLATE FOR SCHOOL YEAR 2023-2024 FOR TEACHER 1 TO TEACHER 3
RPMS TEMPLATE FOR SCHOOL YEAR 2023-2024 FOR TEACHER 1 TO TEACHER 3
IreneSebastianRueco1
 
CACJapan - GROUP Presentation 1- Wk 4.pdf
CACJapan - GROUP Presentation 1- Wk 4.pdfCACJapan - GROUP Presentation 1- Wk 4.pdf
CACJapan - GROUP Presentation 1- Wk 4.pdf
camakaiclarkmusic
 

Recently uploaded (20)

PIMS Job Advertisement 2024.pdf Islamabad
PIMS Job Advertisement 2024.pdf IslamabadPIMS Job Advertisement 2024.pdf Islamabad
PIMS Job Advertisement 2024.pdf Islamabad
 
clinical examination of hip joint (1).pdf
clinical examination of hip joint (1).pdfclinical examination of hip joint (1).pdf
clinical examination of hip joint (1).pdf
 
Introduction to AI for Nonprofits with Tapp Network
Introduction to AI for Nonprofits with Tapp NetworkIntroduction to AI for Nonprofits with Tapp Network
Introduction to AI for Nonprofits with Tapp Network
 
Main Java[All of the Base Concepts}.docx
Main Java[All of the Base Concepts}.docxMain Java[All of the Base Concepts}.docx
Main Java[All of the Base Concepts}.docx
 
Liberal Approach to the Study of Indian Politics.pdf
Liberal Approach to the Study of Indian Politics.pdfLiberal Approach to the Study of Indian Politics.pdf
Liberal Approach to the Study of Indian Politics.pdf
 
How to Fix the Import Error in the Odoo 17
How to Fix the Import Error in the Odoo 17How to Fix the Import Error in the Odoo 17
How to Fix the Import Error in the Odoo 17
 
C1 Rubenstein AP HuG xxxxxxxxxxxxxx.pptx
C1 Rubenstein AP HuG xxxxxxxxxxxxxx.pptxC1 Rubenstein AP HuG xxxxxxxxxxxxxx.pptx
C1 Rubenstein AP HuG xxxxxxxxxxxxxx.pptx
 
World environment day ppt For 5 June 2024
World environment day ppt For 5 June 2024World environment day ppt For 5 June 2024
World environment day ppt For 5 June 2024
 
Executive Directors Chat Leveraging AI for Diversity, Equity, and Inclusion
Executive Directors Chat  Leveraging AI for Diversity, Equity, and InclusionExecutive Directors Chat  Leveraging AI for Diversity, Equity, and Inclusion
Executive Directors Chat Leveraging AI for Diversity, Equity, and Inclusion
 
A Survey of Techniques for Maximizing LLM Performance.pptx
A Survey of Techniques for Maximizing LLM Performance.pptxA Survey of Techniques for Maximizing LLM Performance.pptx
A Survey of Techniques for Maximizing LLM Performance.pptx
 
ISO/IEC 27001, ISO/IEC 42001, and GDPR: Best Practices for Implementation and...
ISO/IEC 27001, ISO/IEC 42001, and GDPR: Best Practices for Implementation and...ISO/IEC 27001, ISO/IEC 42001, and GDPR: Best Practices for Implementation and...
ISO/IEC 27001, ISO/IEC 42001, and GDPR: Best Practices for Implementation and...
 
Digital Artifact 1 - 10VCD Environments Unit
Digital Artifact 1 - 10VCD Environments UnitDigital Artifact 1 - 10VCD Environments Unit
Digital Artifact 1 - 10VCD Environments Unit
 
Smart-Money for SMC traders good time and ICT
Smart-Money for SMC traders good time and ICTSmart-Money for SMC traders good time and ICT
Smart-Money for SMC traders good time and ICT
 
Types of Herbal Cosmetics its standardization.
Types of Herbal Cosmetics its standardization.Types of Herbal Cosmetics its standardization.
Types of Herbal Cosmetics its standardization.
 
The basics of sentences session 5pptx.pptx
The basics of sentences session 5pptx.pptxThe basics of sentences session 5pptx.pptx
The basics of sentences session 5pptx.pptx
 
S1-Introduction-Biopesticides in ICM.pptx
S1-Introduction-Biopesticides in ICM.pptxS1-Introduction-Biopesticides in ICM.pptx
S1-Introduction-Biopesticides in ICM.pptx
 
A Independência da América Espanhola LAPBOOK.pdf
A Independência da América Espanhola LAPBOOK.pdfA Independência da América Espanhola LAPBOOK.pdf
A Independência da América Espanhola LAPBOOK.pdf
 
Top five deadliest dog breeds in America
Top five deadliest dog breeds in AmericaTop five deadliest dog breeds in America
Top five deadliest dog breeds in America
 
RPMS TEMPLATE FOR SCHOOL YEAR 2023-2024 FOR TEACHER 1 TO TEACHER 3
RPMS TEMPLATE FOR SCHOOL YEAR 2023-2024 FOR TEACHER 1 TO TEACHER 3RPMS TEMPLATE FOR SCHOOL YEAR 2023-2024 FOR TEACHER 1 TO TEACHER 3
RPMS TEMPLATE FOR SCHOOL YEAR 2023-2024 FOR TEACHER 1 TO TEACHER 3
 
CACJapan - GROUP Presentation 1- Wk 4.pdf
CACJapan - GROUP Presentation 1- Wk 4.pdfCACJapan - GROUP Presentation 1- Wk 4.pdf
CACJapan - GROUP Presentation 1- Wk 4.pdf
 

Assessment tools

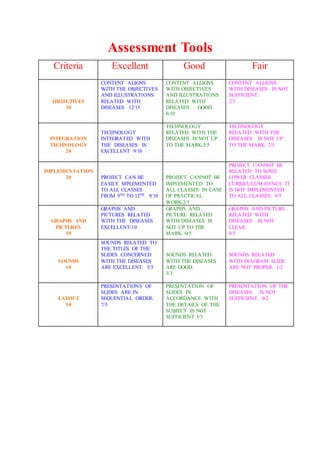
  • 1. Assessment Tools Criteria Excellent Good Fair OBJECTIVES 30 CONTENT ALIGNS WITH THE OBJECTIVES AND ILLUSTRATIONS RELATED WITH DISEASES 12/15 CONTENT ALLIGNS WITH OBJECTIVES AND ILLUSTRATIONS RELATED WITH DISEASES GOOD 6/10 CONTENT ALLIGNS WITH DISEASES IS NOT SUFFICIENT. 2/5 INTEGRATION TECHNOLOGY 20 TECHNOLOGY INTEGRATED WITH THE DISEASES IS EXCELLENT 9/10 TECHNOLOGY RELATED WITH THE DISEASES IS NOT UP TO THE MARK.3/5 TECHNOLOGY RELATED WITH THE DISEASES IS NOT UP TO THE MARK. 2/5 IMPLEMENTATION 20 PROJECT CAN BE EASILY MPLEMENTED TO ALL CLASSES FROM 9TH TO 12TH. 9/10 PROJECT CANNOT BE IMPLEMENTED TO ALL CLASSES IN CASE OF PRACTICAL WORK.2/5 PROJECT CANNOT BE RELATED TO SOME LOWER CLASSES CURRICULUM.HENCE IT IS NOT IMPLEMENTED TO ALL CLASSES. 0/5 GRAPHS AND PICTURES 10 GRAPHS AND PICTURES RELATED WITH THE DISEASES EXCELLENT/10 GRAPHS AND PICTURE RELATED WITH DISEASES IS NOT UP TO THE MARK. 0/5 GRAPHS AND PICTURE RELATED WITH DISEASES IS NOT CLEAR. 0/5 SOUNDS 10 SOUNDS RELATED TO THE TITLES OF THE SLIDES CONCERNED WITH THE DISEASES ARE EXCELLENT. 3/5 SOUNDS RELATED WITH THE DISEASES ARE GOOD. 3/3 SOUNDS RELATED WITH DIAGRAM SLIDE ARE NOT PROPER. 1/2 LAYOUT 10 PRESENTATIONS OF SLIDES ARE IN SEQUENTIAL ORDER. 7/5 PRESENTATION OF SLIDES IN ACCORDANCE WITH THE DETAILS OF THE SUBJECT IS NOT SUFFICIENT.3/3 PRESENTATION OF THE DISEASES IS NOT SUFFICIENT. 0/2
  • 2. These tools are for immediate use with students in the classroom. They are suitable for use in many different contexts and are aimed at improving assessment practices. A range of schools across Victoria have used some of these tools and their feedback and suggestions for use are included. The tools are grouped under the following headings: Graphic organisers - tools to visually represent thoughts, ideas, knowledge and concepts. They help to organise thoughts and to promote understanding. This section contains sample graphic organisers and some examples of how they were successfully used by schools for various purposes. Star Spider Fishbone Cloud Tree Chain Continu um Cycle Clocks Flowch art Venn Chart/M atrix Pie Chart/ Circle Graph T-Chart Y- Chart PMI KWHL Semant ic Feature Analysi s Cause and Effect Compa re and Contras t Decision Making Fact/Opi nion Vocabular y Paragr aph Persuas ion Main/Supp oring Ideas 5 W's Newspa per Charac ter Traits Story Map/ Book Report Non- Fiction Book Report Brainstor ming Charts Plants Animal Report Geography Report Native Americ ans Biograp hy Astrono my Report Math Scientific Method Reading Logs Wheels
  • 3. Review and reflection tools - enable students to review and reflect on their knowledge, progress, and what they have learnt and achieved during a unit, topic or project. Some tools are specifically designed for early years students. Feedback tools - enable students to provide feedback on their work and performance. It also includes strategies for teachers to increase the wait time when asking questions in class. Rubrics - printed sets of criteria for assessing knowledge, performance or product and for giving feedback. The following tools are examples of rubrics and how they are used in schools. Tools for planning and auditing assessment practices The following tools can be used by teachers and school leadership teams when planning and auditing their assessment practices: Familiarisation and discussion tools - help develop a common understanding of assessment in a school and are designed to familiarise teachers with formative assessment and the purpose of assessment for learning, as learning and of learning. Audit tool (PDF - 39Kb) - supports discussion on current assessment approaches in schools and audit these against the Victorian Essential Learning Standards (VELS). Graphic Organizers Graphic organizers (some of which are also called concept maps, entity relationship charts, and mind maps) are a pictorial way of constructing knowledge and organizing information. They help the student convert and compress a lot of seemingly disjointed information into a structured, simple-to-read, graphic display. The resulting visual display conveys complex information in a simple-to-understand manner. Increasing Understanding by Creating Graphic Organizers: The process of converting a mass of data/information/ideas into a graphic map gives the student an increased understanding and insight into the topic at hand. To create the map, the student must concentrate on the relationships between the items and examine the meanings attached to each of them. While creating a map, the student must also prioritize the information, determining which parts of the material are the most important and should be focused upon, and where each item should be placed in the map.
  • 4. The creation of graphic organizers also helps the student generate ideas as they develop and note their thoughts visually. The possibilities associated with a topic become clearer as the student's ideas are classified visually. Uses of Graphic Organizers: Graphic organizers can be used to structure writing projects, to help in problem solving, decision making, studying, planning research and brainstorming. Creating Graphic Organizers: Graphic organizers can be drawn free-hand or printed. To go to printouts of many graphic organizers, click on one of the links above or below. Adding color-coding and/or pictures to a graphic organizer further increases the utility and readability of the visual display. How to Choose a Graphic Organizer for Your Topic/Task (click on a graphic organizer below to go to printable worksheets): The task at hand determines the type of graphic organizer that is appropriate. The following is a list of common graphic organizers - choose the format that best fits your topic. Star: If the topic involves investigating attributes associated with a single topic, use a star diagram as your graphic organizer. Example: Finding methods that help your study skills (like taking notes, reading, doing homework, memorizing, etc.). Spider: If the topic involves investigating attributes associated with a single topic, and then obtaining more details on each of these ideas, use a spider diagram as your graphic organizer. This is like the star graphic organizer with one more level of detail. Example: Finding methods that help your study skills (like taking notes, reading, memorizing, etc.), and investigating the factors involved in performing each of the methods. Fishbone: If the topic involves investigating multiple cause-and-effect factors associated with a complex topic and how they inter-relate, use a fishbone diagram as your graphic organizer. Example: Examining the effects of improved farming methods. Cloud/Cluster: If the topic involves generating a web of ideas based on a stimulus topic, use a clustering diagram as your graphic organizer.
  • 5. Example: brainstorming. Tree: If the topic involves a chain of events with a beginning and with multiple outcomes at each node (like a family tree), use a tree as your graphic organizer. Example: Displaying the probabilistic results of tossing coins. Chain of Events: If the topic involves a linear chain of events, with a definite beginning, middle, and end, use a chain of events graphic organizer. Example: Analyzing the plot of a story. Continuum/Timeline: If the topic has definite beginning and ending points, and a number of divisions or sequences in between, use a continuum/timeline. Example: Displaying milestones in a person's life. Clock: If the topic involves a clock-like cycle, use a clock graphic organizer. Example topic: Recording the events in a typical school day or making a story clock to summarize a story. Cycle of Events: If the topic involves a recurring cycle of events, with no beginning and no end, use a cyclic graphic organizer. Example topic: Documenting the stages in the lifecycle of an animal. Flowchart: If the topic involves a chain of instructions to follow, with a beginning and multiple possible outcomes at some node, with rules at some nodes, use a flowchart. Example: Computer programmers sometimes use flowcharts to organize the algorithm before writing a program. Venn Diagram: If the task involves examining the similarities and differences between two or three items, use a Venn diagram. Example: Examining the similarities and differences between fish and whales, or comparing a book and the accompanying movie. Chart/Matrix Diagram: If the task involves condensing and organizing data about traits of many items, use a chart/matrix. Example: Creating a display of key inventions, who invented them, when, where and why they were invented, etc. Y-Chart Diagram: If the task involves analyzing and organizing with respect to three qualities, use a Y-Chart. Example: Fill out a Y-Chart to describe what you know about an animal, including what it looks like, what it sounds like, and what it feels like. Or describe a character in a book, including what the charater looks like, sounds like, and how the charater feels. T-Chart Diagram: If the task involves analyzing or comparing with two
  • 6. aspects of the topic, use a T-Chart. Example: Fill out a T-Chart to evaluate the pros and cons associated with a decision. Fact/Opinion: If the task involves distinguishing the facts vs. the opinions in a theme or text, use fact/opinion charts. Example: Fill out a fact/opinion chart to evaluate the facts and opinions presented in a news article. PMI Diagram: If the task involves analyzing the plusses, minuses, and implicatios of a decision or an action, use a PMI Chart. Example: Fill out a PMI Chart to help evaluate the positive, negative and interesting points associated with taking a new job. Decision Making Diagrams: If the task is making a decision, use a graphic organizer to enumerate possible alternatives and the pros and cons of each. Example: Fill out a desicion making diagram to help decide which elective courses you'd like to take next quarter. Semantic Feature Analysis Charts: If the task is comparing characteristics among a group of items, use Semantic Feature Analysis . Example: Fill out a Semantic Feature Analysis chart to compare and contrast the care needed for various pets. Cause and Effect Diagrams: If the task is examining possible causes and effects in a process, use a cause and effect graphic organizer . Example: Fill out a cause-and-effect diagram to trace the steps in a feedback loop.. KWHL Diagram: If the task involves analyzing and organizing what you know and what you want to learn about a topic, use a KWHL chart. K stands for what you already KNOW about the subject. W stands for what you WANT to learn. H stands for figuring out HOW you can learn more about the topic. L stands for what you LEARN as you read. Example: Fill out a KWHL chart before, during, and after you read about a topic. Pie Charts: If the task involves showing divisions with a group, use a pie chart. Example: Draw a pie chart to show what percentages of a population have blue eyes, green eyes, or brown eyes. Vocabulary Map: Graphic organizers can be useful in helping a student learn new vocabulary words, having them list the word, its part of speech
  • 7. (noun, verb, adjective, adverb, etc.), a synonym, an antonym, a drawing that represents the word, and a sentence using the word. Paragraph Structure: These graphic organizers help you organize the structure of a paragraph, including a topic sentence, sentences with support details, and a conclusion sentence. 5 W's Diagram: If the task involves analyzing the Five W's (Who, When, Where, What, and Why) of a story or event. Example: Fill out a 5 W's Chart to help evaluate and understand the major points of a newspaper story. Story Map: Story maps can help a student summarize, analyze and understand a story or event. Character Traits: Graphic organizers help the student identify the traits of fictional characters by looking at events surrounding the character in the text. Biography Diagrams Graphic organizers are useful to help prepare for writing a biography. Before writing, the graphic organizer prompts the student to think about and list the major events in the person's life. Animal Report Diagrams: Many graphic organizers are useful to help prepare for writing a report on animals. Before writing, the student should think about and list the major topics that will be researched and covered in the report. Geography Report Diagrams: These graphic organizers are useful to for doings a short report on a country or other area. The student draws a map and flag, and looks up basic information on the area. Math Diagrams: Many graphic organizers are useful to learn and do math, include Venn diagrams, star diagrams, charts, flowcharts, trees, etc. Scientific Method Diagrams: Graphic organizers used to prepare and organize a scientific experiment.