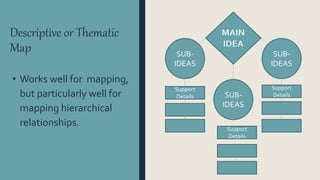
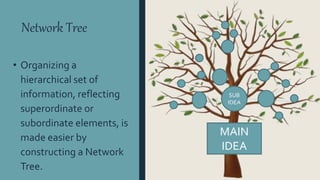
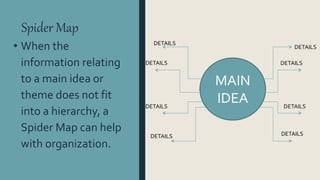
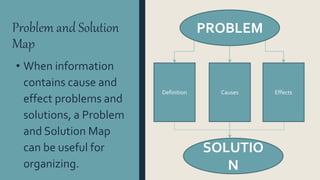
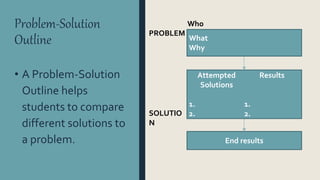
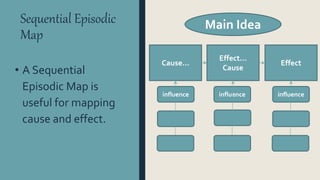
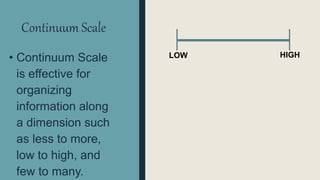
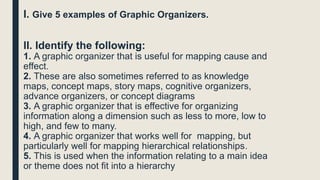
GRAPHIC
ORGANIZER
Karylle Mary Mae Gapate and
Kevin Roi Guray
GRAPHIC ORGANIZER
• A graphic organizer is a visual and graphic display that
depicts the relationships between facts, terms, and or
ideas within a learning task. Graphic organizers are
also sometimes referred to as knowledge maps,
concept maps, story maps, cognitive organizers,
advance organizers, or concept diagrams.
Types of Graphic Organizers
Descriptive or Thematic
Map
• Works well for mapping,
but particularly well for
mapping hierarchical
relationships.
SUB-
IDEAS
SUB-
IDEAS
SUB-
IDEAS
Support
Details
Support
Details
Support
Details
Network Tree
• Organizing a
hierarchical set of
information, reflecting
superordinate or
subordinate elements, is
made easier by
constructing a Network
Tree.
MAIN
IDEA
SUB
IDEA
Spider Map
• When the
information relating
to a main idea or
theme does not fit
into a hierarchy, a
Spider Map can help
with organization.
MAIN
IDEA
DETAILS
DETAILS
DETAILS
DETAILS
DETAILS
DETAILS
DETAILS
DETAILS
Problem and Solution
Map
• When information
contains cause and
effect problems and
solutions, a Problem
and Solution Map
can be useful for
organizing.
PROBLEM
SOLUTIO
N
Definition EffectsCauses
Problem-Solution
Outline
• A Problem-Solution
Outline helps
students to compare
different solutions to
a problem.
What
Why
Attempted
Solutions
1.
2.
Results
1.
2.
End results
PROBLEM
SOLUTIO
N
Who
Sequential Episodic
Map
• A Sequential
Episodic Map is
useful for mapping
cause and effect.
Main Idea
Cause… Effect
Effect…
Cause
influence influence influence
Fishbone Map
• When cause-effect
relationships are
complex and non-
redundant a
Fishbone Map may
be particularly
useful.
RESUL
T
Details
Details Details
Details
Comparative and
Contrastive Map
• A Comparative and
Contrastive Map can
help students to
compare and contrast
two concepts
according to their
features.
Concept 1 Concept 2
Diff. FeatureDiff. Feature
Sim. Feature
Dimen
tion 1
Dimen
tion 3
Dimen
tion 2
Compare-Contrast
Matrix
• Another way to
compare
concepts’
attributes.
Attribute 1
Attribute 2
Attribute 3
NAME 1 NAME 2
Continuum Scale
• Continuum Scale
is effective for
organizing
information along
a dimension such
as less to more,
low to high, and
few to many.
LOW HIGH
Exercise
I. Give 5 examples of Graphic Organizers.
II. Identify the following:
1. A graphic organizer that is useful for mapping cause and
effect.
2. These are also sometimes referred to as knowledge
maps, concept maps, story maps, cognitive organizers,
advance organizers, or concept diagrams
3. A graphic organizer that is effective for organizing
information along a dimension such as less to more, low to
high, and few to many.
4. A graphic organizer that works well for mapping, but
particularly well for mapping hierarchical relationships.
5. This is used when the information relating to a main idea
or theme does not fit into a hierarchy

Graphic organizer

  • 1.
    GRAPHIC ORGANIZER Karylle Mary MaeGapate and Kevin Roi Guray
  • 2.
    GRAPHIC ORGANIZER • Agraphic organizer is a visual and graphic display that depicts the relationships between facts, terms, and or ideas within a learning task. Graphic organizers are also sometimes referred to as knowledge maps, concept maps, story maps, cognitive organizers, advance organizers, or concept diagrams.
  • 3.
    Types of GraphicOrganizers
  • 4.
    Descriptive or Thematic Map •Works well for mapping, but particularly well for mapping hierarchical relationships. SUB- IDEAS SUB- IDEAS SUB- IDEAS Support Details Support Details Support Details
  • 5.
    Network Tree • Organizinga hierarchical set of information, reflecting superordinate or subordinate elements, is made easier by constructing a Network Tree. MAIN IDEA SUB IDEA
  • 6.
    Spider Map • Whenthe information relating to a main idea or theme does not fit into a hierarchy, a Spider Map can help with organization. MAIN IDEA DETAILS DETAILS DETAILS DETAILS DETAILS DETAILS DETAILS DETAILS
  • 7.
    Problem and Solution Map •When information contains cause and effect problems and solutions, a Problem and Solution Map can be useful for organizing. PROBLEM SOLUTIO N Definition EffectsCauses
  • 8.
    Problem-Solution Outline • A Problem-Solution Outlinehelps students to compare different solutions to a problem. What Why Attempted Solutions 1. 2. Results 1. 2. End results PROBLEM SOLUTIO N Who
  • 9.
    Sequential Episodic Map • ASequential Episodic Map is useful for mapping cause and effect. Main Idea Cause… Effect Effect… Cause influence influence influence
  • 10.
    Fishbone Map • Whencause-effect relationships are complex and non- redundant a Fishbone Map may be particularly useful. RESUL T Details Details Details Details
  • 11.
    Comparative and Contrastive Map •A Comparative and Contrastive Map can help students to compare and contrast two concepts according to their features. Concept 1 Concept 2 Diff. FeatureDiff. Feature Sim. Feature Dimen tion 1 Dimen tion 3 Dimen tion 2
  • 12.
    Compare-Contrast Matrix • Another wayto compare concepts’ attributes. Attribute 1 Attribute 2 Attribute 3 NAME 1 NAME 2
  • 13.
    Continuum Scale • ContinuumScale is effective for organizing information along a dimension such as less to more, low to high, and few to many. LOW HIGH
  • 14.
  • 15.
    I. Give 5examples of Graphic Organizers. II. Identify the following: 1. A graphic organizer that is useful for mapping cause and effect. 2. These are also sometimes referred to as knowledge maps, concept maps, story maps, cognitive organizers, advance organizers, or concept diagrams 3. A graphic organizer that is effective for organizing information along a dimension such as less to more, low to high, and few to many. 4. A graphic organizer that works well for mapping, but particularly well for mapping hierarchical relationships. 5. This is used when the information relating to a main idea or theme does not fit into a hierarchy