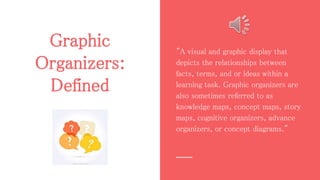
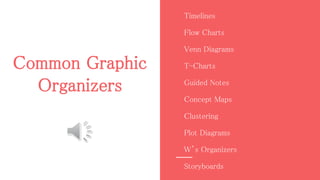
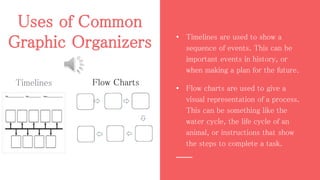
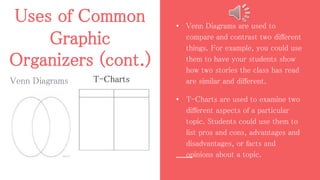
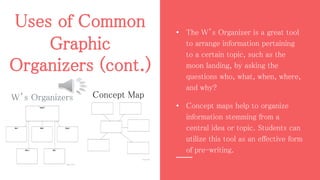
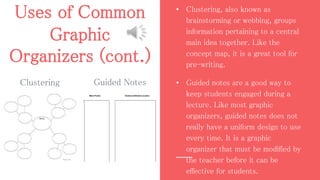
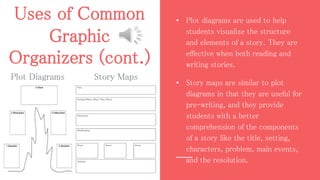
This document defines graphic organizers as visual displays that depict relationships between facts, terms, and ideas. It provides examples of common graphic organizers like timelines, flow charts, and Venn diagrams. Each type is described, including how timelines can show a sequence of events and flow charts depict processes. The document outlines benefits like how graphic organizers make information easier to understand and remember. It recommends their use for all learners and subjects. Teachers are advised to model their use and match organizers to concepts.