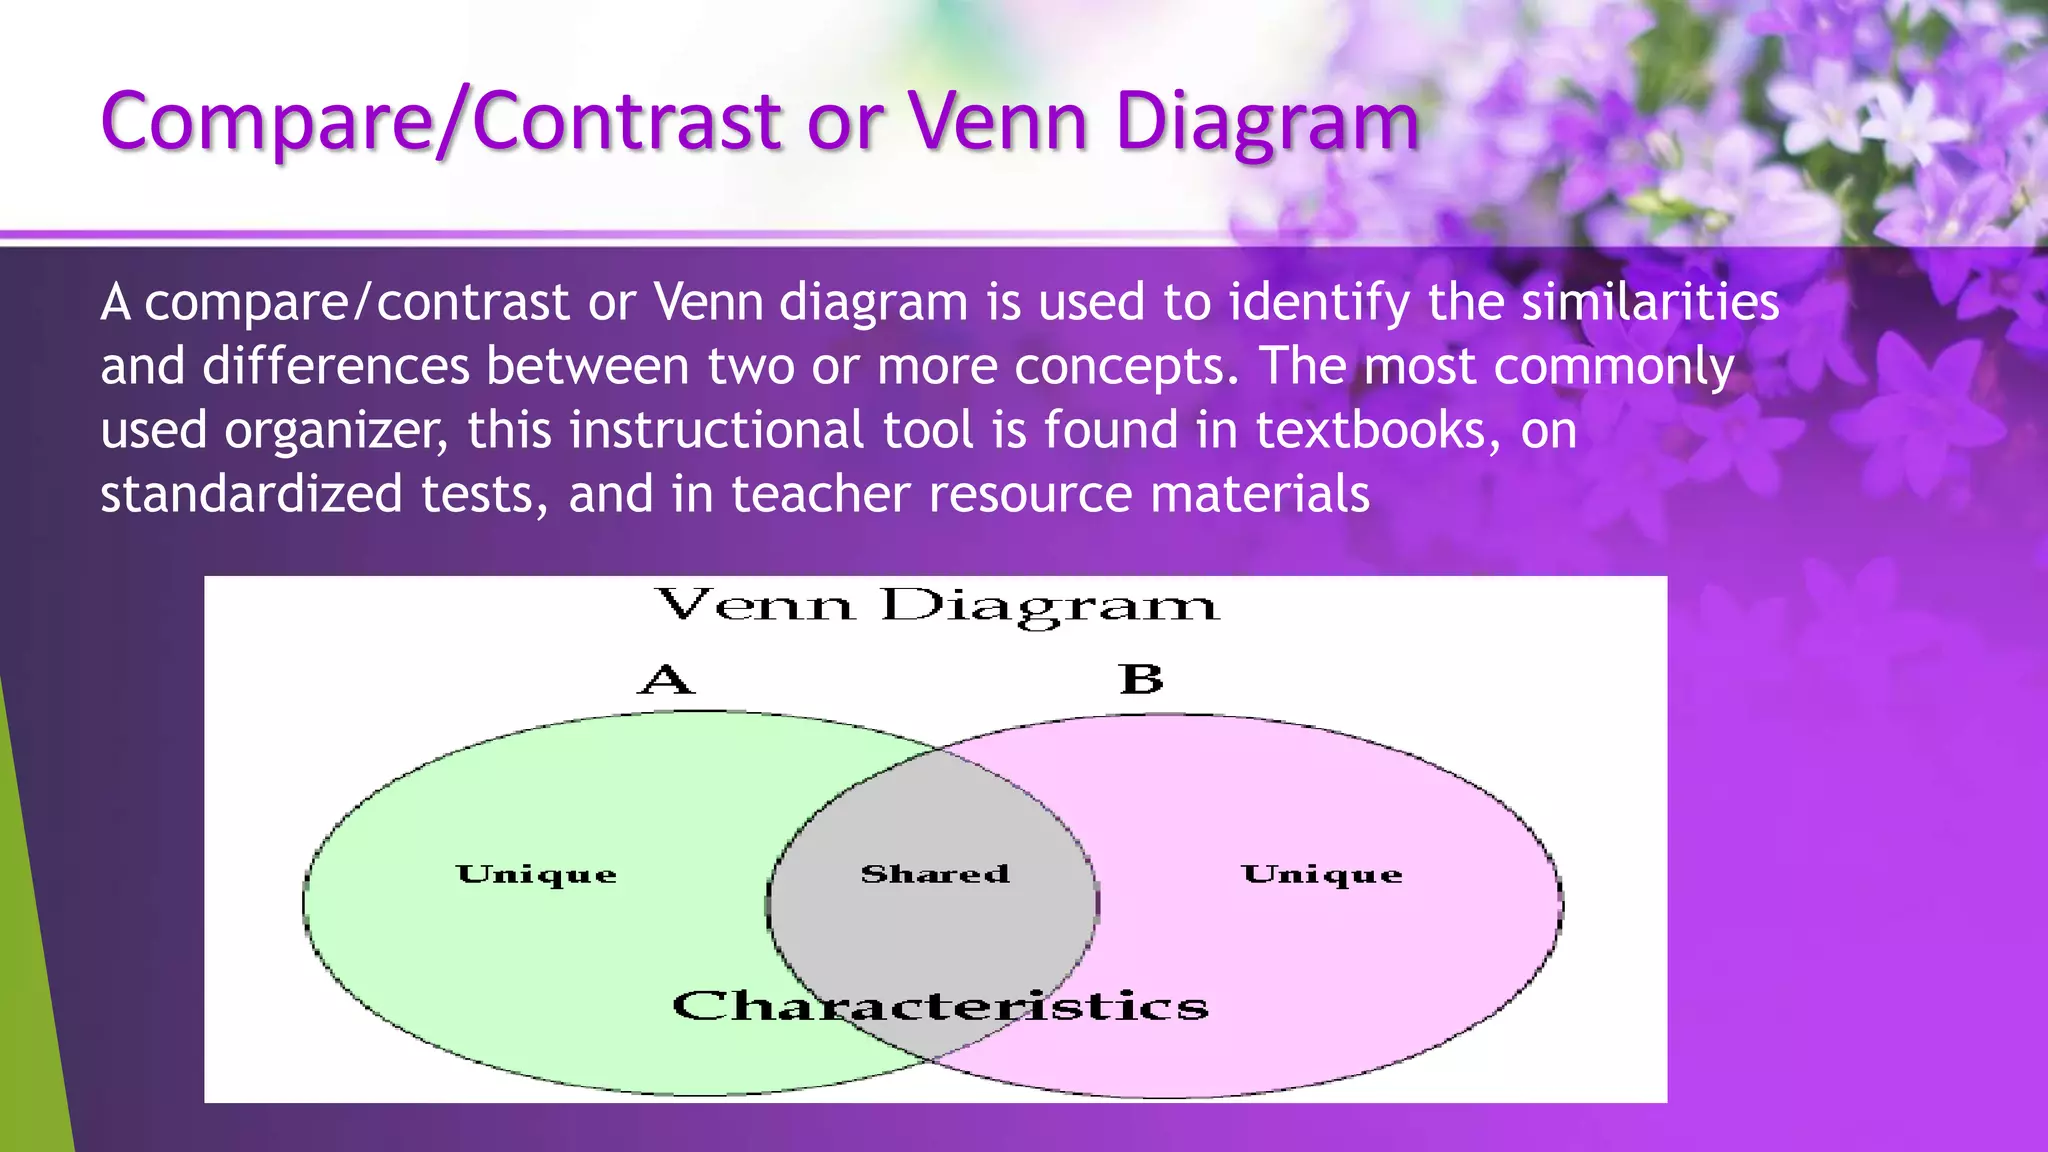
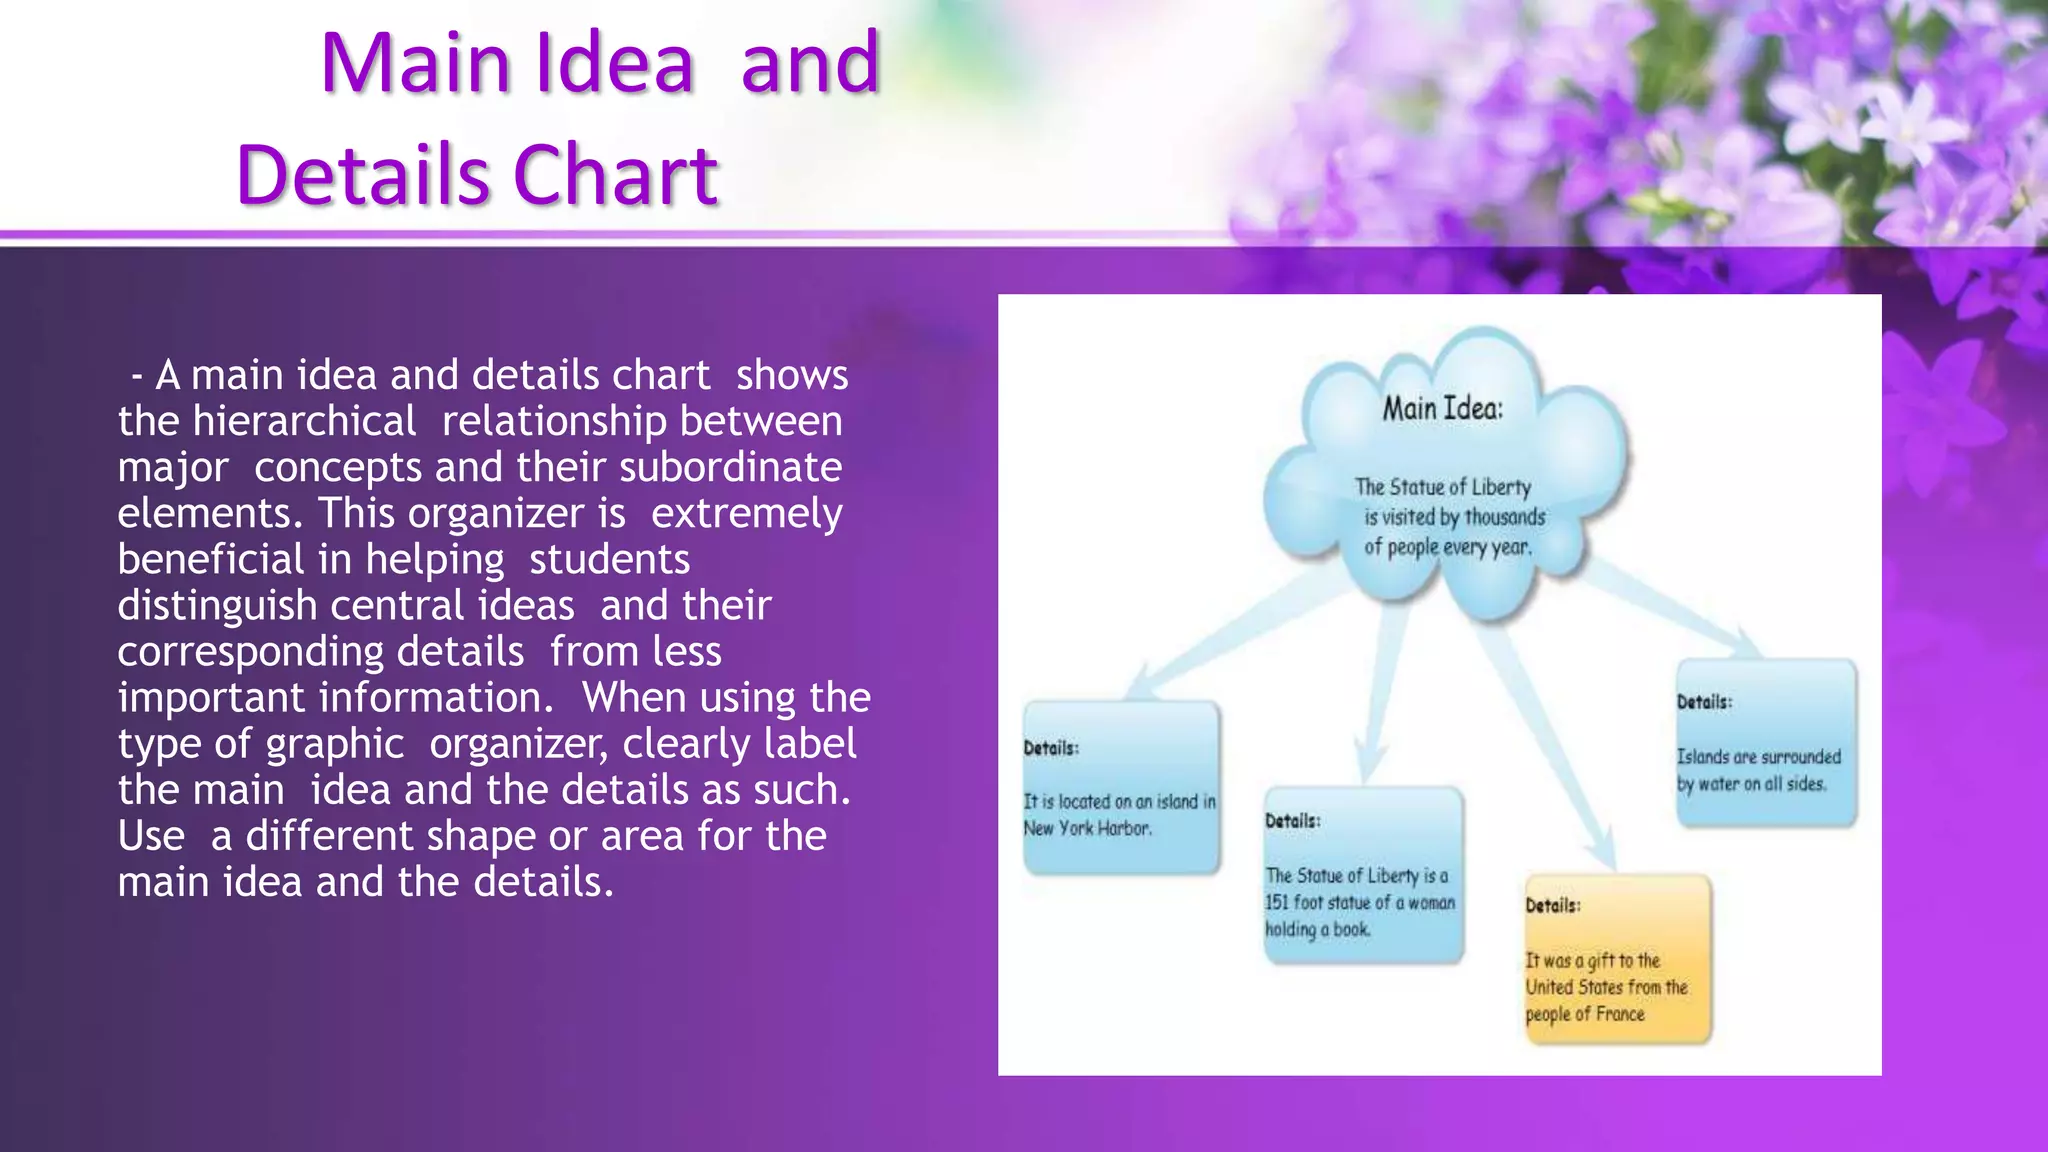
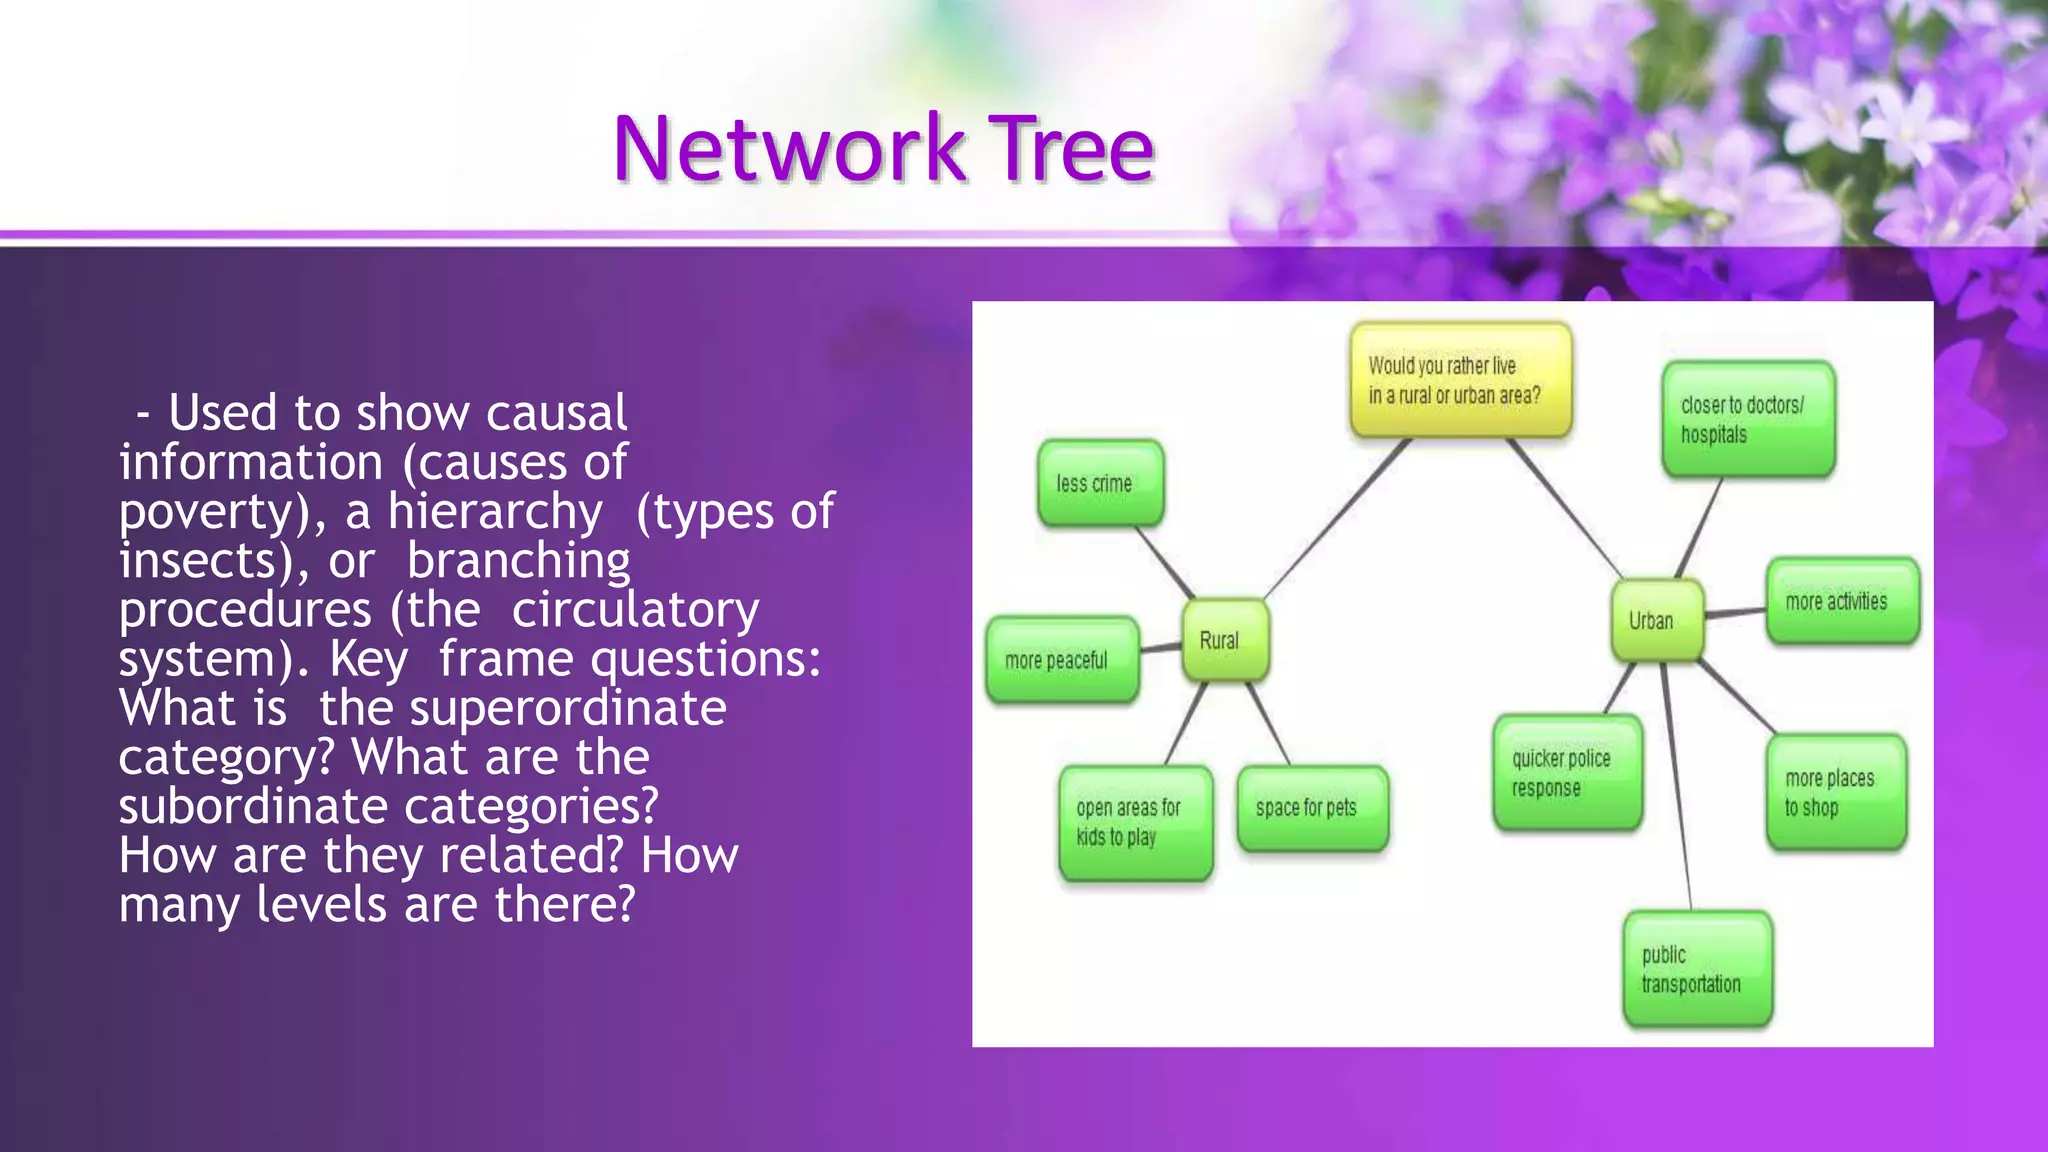
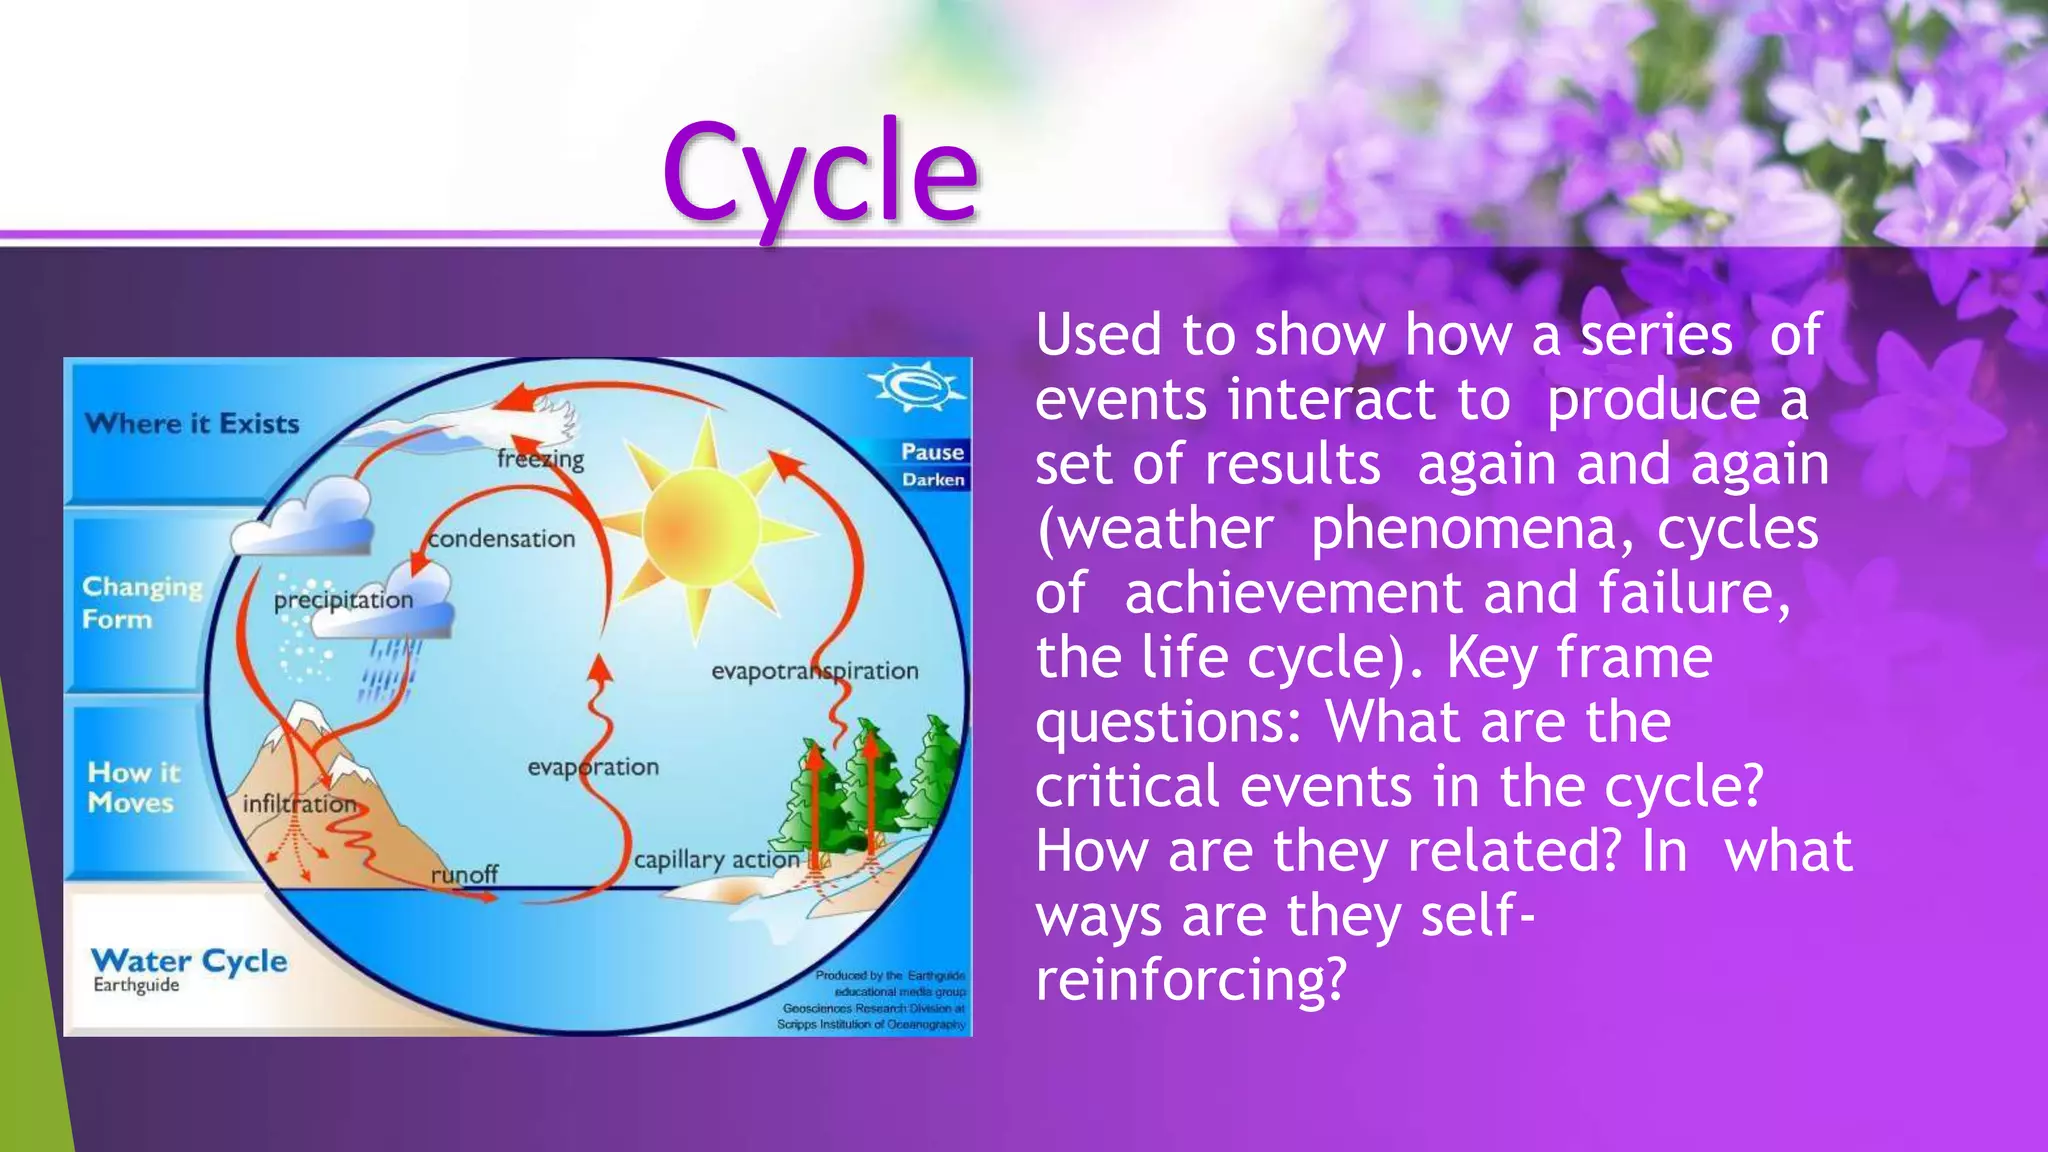
GRAPHIC ORGANIZERS
TYPES OF GRAPHIC ORGANIZERS
GRAPHIC ORGANIZERS
A powerful visual picture of information
that allows the mind to see undiscovered
patterns and relationships.
A tool that allows organization of these
patterns and relationships in writing.
Using graphic organizers
• Graphic organizers enable the writer to
organize material logically and to see
relationships between and among ideas.
• Effective use of graphic organizers can
help the writer to present his or her ideas
in an effective and persuasive manner,
resulting in a focused and coherent text.
Types of Graphic Organizers
• Graphic organizers come in many different forms,
each one best suited to organizing a particular
type of information.
• The following examples are merely a sampling of
the different types and uses of graphic
organizers.
Concept Map
A concept map is a general organizer that shows a central idea with its
corresponding characteristics. Concept maps can take many different
shapes and can be used to show any type of relationship that can be
labeled.
Flow Diagram or
Sequence Chart
A flow diagram or sequence
chart shows a series of steps
or events in the order in
which they take place. Any
concept that has a distinct
order can be displayed in
this type of organizer. It is
an excellent tool for
teaching students the steps
necessary to reach a final
point.
Compare/Contrast or Venn Diagram
A compare/contrast or Venn diagram is used to identify the similarities
and differences between two or more concepts. The most commonly
used organizer, this instructional tool is found in textbooks, on
standardized tests, and in teacher resource materials
Cause-and-Effect Diagram
A cause-and-effect diagram highlights the direct relationship
between different events or concepts. This tool is one of the
most beneficial organizers because of its many applications in
all subject areas.
Main Idea and
Details Chart
- A main idea and details chart shows
the hierarchical relationship between
major concepts and their subordinate
elements. This organizer is extremely
beneficial in helping students
distinguish central ideas and their
corresponding details from less
important information. When using the
type of graphic organizer, clearly label
the main idea and the details as such.
Use a different shape or area for the
main idea and the details.
Network Tree
- Used to show causal
information (causes of
poverty), a hierarchy (types of
insects), or branching
procedures (the circulatory
system). Key frame questions:
What is the superordinate
category? What are the
subordinate categories?
How are they related? How
many levels are there?
Cycle
Used to show how a series of
events interact to produce a
set of results again and again
(weather phenomena, cycles
of achievement and failure,
the life cycle). Key frame
questions: What are the
critical events in the cycle?
How are they related? In what
ways are they self-
reinforcing?
Pie Chart
- Pie chart diagrams (also called circle
graphs) are a type
of graphic organizer that are
useful for displaying information
about the percentages or parts
of a whole.
Imagine you just did a survey
of your friends to find which
kind of movie they liked best.

GRAPHIC ORGANIZER.pptx

  • 1.
    GRAPHIC ORGANIZERS TYPES OFGRAPHIC ORGANIZERS
  • 2.
    GRAPHIC ORGANIZERS A powerfulvisual picture of information that allows the mind to see undiscovered patterns and relationships. A tool that allows organization of these patterns and relationships in writing.
  • 3.
    Using graphic organizers •Graphic organizers enable the writer to organize material logically and to see relationships between and among ideas. • Effective use of graphic organizers can help the writer to present his or her ideas in an effective and persuasive manner, resulting in a focused and coherent text.
  • 4.
    Types of GraphicOrganizers • Graphic organizers come in many different forms, each one best suited to organizing a particular type of information. • The following examples are merely a sampling of the different types and uses of graphic organizers.
  • 5.
    Concept Map A conceptmap is a general organizer that shows a central idea with its corresponding characteristics. Concept maps can take many different shapes and can be used to show any type of relationship that can be labeled.
  • 6.
    Flow Diagram or SequenceChart A flow diagram or sequence chart shows a series of steps or events in the order in which they take place. Any concept that has a distinct order can be displayed in this type of organizer. It is an excellent tool for teaching students the steps necessary to reach a final point.
  • 7.
    Compare/Contrast or VennDiagram A compare/contrast or Venn diagram is used to identify the similarities and differences between two or more concepts. The most commonly used organizer, this instructional tool is found in textbooks, on standardized tests, and in teacher resource materials
  • 8.
    Cause-and-Effect Diagram A cause-and-effectdiagram highlights the direct relationship between different events or concepts. This tool is one of the most beneficial organizers because of its many applications in all subject areas.
  • 9.
    Main Idea and DetailsChart - A main idea and details chart shows the hierarchical relationship between major concepts and their subordinate elements. This organizer is extremely beneficial in helping students distinguish central ideas and their corresponding details from less important information. When using the type of graphic organizer, clearly label the main idea and the details as such. Use a different shape or area for the main idea and the details.
  • 10.
    Network Tree - Usedto show causal information (causes of poverty), a hierarchy (types of insects), or branching procedures (the circulatory system). Key frame questions: What is the superordinate category? What are the subordinate categories? How are they related? How many levels are there?
  • 11.
    Cycle Used to showhow a series of events interact to produce a set of results again and again (weather phenomena, cycles of achievement and failure, the life cycle). Key frame questions: What are the critical events in the cycle? How are they related? In what ways are they self- reinforcing?
  • 12.
    Pie Chart - Piechart diagrams (also called circle graphs) are a type of graphic organizer that are useful for displaying information about the percentages or parts of a whole. Imagine you just did a survey of your friends to find which kind of movie they liked best.