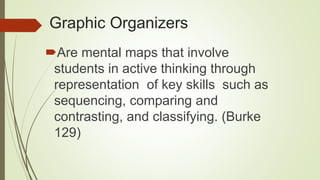
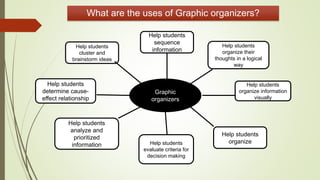
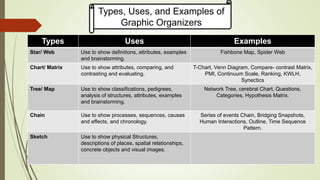
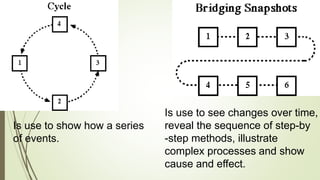
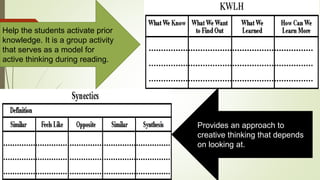
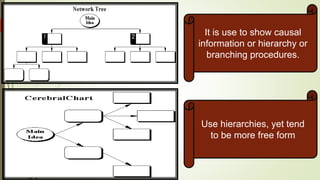
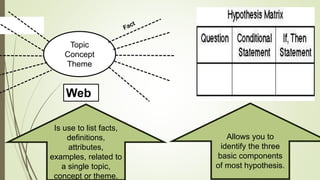
Graphic Organizers as Thinking
Technology
By: Geneve Loraine D. Cruz
BSEd III- B
Why Graphic Organizers?
What do effective educators had to learn to enhance students
understanding and retention of lessons taken in class?
Learning to think is an essential skill needed in education today.
Often educators use teaching methods where students are passive
learners. Difficulty arises when students must make meaning out
information taken from a book, video , or a lecture. When students
interact with content, it is important that they actively construct
meaning.
Graphic Organizers
Are mental maps that involve
students in active thinking through
representation of key skills such as
sequencing, comparing and
contrasting, and classifying. (Burke
129)
What are the uses of Graphic organizers?
Graphic
organizers
Help students
sequence
information
Help students
organize their
thoughts in a logical
way
Help students
cluster and
brainstorm ideas
Help students
determine cause-
effect relationship
Help students
organize information
visually
Help students
organize
Help students
analyze and
prioritized
information Help students
evaluate criteria for
decision making
Types Uses Examples
Star/ Web Use to show definitions, attributes, examples
and brainstorming.
Fishbone Map, Spider Web
Chart/ Matrix Use to show attributes, comparing, and
contrasting and evaluating.
T-Chart, Venn Diagram, Compare- contrast Matrix,
PMI, Continuum Scale, Ranking, KWLH,
Synectics
Tree/ Map Use to show classifications, pedigrees,
analysis of structures, attributes, examples
and brainstorming.
Network Tree, cerebral Chart, Questions,
Categories, Hypothesis Matrix.
Chain Use to show processes, sequences, causes
and effects, and chronology.
Series of events Chain, Bridging Snapshots,
Human Interactions, Outline, Time Sequence
Pattern.
Sketch Use to show physical Structures,
descriptions of places, spatial relationships,
concrete objects and visual images.
Types, Uses, and Examples of
Graphic Organizers
And Graphic organizers take on
many different looks……
RESULT
Detail
Detail
FISHBONE MAP
It is use to show the interaction
of a complex event or complex
phenomenon.
Topic
Concept
Theme
Detail
SPIDER MAP
Is used to describe a central idea: a thing,
process, concept or proposition.
Sounds
Like
Looks Like
T- chart
It is used to analyze
similarities and
differences between
two things(people,
places, events, ideas,
etc.
Venn Diagram
It is used to analyze similarities
and differences between two
things(people, places, events,
ideas, etc. By placing individual
characteristics in either the
left or right sections, and similar
Common characteristics within
the overlapping section.
Attitude 1
Attitude 2
Attitude 3
Name 1 Name 2
Compare- Contrast Matrix
It is used to analyze
similarities and
differences between
two things.
Key frame questions:
What are being
compared?
How are they similar?
How are they different?
P+
M-
I?
PMI
It is use to show positive, negative, and interesting
attributes of a subject, concept, topic, solution, etc. ,
in order to determine the nature of the outcome and
whether it will be worth continuing or not.
LOW HIGH
Continuum Scale
1
2
3
Ranking
Is use for time lines
showing historical events
or ages etc.
Is use when prioritizing elements
From most important to least
Important; relative position or
standing, a series of things or
persons; or an orderly
arrangement.
Is use to show how a series
of events.
Is use to see changes over time,
reveal the sequence of step-by
-step methods, illustrate
complex processes and show
cause and effect.
Help the students activate prior
knowledge. It is a group activity
that serves as a model for
active thinking during reading.
Provides an approach to
creative thinking that depends
on looking at.
It is use to show causal
information or hierarchy or
branching procedures.
Use hierarchies, yet tend
to be more free form
Topic
Concept
Theme
Web
Is use to list facts,
definitions,
attributes,
examples, related to
a single topic,
concept or theme.
Allows you to
identify the three
basic components
of most hypothesis.
Good? Bad?
1
2
3
1
2
3
Questions
Hypothesizing is used to list a set of
questions.
Hypothesize Graphic Organizer
1 2 3 4
Categories
Hypothesize Graphic Organizer
Problem/Solution Outline
Graphical Organizers convert complex and messy information
collections into meaningful displays.
 They compress.
 They focus.
 They make interpretation, understanding and insight much easier.
Graphical Organizers help keep students plan their research
forays.
 They guide the gathering.
 They focus purpose.
 They show what is gained.
 They show what is still missing.
Graphical Organizers sometimes act like mind maps.
 They point to the destination.
 They identify related sites and sights.
• It targets the HOTS or the
Higher Order Thinking skills of
the students.
References:
http://english.tyhs.edu.tw/xoops/html/tyhs/teach_sour
ce96/01.pdf
http://www.edb.gov.hk/attachment/en/curriculum-
development/kla/pshe/references-and-
resources/economics/use_of_graphic_organizers.pdf
http://www.fno.org/oct97/picture.html
https://www.youtube.com/watch?v=k6xsCE4kkb0
Thank You!
Geneve Loraine D. Cruz
BSEd III- B

Graphic organizers as thinking technology

  • 1.
    Graphic Organizers asThinking Technology By: Geneve Loraine D. Cruz BSEd III- B
  • 2.
    Why Graphic Organizers? Whatdo effective educators had to learn to enhance students understanding and retention of lessons taken in class? Learning to think is an essential skill needed in education today. Often educators use teaching methods where students are passive learners. Difficulty arises when students must make meaning out information taken from a book, video , or a lecture. When students interact with content, it is important that they actively construct meaning.
  • 3.
    Graphic Organizers Are mentalmaps that involve students in active thinking through representation of key skills such as sequencing, comparing and contrasting, and classifying. (Burke 129)
  • 4.
    What are theuses of Graphic organizers? Graphic organizers Help students sequence information Help students organize their thoughts in a logical way Help students cluster and brainstorm ideas Help students determine cause- effect relationship Help students organize information visually Help students organize Help students analyze and prioritized information Help students evaluate criteria for decision making
  • 5.
    Types Uses Examples Star/Web Use to show definitions, attributes, examples and brainstorming. Fishbone Map, Spider Web Chart/ Matrix Use to show attributes, comparing, and contrasting and evaluating. T-Chart, Venn Diagram, Compare- contrast Matrix, PMI, Continuum Scale, Ranking, KWLH, Synectics Tree/ Map Use to show classifications, pedigrees, analysis of structures, attributes, examples and brainstorming. Network Tree, cerebral Chart, Questions, Categories, Hypothesis Matrix. Chain Use to show processes, sequences, causes and effects, and chronology. Series of events Chain, Bridging Snapshots, Human Interactions, Outline, Time Sequence Pattern. Sketch Use to show physical Structures, descriptions of places, spatial relationships, concrete objects and visual images. Types, Uses, and Examples of Graphic Organizers
  • 6.
    And Graphic organizerstake on many different looks……
  • 7.
    RESULT Detail Detail FISHBONE MAP It isuse to show the interaction of a complex event or complex phenomenon.
  • 8.
    Topic Concept Theme Detail SPIDER MAP Is usedto describe a central idea: a thing, process, concept or proposition.
  • 9.
    Sounds Like Looks Like T- chart Itis used to analyze similarities and differences between two things(people, places, events, ideas, etc.
  • 10.
    Venn Diagram It isused to analyze similarities and differences between two things(people, places, events, ideas, etc. By placing individual characteristics in either the left or right sections, and similar Common characteristics within the overlapping section.
  • 11.
    Attitude 1 Attitude 2 Attitude3 Name 1 Name 2 Compare- Contrast Matrix It is used to analyze similarities and differences between two things. Key frame questions: What are being compared? How are they similar? How are they different?
  • 12.
    P+ M- I? PMI It is useto show positive, negative, and interesting attributes of a subject, concept, topic, solution, etc. , in order to determine the nature of the outcome and whether it will be worth continuing or not.
  • 13.
    LOW HIGH Continuum Scale 1 2 3 Ranking Isuse for time lines showing historical events or ages etc. Is use when prioritizing elements From most important to least Important; relative position or standing, a series of things or persons; or an orderly arrangement.
  • 14.
    Is use toshow how a series of events. Is use to see changes over time, reveal the sequence of step-by -step methods, illustrate complex processes and show cause and effect.
  • 15.
    Help the studentsactivate prior knowledge. It is a group activity that serves as a model for active thinking during reading. Provides an approach to creative thinking that depends on looking at.
  • 16.
    It is useto show causal information or hierarchy or branching procedures. Use hierarchies, yet tend to be more free form
  • 17.
    Topic Concept Theme Web Is use tolist facts, definitions, attributes, examples, related to a single topic, concept or theme. Allows you to identify the three basic components of most hypothesis.
  • 18.
    Good? Bad? 1 2 3 1 2 3 Questions Hypothesizing isused to list a set of questions. Hypothesize Graphic Organizer
  • 19.
    1 2 34 Categories Hypothesize Graphic Organizer
  • 20.
  • 21.
    Graphical Organizers convertcomplex and messy information collections into meaningful displays.  They compress.  They focus.  They make interpretation, understanding and insight much easier. Graphical Organizers help keep students plan their research forays.  They guide the gathering.  They focus purpose.  They show what is gained.  They show what is still missing. Graphical Organizers sometimes act like mind maps.  They point to the destination.  They identify related sites and sights.
  • 22.
    • It targetsthe HOTS or the Higher Order Thinking skills of the students.
  • 23.
  • 24.
    Thank You! Geneve LoraineD. Cruz BSEd III- B