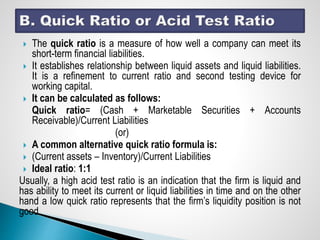
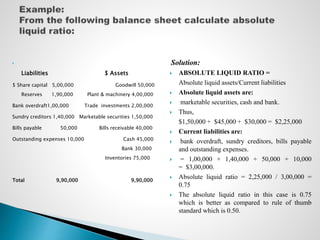
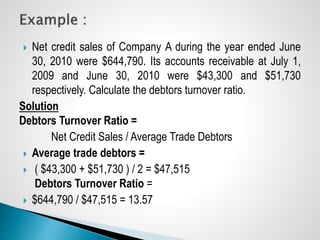
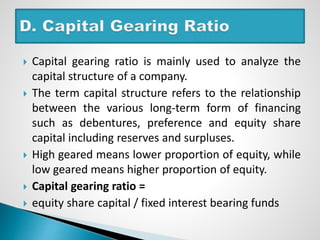
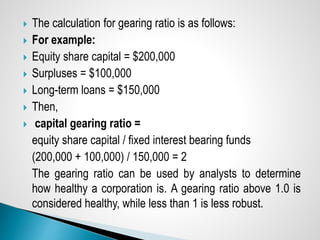
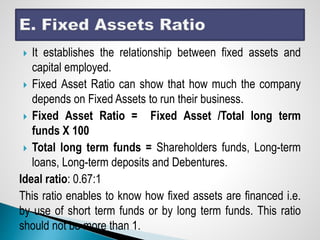
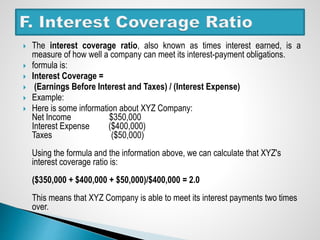
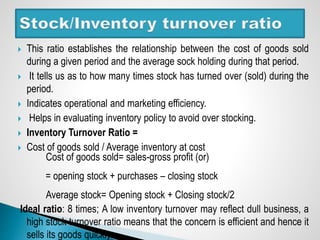
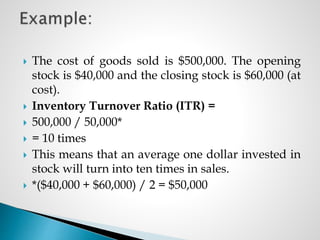
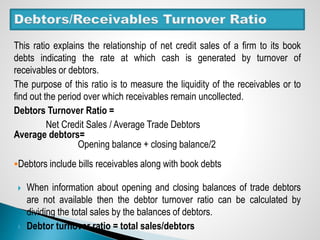
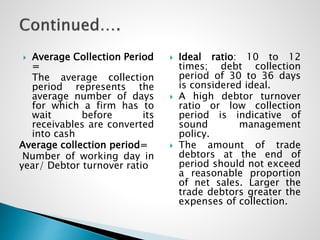
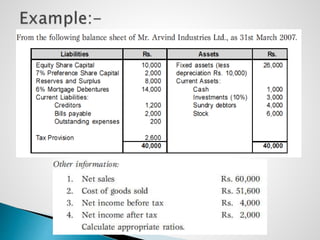
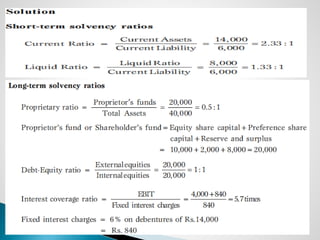
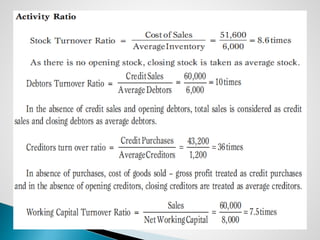
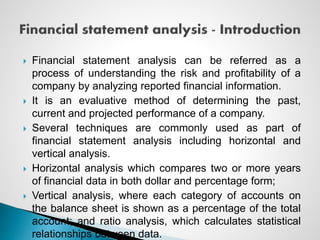
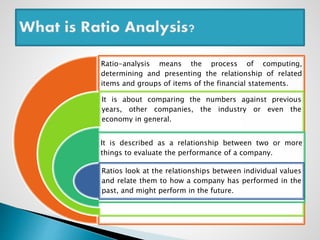
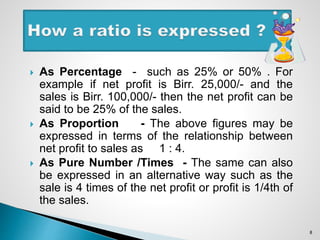
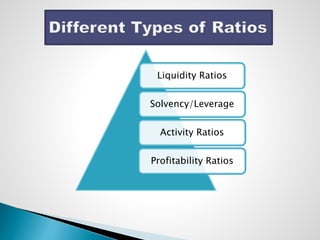
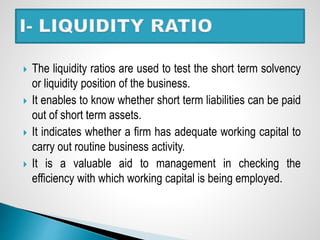
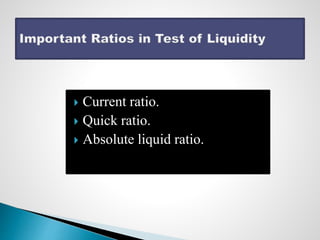
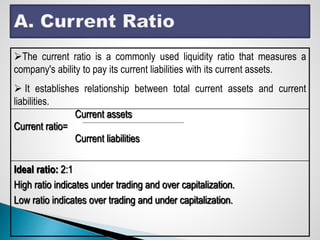
Financial statement analysis involves various techniques to evaluate a company's financial health and performance, including ratio analysis. Ratio analysis calculates statistical relationships between financial data points to gain insights. Key ratios discussed in the document include liquidity ratios like the current ratio and quick ratio, leverage ratios like the debt-to-equity ratio, activity ratios like inventory turnover ratio, and profitability ratios. Calculating and analyzing ratios helps understand a company's liquidity, creditworthiness, operational efficiency, and profit generating ability.
Horizontal analysis is also known as Trend Analysis refers to studying the behavior of individual financial statement items over several accounting periods. The Vertical Analysis concentrates on the relationships between various financial items on a financial statement. Copy the link given below and paste it in new browser window to get more information on Horizontal and Vertical Analysis:- http://www.transtutors.com/homework-help/accounting/horizontal-and-vertical-analysis.aspx
Chapter 1 - Overview of Financial Statement Analysis
Solution Manual Wild
Financial Statement Analysis -
f i n a n c i a l
s tat e m e n t
a n a l y s i s
TENTH EDITION
K. R.
SUBRAMANYAM
JOHN J. WILD
A comprehensive evaluation of an investor's current and future financial state by using currently known variables to predict future cash flows, asset values and withdrawal plans.
Most individuals work in conjunction with an investment or tax professional and use current net worth, tax liabilities, asset allocation, and future retirement and estate plans in developing the plan. These will be used along with estimates of asset growth to determine if a person's financial goals can be met in the future, or what steps need to be taken to ensure that they are.
Liquidity Ratios are an integral part of financial statement analysis. These are various measures to find or to ascertain the firm’s ability to meet the short term expenses or liabilities and convertibility to liquid assets (for further reading click the link) into cash on requirement. Copy the link given below and paste it in new browser window to get more information on Liquidity Ratio:- http://www.transtutors.com/homework-help/accounting/financial-statement-analysis-liquidity-ratios/
Solvency Ratios
Solvency ratios help managers evaluate a company’s ability to pay long term debt.
Solvency ratios are important because they provide lenders and owners information about a business’s ability to withstand operating losses incurred by the business. These ratios are:
Solvency Ratio
Debt to Equity Ratio
Debt to Assets Ratio
Operating Cash Flows to Total Liabilities Ratio
Times Interest Earned Ratio
Profitability Ratio
A profitability ratio is a measure of financial ratio defining the profit percent and return percent from the business using data from financial statements at a specific point of time
It assess business’s ability to generate gross profit, operating profit and net profit from the sales using data from profit& loss statement
It even takes into consideration various return generating ability of business in terms of return on assets, return on capital employed, return on equity, return on investment using data from balance sheet
Types of profitability ratio
Gross Profit Ratio, Net Profit Ratio, Operating Profit Ratio, Return on Assets, Return on Equity, Return on Investment, Return on Capital Employed
Gross Profit Ratio
Gross Profit Ratio(GPR) is a profitability ratio that shows the relationship between gross profit and the revenue from net sales
GPR = (퐆퐫퐨퐬퐬 퐏퐫퐨퐟퐢퐭)/(퐍퐞퐭 퐒퐚퐥퐞퐬)
Net Profit Ratio
The net profit ratio is equal to how much net profit is generated as a ratio of revenue earned through sales
Net Profit Ratio = (퐍퐞퐭 푷풓풐풇풊풕)/(퐍퐞퐭 푺풂풍풆풔)
Operating Profit Margin is a profitability ratio used to calculate the percentage of operating profit a company produces from its operations, prior to deduction of taxes and interest charges
Operating Profit Ratio
Operating Profit Ratio = (퐎퐩퐞퐫퐚퐭퐢퐧퐠 퐏퐫퐨퐟퐢퐭)/(퐍퐞퐭 퐒퐚퐥퐞퐬)
Return on assets (ROA) is a kind of profitability measure used to determine returns on assets relevant when compared across the companies or previous performance of the company
Return On Asset = (퐍퐞퐭 퐏퐫퐨퐟퐢퐭)/(퐀퐯퐠.퐓퐨퐭퐚퐥 퐀퐬퐬퐞퐭퐬)
Return on equity (ROE) is a measure of financial performance calculated by dividing net profit by average shareholders' equity
ROE = (퐍퐞퐭 퐏퐫퐨퐟퐢퐭)/(퐀퐯퐠.퐓퐨퐭퐚퐥 퐄퐪퐮퐢퐭퐲)
Return on capital employed is a profitability ratio used in valuation of company’s financial position depicting the return out of capital employed
ROCE = 퐄퐁퐈퐓/(퐂퐚퐩퐢퐭퐚퐥 퐄퐦퐩퐥퐨퐲퐞퐝)
Return on investment is a profitability measure used by businesses to identify the efficiency of business in generating return out of an investment
ROI = (퐍퐞퐭 퐏퐫퐨퐟퐢퐭)/(퐂퐨퐬퐭 퐨퐟 퐈퐧퐯퐞퐬퐭퐦퐞퐧퐭)
Ratio analysis refers to the analysis and interpretation of the data collected from the financial statements (i.e., Profit and Loss Statement, Balance Sheet and Fund/Cash Flow statement etc.)
Thank You for Watching
DevTech Finance
Liquidity Ratio
Measures the relationship between current assets and current liabilities with the help of data extracted from the balance sheet of the company
Assess the ability of business to meet its short-term obligation usually one year
Assess whether the business has sufficient cash and current assets to pay back its current liabilities
Types of Liquidity Ratio
Current Ratio, Quick Ratio, Cash Ratio
Current Ratio
It measures the ability of the business to meet its current liabilities by converting current assets into cash during the operating cycle of the firm to pay off the debt efficiently on time
Higher the current ratio, better is the firm’s position in managing its working capital
The standard current ratio showing an efficient liquidity is 2:1
Formula, Current Ratio = (𝐂𝐮𝐫𝐫𝐞𝐧𝐭 𝐀𝐬𝐬𝐞𝐭𝐬)/(𝐂𝐮𝐫𝐫𝐞𝐧𝐭 𝐋𝐢𝐚𝐛𝐢𝐥𝐢𝐭𝐢𝐞𝐬)
Quick Ratio
Quick ratio is also known as acid-test ratio
It takes into account only those current assets which are highly liquid so it excludes the inventory/stocks from current asset
Formula, Quick Ratio = (𝐂𝐮𝐫𝐫𝐞𝐧𝐭 𝐀𝐬𝐬𝐞𝐭𝐬 −𝐒𝐭𝐨𝐜𝐤𝐬 −𝐏𝐫𝐞𝐩𝐚𝐢𝐝 𝐄𝐱𝐩𝐞𝐧𝐬𝐞𝐬)/(𝐂𝐮𝐫𝐫𝐞𝐧𝐭 𝐋𝐢𝐚𝐛𝐢𝐥𝐢𝐭𝐢𝐞𝐬)
Quick assets = Current Assets – Stocks – Prepaid Expenses
A standard quick ratio is considered to be 1:1 which is safe for any business
Thus, quick ratio is an indicator of a company’s short-term liquidity position and measures ability of business to meet its short-term obligations with most liquid assets
Cash Ratio
Cash ratio is the most stringent measure of liquidity which takes into account only cash & cash equivalents to get the working capital efficiency of business
The metric calculates a company's ability to repay its short-term debt with readily-liquidated cash resources
Formula, Cash Ratio = (𝐂𝒂𝒔𝒉 & 𝑪𝒂𝒔𝒉 𝑬𝒒𝒖𝒊𝒗𝒂𝒍𝒆𝒏𝒕𝒔)/(𝐂𝐮𝐫𝐫𝐞𝐧𝐭 𝐋𝐢𝐚𝐛𝐢𝐥𝐢𝐭𝐢𝐞𝐬)
Cash equivalents are the assets that can speedily get converted into cash as and when required like cash on hand, demand deposits, money market instruments, savings accounts.
Thank you for Watching
Subscribe to Devtech Finance
This particular project is based on ratio analysis of Coca-Cola International. I have analyzed two years financial performance of Coke i.e. from 2011 to 2012. I hope my this effort will help other interested students.
Operating Ratios asPerformanceMeasure s 11C H A P T E RTHE.docxhopeaustin33688
Operating Ratios as
Performance
Measure s 11
C H A P T E R
THE IMPORTANCE OF RATIOS
Ratios are convenient and uniform measures that are
widely adopted in healthcare financial management.
They are important because they are so widely used, especially
because they are used for credit analysis. But a
ratio is only a number. It has to be considered within the
context of the operation. There is another caveat: ratio
analysis should be conducted as a comparative analysis. In
other words, one ratio standing alone with nothing to
compare it with does not mean very much. When interpreting
ratios, the differences between periods must be
considered, and the reasons for such differences should
be sought. It is a good practice to compare results with
equivalent computations from outside the organization—
regional figures from similar institutions would be a good
example of such outside sources. Caution and good managerial
judgment must always be exercised when working
with ratios.
Financial ratios basically pull together two elements of
the financial statements: one expressed as the numerator
and one as the denominator. To calculate a ratio, divide
the bottom number (the denominator) into the top
number (the numerator). The Case Study in Appendix
25-A entitled “Using Financial Ratios and Benchmarking:
A Case Study in Comparative Analysis” uses financial
ratios as indicators of financial position. We highly recommend
that you spend time with this Case Study, as it
will add depth and background to the contents of this
chapter.
In this chapter we examine liquidity, solvency, and
profitability ratios. Exhibit 11-1 sets out eight basic ratios
After completing this chapter,
you should be able to
1. Understand four types of
liquidity ratios.
2. Understand two types of
solvency ratios.
3. Understand two types of
profitability ratios.
4. Successfully compute ratios
CHAPTER 11 Financial and Operating Ratios as Performance Measures
Exhibit 11–1 Eight Basic Ratios Used in Health Care
Liquidity Ratios
1. Current Ratio
Current Assets
Current Liabilities
2. Quick Ratio
Cash and Cash Equivalents + Net Receivables
Current Liabilities
3. Days Cash on Hand (DCOH)
Unrestricted Cash and Cash Equivalents
Cash Operation Expenses ÷ No. of Days in Period (365)
4. Days Receivables
Net Receivables
Net Credit Revenues ÷ No. of Days in Period (365)
Solvency Ratios
5. Debt Service Coverage Ratio (DSCR)
Change in Unrestricted Net Assets (net income)
+ Interest, Depreciation, Amortization
Maximum Annual Debt Service
6. Liabilities to Fund Balance
Total Liabilities
Unrestricted Fund Balances
Profitability Ratios
7. Operating Margin (%)
Operating Income (Loss)
Total Operating Revenues
8. Return on Total Assets (%)
EBIT (Earnings before Interest and Taxes)
Total Assets
Courtesy of Resource Group, Ltd., Dallas, Texas.
that are widely used in healthcare organizations: four liquidity types, two solvency types, and
two profitability types. All are discussed later.
LIQUIDITY RATIOS
Liquidity r.
Leverage Ratios or Solvency Ratios or Capital Structure Ratios
Leverage or Solvency ratios can be defined as a type of ratio that is used to evaluate whether a company is solvent and well capable of paying off its debt obligations or not. These ratios are used to measure the long term financial position as a test of solvency of an organisation.
The types of Leverage ratios are: –
Proprietary Ratio or Equity Ratio
Equity to Fixed Asset Ratio
Equity to Current Assets Ratio
Current Liabilities to Shareholders Funds Ratio
Debt Equity Ratio
Capital Gearing or Leverage Ratio
Ratio analysis advantages and limitations (Complete Chapter)Syed Mahmood Ali
The aim of this PPT's to provide complete knowledge of Ratio Analysis chapter covering all the formula's for any university student of B.com, M.com, BBA and MBA.
Liquidity Ratios
This type of ratio helps in measuring the ability of a company to take care of its short-term debt obligations. A higher liquidity ratio represents that the company is highly rich in cash.
The types of liquidity ratios are: –
Current Ratio or Working Capital Ratio
Quick Ratio or Liquidity Ratio or Acid Test Ratio
Absolute Liquid Ratio or Cash Ratio
Stock to Working Capital Ratio
Current Ratio: The current ratio is the ratio between the current assets and current liabilities of a company. The current ratio is used to indicate the liquidity of an organization in being able to meet its debt obligations in the upcoming twelve months. A higher current ratio will indicate that the organization is highly capable of repaying its short-term debt obligations.
Current Ratio = Current Assets / Current Liabilities
Current Assets:
Current Assets means cash and those assets which can be converted into cash within one year in ordinary course of business.
Current Liabilities:
Current Liabilities are those which are to be paid by the firm in one year.
Quick Ratio or Liquidity Ratio or Acid Test Ratio :
The quick ratio is used to ascertain information pertaining to the capability of a company in paying off its current liabilities on an immediate basis.
The formula used for the calculation of a quick ratio is-
Quick Ratio = (Cash and Cash Equivalents + Marketable Securities + Accounts Receivables) / Current Liabilities
. Absolute Liquid Ratio or Cash Ratio:
The cash ratio measures a company’s ability to pay off short-term liabilities with cash and cash equivalents:
Cash ratio = Cash and Cash equivalents / Current Liabilities
Stock to Working Capital Ratio:
It is calculated by dividing the value of stock (or inventories such as raw materials, work in progress, finished goods, stores and packing materials) by the Working capital.
115
Financial and
Operating Ratios as
Performance
Measure s
11
C H A P T E R
THE IMPORTANCE OF RATIOS
Ratios are convenient and uniform measures that are
widely adopted in healthcare financial management.
They are important because they are so widely used, es-
pecially because they are used for credit analysis. But a
ratio is only a number. It has to be considered within the
context of the operation. There is another caveat: ratio
analysis should be conducted as a comparative analysis. In
other words, one ratio standing alone with nothing to
compare it with does not mean very much. When inter-
preting ratios, the differences between periods must be
considered, and the reasons for such differences should
be sought. It is a good practice to compare results with
equivalent computations from outside the organization—
regional figures from similar institutions would be a good
example of such outside sources. Caution and good man-
agerial judgment must always be exercised when working
with ratios.
Financial ratios basically pull together two elements of
the financial statements: one expressed as the numerator
and one as the denominator. To calculate a ratio, divide
the bottom number (the denominator) into the top
number (the numerator). The Case Study in Appendix
25-A entitled “Using Financial Ratios and Benchmark-
ing: A Case Study in Comparative Analysis” uses financial
ratios as indicators of financial position. We highly rec-
ommend that you spend time with this Case Study, as it
will add depth and background to the contents of this
chapter.
In this chapter we examine liquidity, solvency, and
profitability ratios. Exhibit 11-1 sets out eight basic ratios
After completing this chapter,
you should be able to
1. Understand four types of
liquidity ratios.
2. Understand two types of
solvency ratios.
3. Understand two types of
profitability ratios.
4. Successfully compute ratios.
P r o g r e s s N o t e s
116 CHAPTER 11 Financial and Operating Ratios as Performance Measures
Exhibit 11–1 Eight Basic Ratios Used in Health Care
Liquidity Ratios
1. Current Ratio
Current Assets
Current Liabilities
2. Quick Ratio
Cash and Cash Equivalents + Net Receivables
Current Liabilities
3. Days Cash on Hand (DCOH)
Unrestricted Cash and Cash Equivalents
Cash Operation Expenses ÷ No. of Days in Period (365)
4. Days Receivables
Net Receivables
Net Credit Revenues ÷ No. of Days in Period (365)
Solvency Ratios
5. Debt Service Coverage Ratio (DSCR)
Change in Unrestricted Net Assets (net income)
+ Interest, Depreciation, Amortization
Maximum Annual Debt Service
6. Liabilities to Fund Balance
Total Liabilities
Unrestricted Fund Balances
Profitability Ratios
7. Operating Margin (%)
Operating Income (Loss)
Total Operating Revenues
8. Return on Total Assets (%)
EBIT (Earnings before Interest and Taxes)
Total Assets
Courtesy of Resource Group, Ltd., Dallas, Texas.
that are widely used in healthcare organizations: four liquidity ty.
Welcome to TechSoup New Member Orientation and Q&A (May 2024).pdfTechSoup
In this webinar you will learn how your organization can access TechSoup's wide variety of product discount and donation programs. From hardware to software, we'll give you a tour of the tools available to help your nonprofit with productivity, collaboration, financial management, donor tracking, security, and more.
We all have good and bad thoughts from time to time and situation to situation. We are bombarded daily with spiraling thoughts(both negative and positive) creating all-consuming feel , making us difficult to manage with associated suffering. Good thoughts are like our Mob Signal (Positive thought) amidst noise(negative thought) in the atmosphere. Negative thoughts like noise outweigh positive thoughts. These thoughts often create unwanted confusion, trouble, stress and frustration in our mind as well as chaos in our physical world. Negative thoughts are also known as “distorted thinking”.
The French Revolution, which began in 1789, was a period of radical social and political upheaval in France. It marked the decline of absolute monarchies, the rise of secular and democratic republics, and the eventual rise of Napoleon Bonaparte. This revolutionary period is crucial in understanding the transition from feudalism to modernity in Europe.
For more information, visit-www.vavaclasses.com
Unit 8 - Information and Communication Technology (Paper I).pdfThiyagu K
This slides describes the basic concepts of ICT, basics of Email, Emerging Technology and Digital Initiatives in Education. This presentations aligns with the UGC Paper I syllabus.
Ethnobotany and Ethnopharmacology:
Ethnobotany in herbal drug evaluation,
Impact of Ethnobotany in traditional medicine,
New development in herbals,
Bio-prospecting tools for drug discovery,
Role of Ethnopharmacology in drug evaluation,
Reverse Pharmacology.
2024.06.01 Introducing a competency framework for languag learning materials ...Sandy Millin
http://sandymillin.wordpress.com/iateflwebinar2024
Published classroom materials form the basis of syllabuses, drive teacher professional development, and have a potentially huge influence on learners, teachers and education systems. All teachers also create their own materials, whether a few sentences on a blackboard, a highly-structured fully-realised online course, or anything in between. Despite this, the knowledge and skills needed to create effective language learning materials are rarely part of teacher training, and are mostly learnt by trial and error.
Knowledge and skills frameworks, generally called competency frameworks, for ELT teachers, trainers and managers have existed for a few years now. However, until I created one for my MA dissertation, there wasn’t one drawing together what we need to know and do to be able to effectively produce language learning materials.
This webinar will introduce you to my framework, highlighting the key competencies I identified from my research. It will also show how anybody involved in language teaching (any language, not just English!), teacher training, managing schools or developing language learning materials can benefit from using the framework.
Palestine last event orientationfvgnh .pptxRaedMohamed3
An EFL lesson about the current events in Palestine. It is intended to be for intermediate students who wish to increase their listening skills through a short lesson in power point.
Synthetic Fiber Construction in lab .pptxPavel ( NSTU)
Synthetic fiber production is a fascinating and complex field that blends chemistry, engineering, and environmental science. By understanding these aspects, students can gain a comprehensive view of synthetic fiber production, its impact on society and the environment, and the potential for future innovations. Synthetic fibers play a crucial role in modern society, impacting various aspects of daily life, industry, and the environment. ynthetic fibers are integral to modern life, offering a range of benefits from cost-effectiveness and versatility to innovative applications and performance characteristics. While they pose environmental challenges, ongoing research and development aim to create more sustainable and eco-friendly alternatives. Understanding the importance of synthetic fibers helps in appreciating their role in the economy, industry, and daily life, while also emphasizing the need for sustainable practices and innovation.
Students, digital devices and success - Andreas Schleicher - 27 May 2024..pptxEduSkills OECD
Andreas Schleicher presents at the OECD webinar ‘Digital devices in schools: detrimental distraction or secret to success?’ on 27 May 2024. The presentation was based on findings from PISA 2022 results and the webinar helped launch the PISA in Focus ‘Managing screen time: How to protect and equip students against distraction’ https://www.oecd-ilibrary.org/education/managing-screen-time_7c225af4-en and the OECD Education Policy Perspective ‘Students, digital devices and success’ can be found here - https://oe.cd/il/5yV
This is a presentation by Dada Robert in a Your Skill Boost masterclass organised by the Excellence Foundation for South Sudan (EFSS) on Saturday, the 25th and Sunday, the 26th of May 2024.
He discussed the concept of quality improvement, emphasizing its applicability to various aspects of life, including personal, project, and program improvements. He defined quality as doing the right thing at the right time in the right way to achieve the best possible results and discussed the concept of the "gap" between what we know and what we do, and how this gap represents the areas we need to improve. He explained the scientific approach to quality improvement, which involves systematic performance analysis, testing and learning, and implementing change ideas. He also highlighted the importance of client focus and a team approach to quality improvement.
2. Financial statement analysis can be referred as a
process of understanding the risk and profitability of a
company by analyzing reported financial information.
It is an evaluative method of determining the past,
current and projected performance of a company.
Several techniques are commonly used as part of
financial statement analysis including horizontal and
vertical analysis.
Horizontal analysis which compares two or more years
of financial data in both dollar and percentage form;
Vertical analysis, where each category of accounts on
the balance sheet is shown as a percentage of the total
account; and ratio analysis, which calculates statistical
relationships between data.
3. Ratio-analysis means the process of computing,
determining and presenting the relationship of related
items and groups of items of the financial statements.
It is about comparing the numbers against previous
years, other companies, the industry or even the
economy in general.
It is described as a relationship between two or more
things to evaluate the performance of a company.
Ratios look at the relationships between individual values
and relate them to how a company has performed in the
past, and might perform in the future.
4. Kennedy and Mc Mulla, “The relationship of
one to another, expressed in simple term of
mathematical is know as ratio”.
According to Accountant’s Handbook by Wixon,
kell and Bedford, a ratio “is an expression of
the quantitative relationship between two
numbers”.
According to Myers, " Ratio analysis of financial
statements is a study of relationship among
various financial factors in a business as
disclosed by a single set of statements and a
study of trend of these factors as shown in a
5. It simplifies the financial statements.
Measuring the efficiency of organization.
Measuring the liquidity position of the companies.
Determining the profitability of the company.
Measuring the capacity of companies to borrow in the future.
Understanding the overall financial position of organization.
Helps in planning and forecasting.
6. Based on Historical Data
No Standard Interpretation.
Same data may be
interpreted in different
ways.
Difference in Accounting
Methods make comparison
difficult.
Effect of Price Level
Changes
7. Ratios have a great significance for different kinds of people. They are:-
Investors
Managers
Creditors
Debenture holders
Government
Employees
General public
8. As Percentage - such as 25% or 50% . For
example if net profit is Birr. 25,000/- and the
sales is Birr. 100,000/- then the net profit can be
said to be 25% of the sales.
As Proportion - The above figures may be
expressed in terms of the relationship between
net profit to sales as 1 : 4.
As Pure Number /Times - The same can also
be expressed in an alternative way such as the
sale is 4 times of the net profit or profit is 1/4th of
the sales.
8
10. The liquidity ratios are used to test the short term solvency
or liquidity position of the business.
It enables to know whether short term liabilities can be paid
out of short term assets.
It indicates whether a firm has adequate working capital to
carry out routine business activity.
It is a valuable aid to management in checking the
efficiency with which working capital is being employed.
12. The current ratio is a commonly used liquidity ratio that measures a
company's ability to pay its current liabilities with its current assets.
It establishes relationship between total current assets and current
liabilities.
Current assets
Current ratio=
Current liabilities
Ideal ratio: 2:1
High ratio indicates under trading and over capitalization.
Low ratio indicates over trading and under capitalization.
13.
14. Balance Sheet for Company XYZ
Year ending December 31, 2011
Assets
Cash 1,000
Accounts Receivable 500
Inventory 500
Total Current Assets 2,000
Liabilities
Accounts Payable 500
Current Long-Term Debt 500
Total Current Liabilities 1,000
Long Term Debt 500
Total Liabilities 1,500
Owners' Equity 500
Solution:-
We can calculate Company XYZ's
Current ratio as:
2,000 / 1,000 = 2.0
As of the end of 2011, Company XYZ had
$2.00 in current assets for every dollar of
current liabilities.
This ratio can also be presented as 2:1.
In current ratio current liabilities are taken
as 1 .
The company appears to be able to
easily service its short-term debt
obligations.
There is a high degree of safety for
creditors of the company.
15. The quick ratio is a measure of how well a company can meet its
short-term financial liabilities.
It establishes relationship between liquid assets and liquid liabilities.
It is a refinement to current ratio and second testing device for
working capital.
It can be calculated as follows:
Quick ratio= (Cash + Marketable Securities + Accounts
Receivable)/Current Liabilities
(or)
A common alternative quick ratio formula is:
(Current assets – Inventory)/Current Liabilities
Ideal ratio: 1:1
Usually, a high acid test ratio is an indication that the firm is liquid and
has ability to meet its current or liquid liabilities in time and on the other
hand a low quick ratio represents that the firm’s liquidity position is not
good.
16. Calculation of Company
XYZ's quick ratio as follows:
($60,000 + $10,000 +
$40,000)/$65,000 = 1.7
This means that for every
dollar of Company XYZ's
current liabilities, the firm
has $1.70 of very liquid
assets to cover those
immediate obligations.
17. This ratio establishes a relationship between absolute
liquid assets and current liabilities.
Formula:
Absolute liquid ratio =
Absolute liquid assets / Current liabilities
Where absolute liquid assets are =
[ Cash + Bank + marketable securities.]
Current Liabilities = [Bank overdraft, sundry creditors, bills
payable and outstanding expenses.]
Ideal ratio: 0.5:1
18.
Liabilities $ Assets
$ Share capital 5,00,000 Goodwill 50,000
Reserves 1,90,000 Plant & machinery 4,00,000
Bank overdraft1,00,000 Trade investments 2,00,000
Sundry creditors 1,40,000 Marketable securities 1,50,000
Bills payable 50,000 Bills receivable 40,000
Outstanding expenses 10,000 Cash 45,000
Bank 30,000
Inventories 75,000
Total 9,90,000 9,90,000
Solution:
ABSOLUTE LIQUID RATIO =
Absolute liquid assets/Current liabilities
Absolute liquid assets are:
marketable securities, cash and bank.
Thus,
$1,50,000 + $45,000 + $30,000 = $2,25,000
Current liabilities are:
bank overdraft, sundry creditors, bills payable
and outstanding expenses.
= 1,00,000 + 1,40,000 + 50,000 + 10,000
= $3,00,000.
Absolute liquid ratio = 2,25,000 / 3,00,000 =
0.75
The absolute liquid ratio in this case is 0.75
which is better as compared to rule of thumb
standard which is 0.50.
19.
20.
21. Solvency indicates that position of an enterprise where it is capable of meeting long term
obligations.
Long term solvency ratios denote the ability of the organization to repay the loan and
interest.
When an organization's assets are more than its liabilities is known as solvent
organization.
It is useful for bankers and creditors to find out the paying capacity of the company.
The most important ratios under leverage are:-
Debt equity ratio
Proprietary ratio
Solvency ratio
Capital gearing ratio
Fixed assets ratio
Interest coverage ratio
22. The debt-to-equity ratio is a measure of the relationship
between the capital contributed by creditors and the capital
contributed by shareholders.
It is calculated using the following formula:
Debt-to-Equity Ratio =
Total Liabilities/ Shareholders' Equity
Ideal ratio: 2:1; It means for every 2 shares there is 1 debt. If
the debt is less than 2 times the equity, it means the creditors
are relatively less and the financial structure is sound.
If the debt is more than 2 times the equity, the state of long
term creditors are more and indicate weak financial structure.
23. Debt-to-Equity Ratio =
Total Debt / Total Equity
$15,000,000/ $10,000,000 =
1.5 times, or 150%
This means that for every
dollar of Company XYZ
owned by the shareholders,
Company XYZ owes $1.50 to
creditors.
24. It establishes relationship between the proprietors fund or
shareholders funds and the total assets.
Proprietary Ratio =
Shareholders funds / Total Assets
Ideal ratio: 0.5:1
Higher the ratio better the long term solvency (financial)
position of the company. This ratio indicates the extent to which
the assets of the company can be lost without affecting the
interest of the creditors of the company.
25. CC Ltd has total shareholders funds of $2,200,000 and the
total assets are $2,750,000.
Then:
Equity Ratio = Shareholders funds / Total Assets
2,200,000 / 2,750,000 = 0.8
This means that shareholders contribute 80 cents for every
$1 employed in the business, with creditors contributing the
remaining 20 cents.
26. It expresses the relationship between total assets and
total liabilities of a business.
This ratio is a small variant of equity ratio and can be
simply calculated as 100-equity ratio.
Solvency Ratio =Total Assets / Total Liabilities
No standard ratio is fixed in this regard. It may be
compared with similar, such organizations to evaluate
the solvency position.
Higher the solvency ratio, the stronger is its financial
position and vice-versa.
27. Capital gearing ratio is mainly used to analyze the
capital structure of a company.
The term capital structure refers to the relationship
between the various long-term form of financing
such as debentures, preference and equity share
capital including reserves and surpluses.
High geared means lower proportion of equity, while
low geared means higher proportion of equity.
Capital gearing ratio =
equity share capital / fixed interest bearing funds
28. The calculation for gearing ratio is as follows:
For example:
Equity share capital = $200,000
Surpluses = $100,000
Long-term loans = $150,000
Then,
capital gearing ratio =
equity share capital / fixed interest bearing funds
(200,000 + 100,000) / 150,000 = 2
The gearing ratio can be used by analysts to determine
how healthy a corporation is. A gearing ratio above 1.0 is
considered healthy, while less than 1 is less robust.
29. It establishes the relationship between fixed assets and
capital employed.
Fixed Asset Ratio can show that how much the company
depends on Fixed Assets to run their business.
Fixed Asset Ratio = Fixed Asset /Total long term
funds X 100
Total long term funds = Shareholders funds, Long-term
loans, Long-term deposits and Debentures.
Ideal ratio: 0.67:1
This ratio enables to know how fixed assets are financed i.e.
by use of short term funds or by long term funds. This ratio
should not be more than 1.
30. The interest coverage ratio, also known as times interest earned, is a
measure of how well a company can meet its interest-payment obligations.
formula is:
Interest Coverage =
(Earnings Before Interest and Taxes) / (Interest Expense)
Example:
Here is some information about XYZ Company:
Net Income $350,000
Interest Expense ($400,000)
Taxes ($50,000)
Using the formula and the information above, we can calculate that XYZ's
interest coverage ratio is:
($350,000 + $400,000 + $50,000)/$400,000 = 2.0
This means that XYZ Company is able to meet its interest payments two times
over.
31. Activity ratios indicate the performance of an organization.
This indicate the effective utilization of the various assets of
the organization.
Most of the ratio falling under this category is based on
turnover and hence these ratios are called as turnover ratios.
Important Ratios in Activity Ratio
a. Stock/Inventory turnover ratio.
b. Debtors turnover ratio.
c. Creditors turnover ratio.
d. Wording capital turnover ratio.
e. Fixed assets turnover ratio.
f. Current assets turnover ratio.
32. This ratio establishes the relationship between the cost of goods sold
during a given period and the average sock holding during that period.
It tells us as to how many times stock has turned over (sold) during the
period.
Indicates operational and marketing efficiency.
Helps in evaluating inventory policy to avoid over stocking.
Inventory Turnover Ratio =
Cost of goods sold / Average inventory at cost
Cost of goods sold= sales-gross profit (or)
= opening stock + purchases – closing stock
Average stock= Opening stock + Closing stock/2
Ideal ratio: 8 times; A low inventory turnover may reflect dull business, a
high stock turnover ratio means that the concern is efficient and hence it
sells its goods quickly.
33. The cost of goods sold is $500,000. The opening
stock is $40,000 and the closing stock is $60,000 (at
cost).
Inventory Turnover Ratio (ITR) =
500,000 / 50,000*
= 10 times
This means that an average one dollar invested in
stock will turn into ten times in sales.
*($40,000 + $60,000) / 2 = $50,000
34. This ratio explains the relationship of net credit sales of a firm to its book
debts indicating the rate at which cash is generated by turnover of
receivables or debtors.
The purpose of this ratio is to measure the liquidity of the receivables or to
find out the period over which receivables remain uncollected.
Debtors Turnover Ratio =
Net Credit Sales / Average Trade Debtors
Average debtors=
Opening balance + closing balance/2
Debtors include bills receivables along with book debts
When information about opening and closing balances of trade debtors
are not available then the debtor turnover ratio can be calculated by
dividing the total sales by the balances of debtors.
Debtor turnover ratio = total sales/debtors
35. Average Collection Period
=
The average collection
period represents the
average number of days
for which a firm has to
wait before its
receivables are converted
into cash
Average collection period=
Number of working day in
year/ Debtor turnover ratio
Ideal ratio: 10 to 12
times; debt collection
period of 30 to 36 days
is considered ideal.
A high debtor turnover
ratio or low collection
period is indicative of
sound management
policy.
The amount of trade
debtors at the end of
period should not exceed
a reasonable proportion
of net sales. Larger the
trade debtors greater the
expenses of collection.
36. Net credit sales of Company A during the year ended June
30, 2010 were $644,790. Its accounts receivable at July 1,
2009 and June 30, 2010 were $43,300 and $51,730
respectively. Calculate the debtors turnover ratio.
Solution
Debtors Turnover Ratio =
Net Credit Sales / Average Trade Debtors
Average trade debtors =
( $43,300 + $51,730 ) / 2 = $47,515
Debtors Turnover Ratio =
$644,790 / $47,515 = 13.57
37. This ratio indicates the number of times the creditors are paid in a year. It is
useful for creditors in finding out how much time the firm is likely to take in
repaying its trade creditors.
Formula:
Creditors Turnover Ratio =
Net Credit Purchase / Average Trade Creditors
Average creditors=
Opening balance + closing balance/2
Average Payment period=
Number of working day in year/ Creditors turnover ratio
If information about credit purchases is not available, total purchases may
be taken, if opening and closing balances of creditors are not given the
balances of creditors may be taken.
Trade creditors include sundry creditors and bills payable.
Ideal ratio: 12 times; debt payment period of 30 days is considered ideal.
Very less creditors turnover ratio, or a high debt payment period may indicate the firms
inability in meeting its obligation in time.
38. Money online Ltd has the following information:
Trade creditors at 1 Jan 2010: $6,000
Trade creditors at 31 Dec 2010: $8,000
Total Purchases (including cash purchases $2,000): $12,000
Solution:
Creditors Turnover Ratio =
Net Credit Purchase / Average Trade Creditors
Credit Purchases = 12,000 - 2,000 = $10,000
Average Trade Creditors =
(6,000 + 8,000) / 2 = $7,000
Creditors Turnover Ratio = 10,000 / 7,000 = 1.43
39. This ratio indicates the number of times the working capital is turned over in
the course of the year.
It Measures efficiency in working capital usage.
It establishes relationship between cost of sales and working capital.
Formula:
Working capital turnover ratio=
Cost of sales/Average working capital
Average working capital =
Opening + closing working capital/2
If cost of sales is not given, then sales can be used. If opening working
capital is not disclosed then working capital at the year end will be used.
Working capital turnover ratio= cost of sales (sales)/net working capital.
Net Working Capital = Current assets – Current liabilities
40. A higher ratio indicates efficient utilization of working capital and a low
ratio indicates inefficient utilization of working capital.
But a very high ratio is not a good situation for any firm and hence care
must be taken while interpreting the ratio.
Example:
Cash 10,000
Bills Receivables 5,000
Sundry Debtors 25,000
Stock 20,000
Sundry Creditors 30,000
Cost of sales 150,000
Calculation:
Calculate working capital turnover ratio
Working Capital Turnover Ratio = Cost of Sales / Net Working Capital
Current Assets = $10,000 + $5,000 + $25,000 + $20,000 = $60,000
Current Liabilities = $30,000
Net Working Capital = Current assets – Current liabilities
= $60,000 − $30,000
= $30,000
So the working Capital Turnover Ratio = 150,000 / 30,000
= 5 times
41. This ratio establishes a relationship between fixed
assets and sales.
It indicates how well the business is using its fixed
assets to generate sales.
Fixed assets turnover ratio=Net sales/ Fixed assets
Ideal ratio: 5 times
A high ratio indicates better utilization of fixed
assets.
A low ratio indicates under utilization of fixed
assets.
42. A high current assets turnover ratio indicates the
capability of the organization to achieve maximum sales
with the maximum investment in current assets.
It indicates that the current assets are turned over in the
form of sales more number of times.
As such, higher the current assets turnover ratio, better
will be the situation.
Current assets turnover ratio:
Net sales/current assets
Current assets include the assets like inventories,
sundry debtors, bills receivables, cash in hand or at
bank, marketable securities, prepaid expenses and
short term loans and advances.
43. This ratio establishes a relationship between total
assets and sales. This ratio enables to know the
efficient utilization of total assets of a business.
Total assets turnover ratio= Net sales/ Total assets
Ideal ratio: 2 times
High ratio indicates efficient utilization and ratio less
than 2 indicates under utilization.
44. Profitability ratios indicate the profit earning
capacity of a business.
Profitability ratios are calculated either in
relation to sales or in relation to investments.
Profitability ratios can be classified into two
categories.
a) General Profitability Ratios.
b) Overall Profitability Ratios.
45. Gross profit ratio :
It expresses the relationship of gross profit to net sales and
is expressed in terms of percentage.
Higher the gross profit ratio better the results.
Net profit ratio :
It expresses the relationship between net profit after taxes
to sales.
Higher the ratio better is the profitability.
Operating ratio:
This ratio establishes a relationship between cost of goods
sold plus other operating expenses and net sales.
Higher the ratio the less favorable.
Operating profit ratio:
This ratio establishes the relationship between operation
profit and net sales.
46.
47.
48.
49. Return on shareholders investment or Net worth
ratio.
Return on equity capital.
Return on capital employed.
Return on total resources.
Dividend yield ratio.
Preference dividend cover ratio.
Equity dividend cover ratio.
Price covering ratio.
Dividend pay out ratio.
Earning per share.
50. Shareholders investment also called return on
proprietor’s funds is the ratio of net profit to
proprietor’s funds.
It is calculated by the prospective investor in the
business to find out whether the investment would be
worth-making in terms of return as compared to the risk
involved in the business.
Net profit (After tax and int)
Return on shareholders investment=
Proprietors funds
51. This ratio is of great importance to the present and
prospective shareholders as well as the management of the
company.
As this ratio reveals how well the resources of a firm are
being used, higher the ratio, better are the results.
The return on shareholders investment should be
compared with the return of other similar firms in the same
industry.
The inter firm comparison of this ratio determines whether
their investments in the firm are attractive or not as the
investors would like to invest only where their return is
higher.
Similarly, trend ratios can also be calculated for a number
of years to get5 an idea of the prosperity, growth of
deterioration in the company’s profitability and efficiency.
52. This ratio establishes the relationship between
net profit available to equity shareholders ad
the amount of capital invested by them. It is
used to compare the performance of company's
equity capital with those of other companies,
and thus help the investor in choosing a
company with higher return on equity capital.
Net profit – preference dividend
Return on equity capital=
Equity share capital (paid up)
53. This ratio is the most appropriate indicator of the
earning power of the capital employed in the business. It
also acts as a pointer to the management showing the
progress or deterioration in the earning capacity and
efficiency of the business.
Net profit before taxes and
interest on long – term loans and debentures
Return on capital employed=
Capital employed
Ideal ratio: 15%
If the actual ratio is equal ratio is equal to or above 15%
It indicates higher productivity of the capital employed
and vice versa
54. This ratio acts as an yardstick to assess the
efficiency of the efficiency of the operations of
the business as it indicates the extent to which
assets employed in the business are utilized to
results in net profit.
Net profit
Return on total recourses = X 100
Total assets
55. It refers to the percentage or ratio of dividend
paid per share to the market price per share.
This ratio throws light on the effective rate of
return on investment, which potential investors
may hope to earn.
Dividend paid per equity share
Dividend yield ratio =
Market price per equity share
56. It indicates how many times the preference
dividend is covered by profits after tax. This ratio
measures the margin o safety for preference
shareholders. Such investors normally expect
their dividend to be covered about 3 times by
profits available for dividend purpose.
Profit after tax
Preference dividend cover =
Annual programme dividend
57. This ratio indicates the number of times the dividend is
covered by the amount of profit available for equity
shareholders.
Net profit after tax - pref
dividend
Equity dividend cover =
Dividend paid on equity capital
Earning per equity share
=
Dividend per equity share
Ideal ratio: 2 times; i.e. for every Rs. 100 profits available
for dividend, Rs. 50 is retained in the business and Rs. 50
is distributed. Higher the ratio higher is extent of
retained earnings and higher is the degree of certainty
that dividend will be repeated in future
58. It shows how many times the annual earnings the
present shareholders are willing to pay to get a share.
This ratio helps investors to know the effect of earnings
per share on the market price of the share.
This ratio when calculated for several years can be used
as term analysis for predicting future price earning
ratios and therefore, future stock prices.
Average market price per share
Price earning ratio=
Earning per share
59. This ratio indicates the proportion of earnings available
which equity share holders actually receive in the form of
dividend.
Dividend paid per share
Pay out ratio =
Earning per share
An investor primarily interested should invest in equity
share of a company with high pay out ratio. A company
having low pay out ratio need not necessarily be a bad
company. A company having income may like to finance
expansion out of the income, thus low pay out ratio.
investor interested in stock price appreciation may well
invest in such a company though the pay out ratio is low.
60. This ratio indicates the earning per equity share.
It establishes the relationship between net profit
available for equity shareholders and the
number of equity shares.
Net profit available for equity
share holders
Earning per share =
Number of equity
shares