Download to read offline


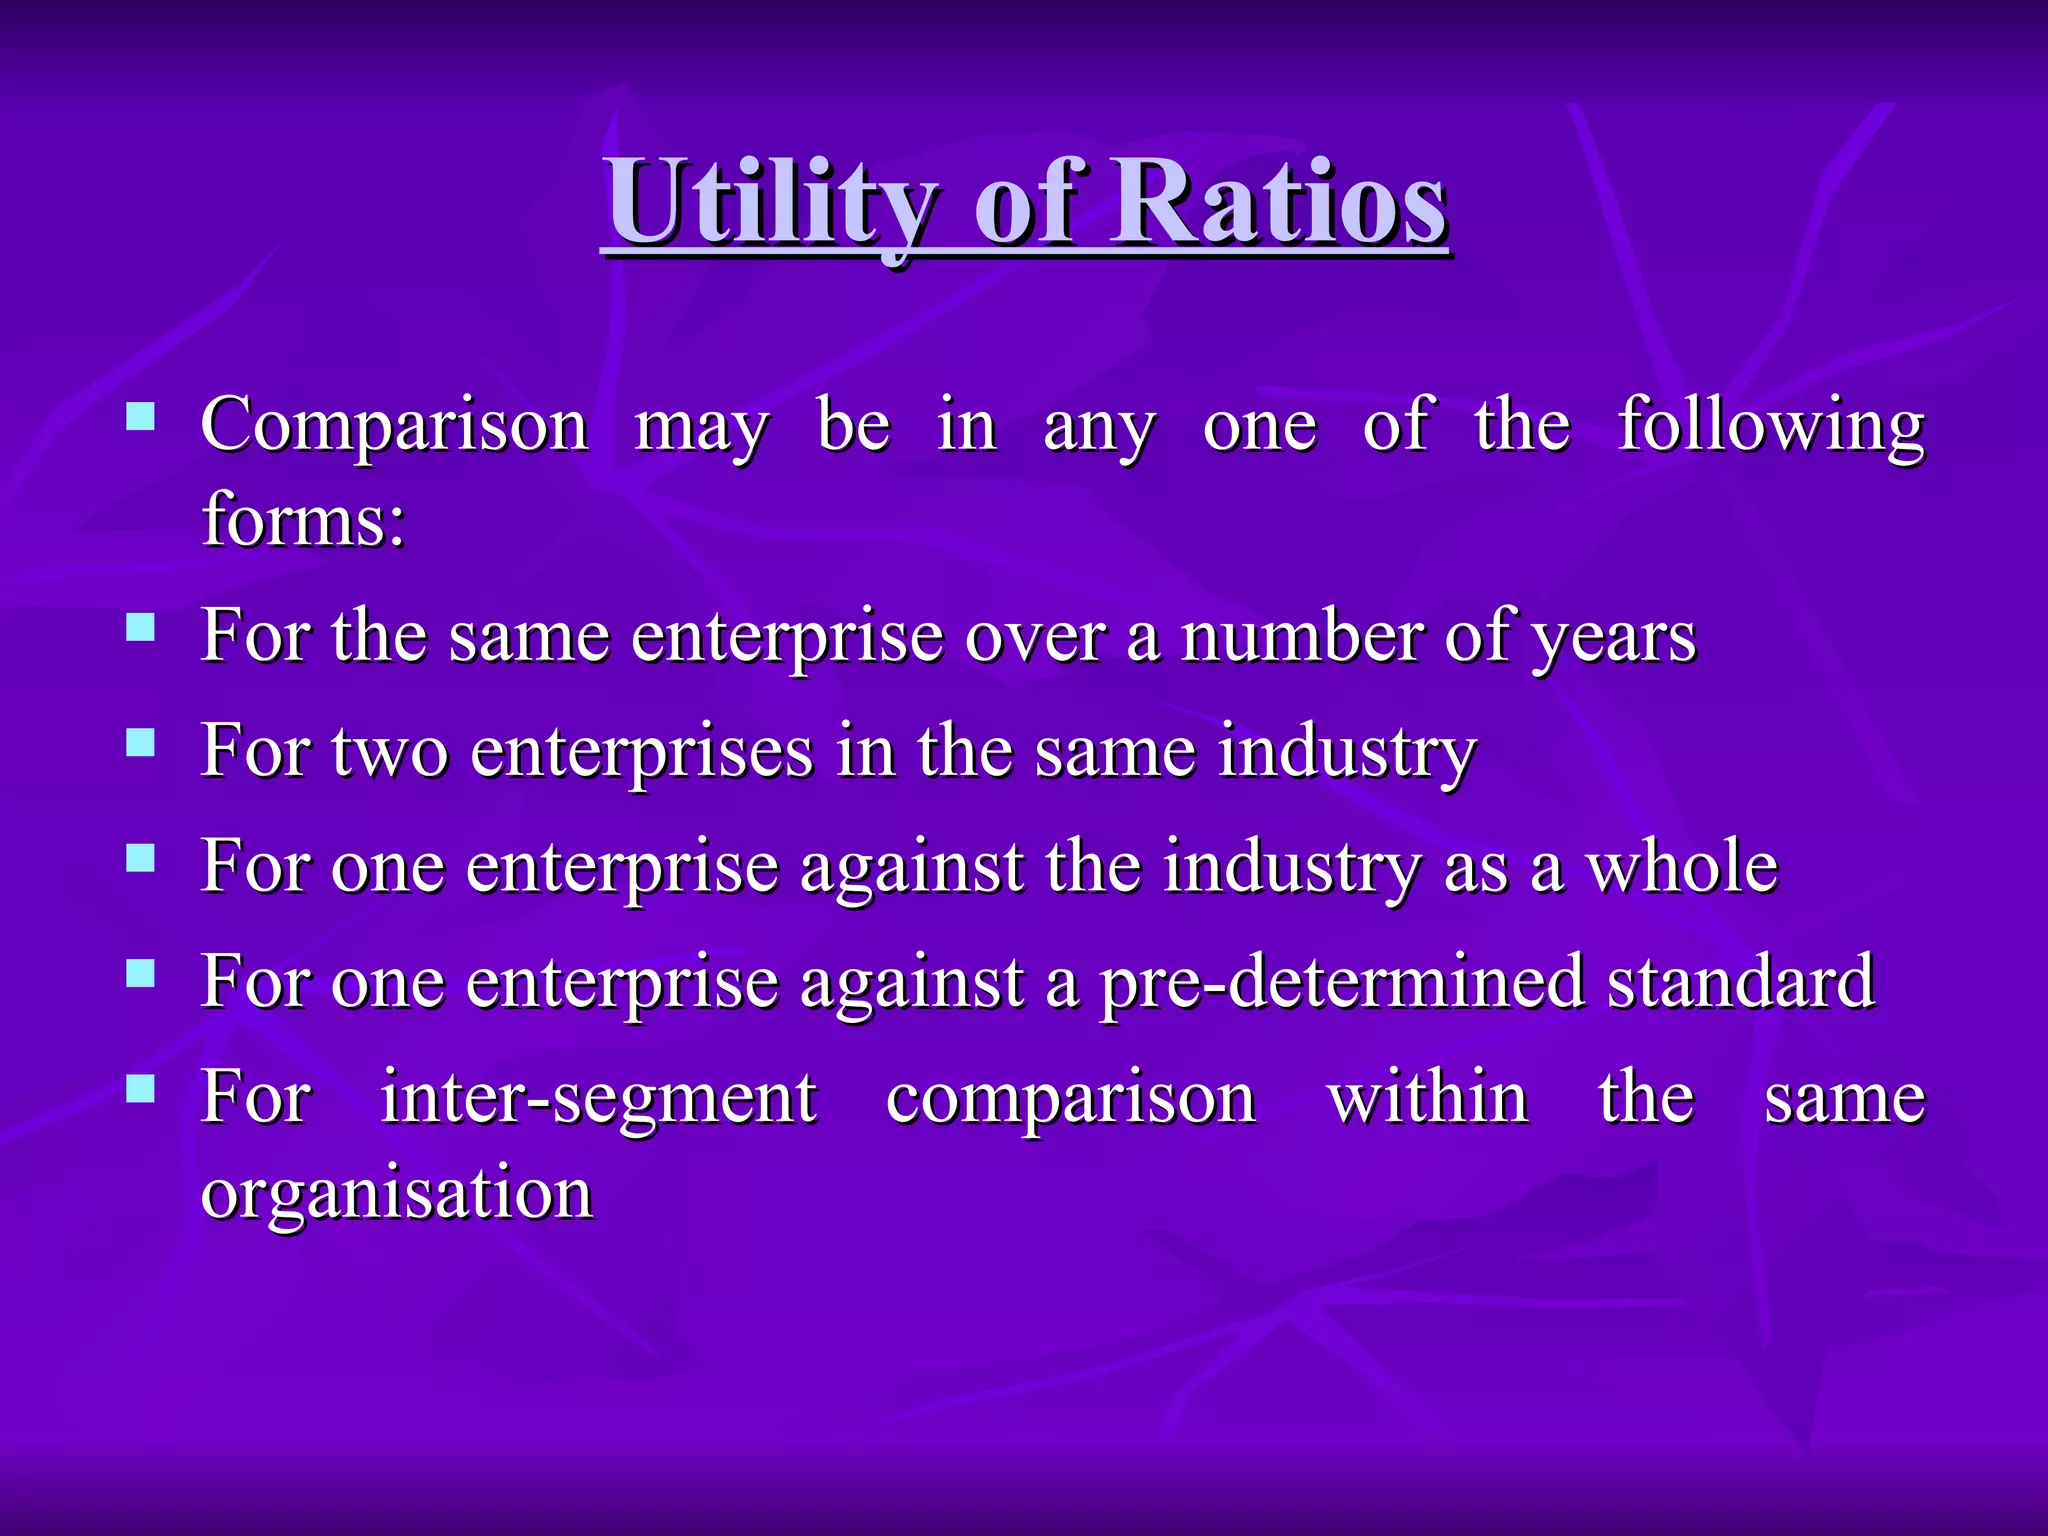
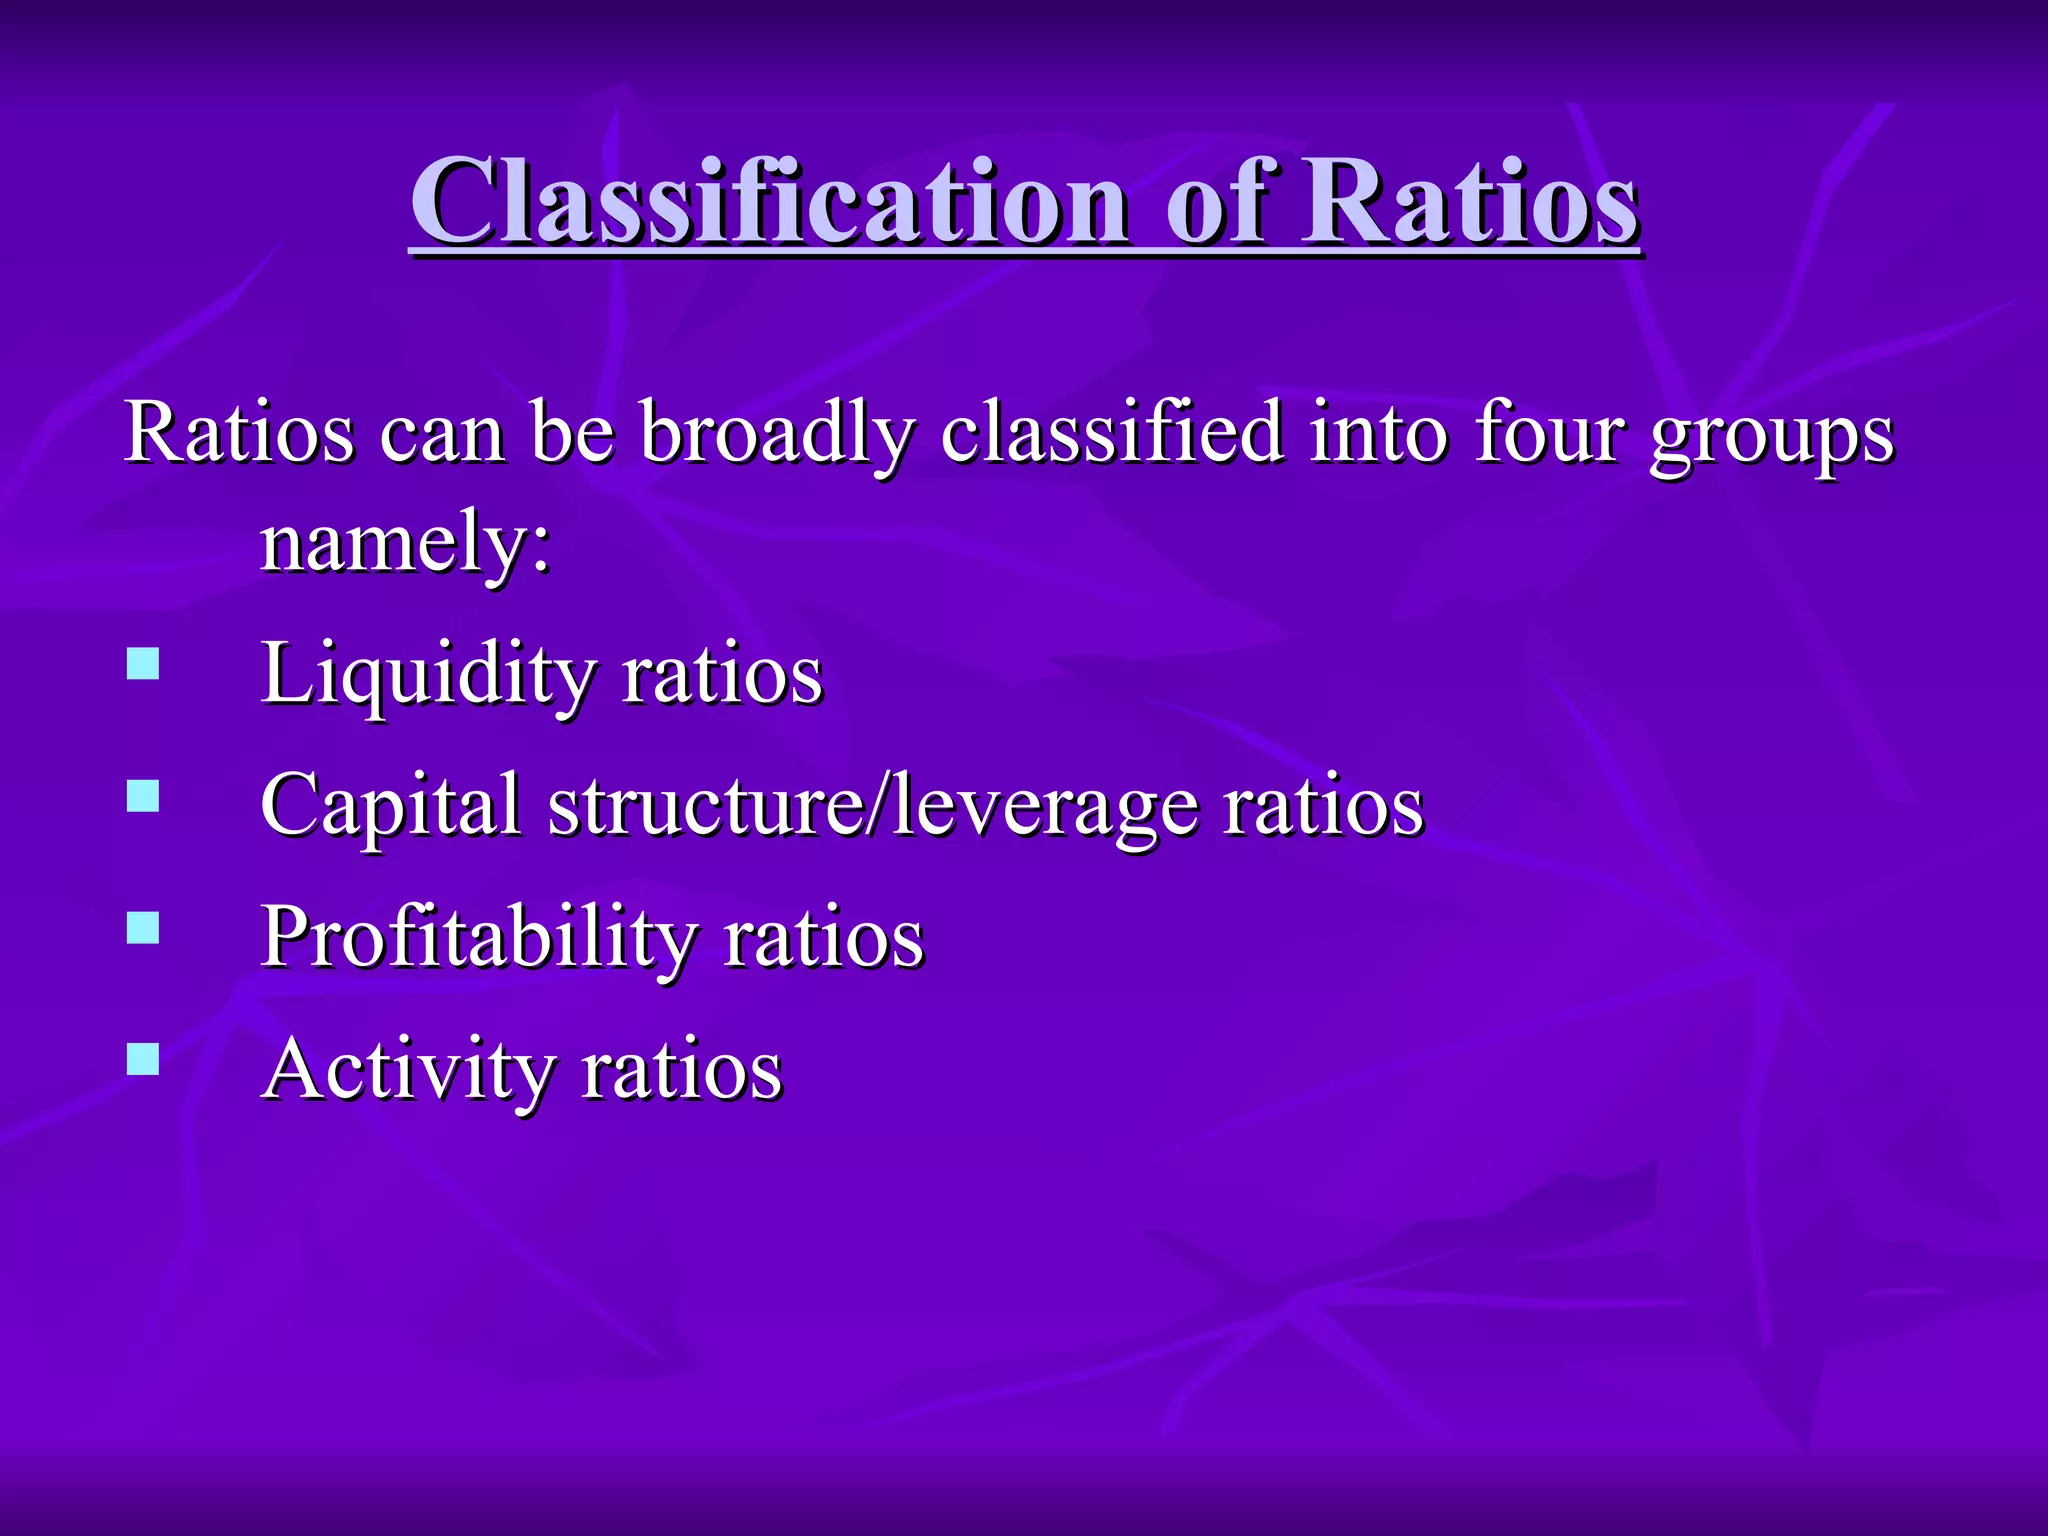


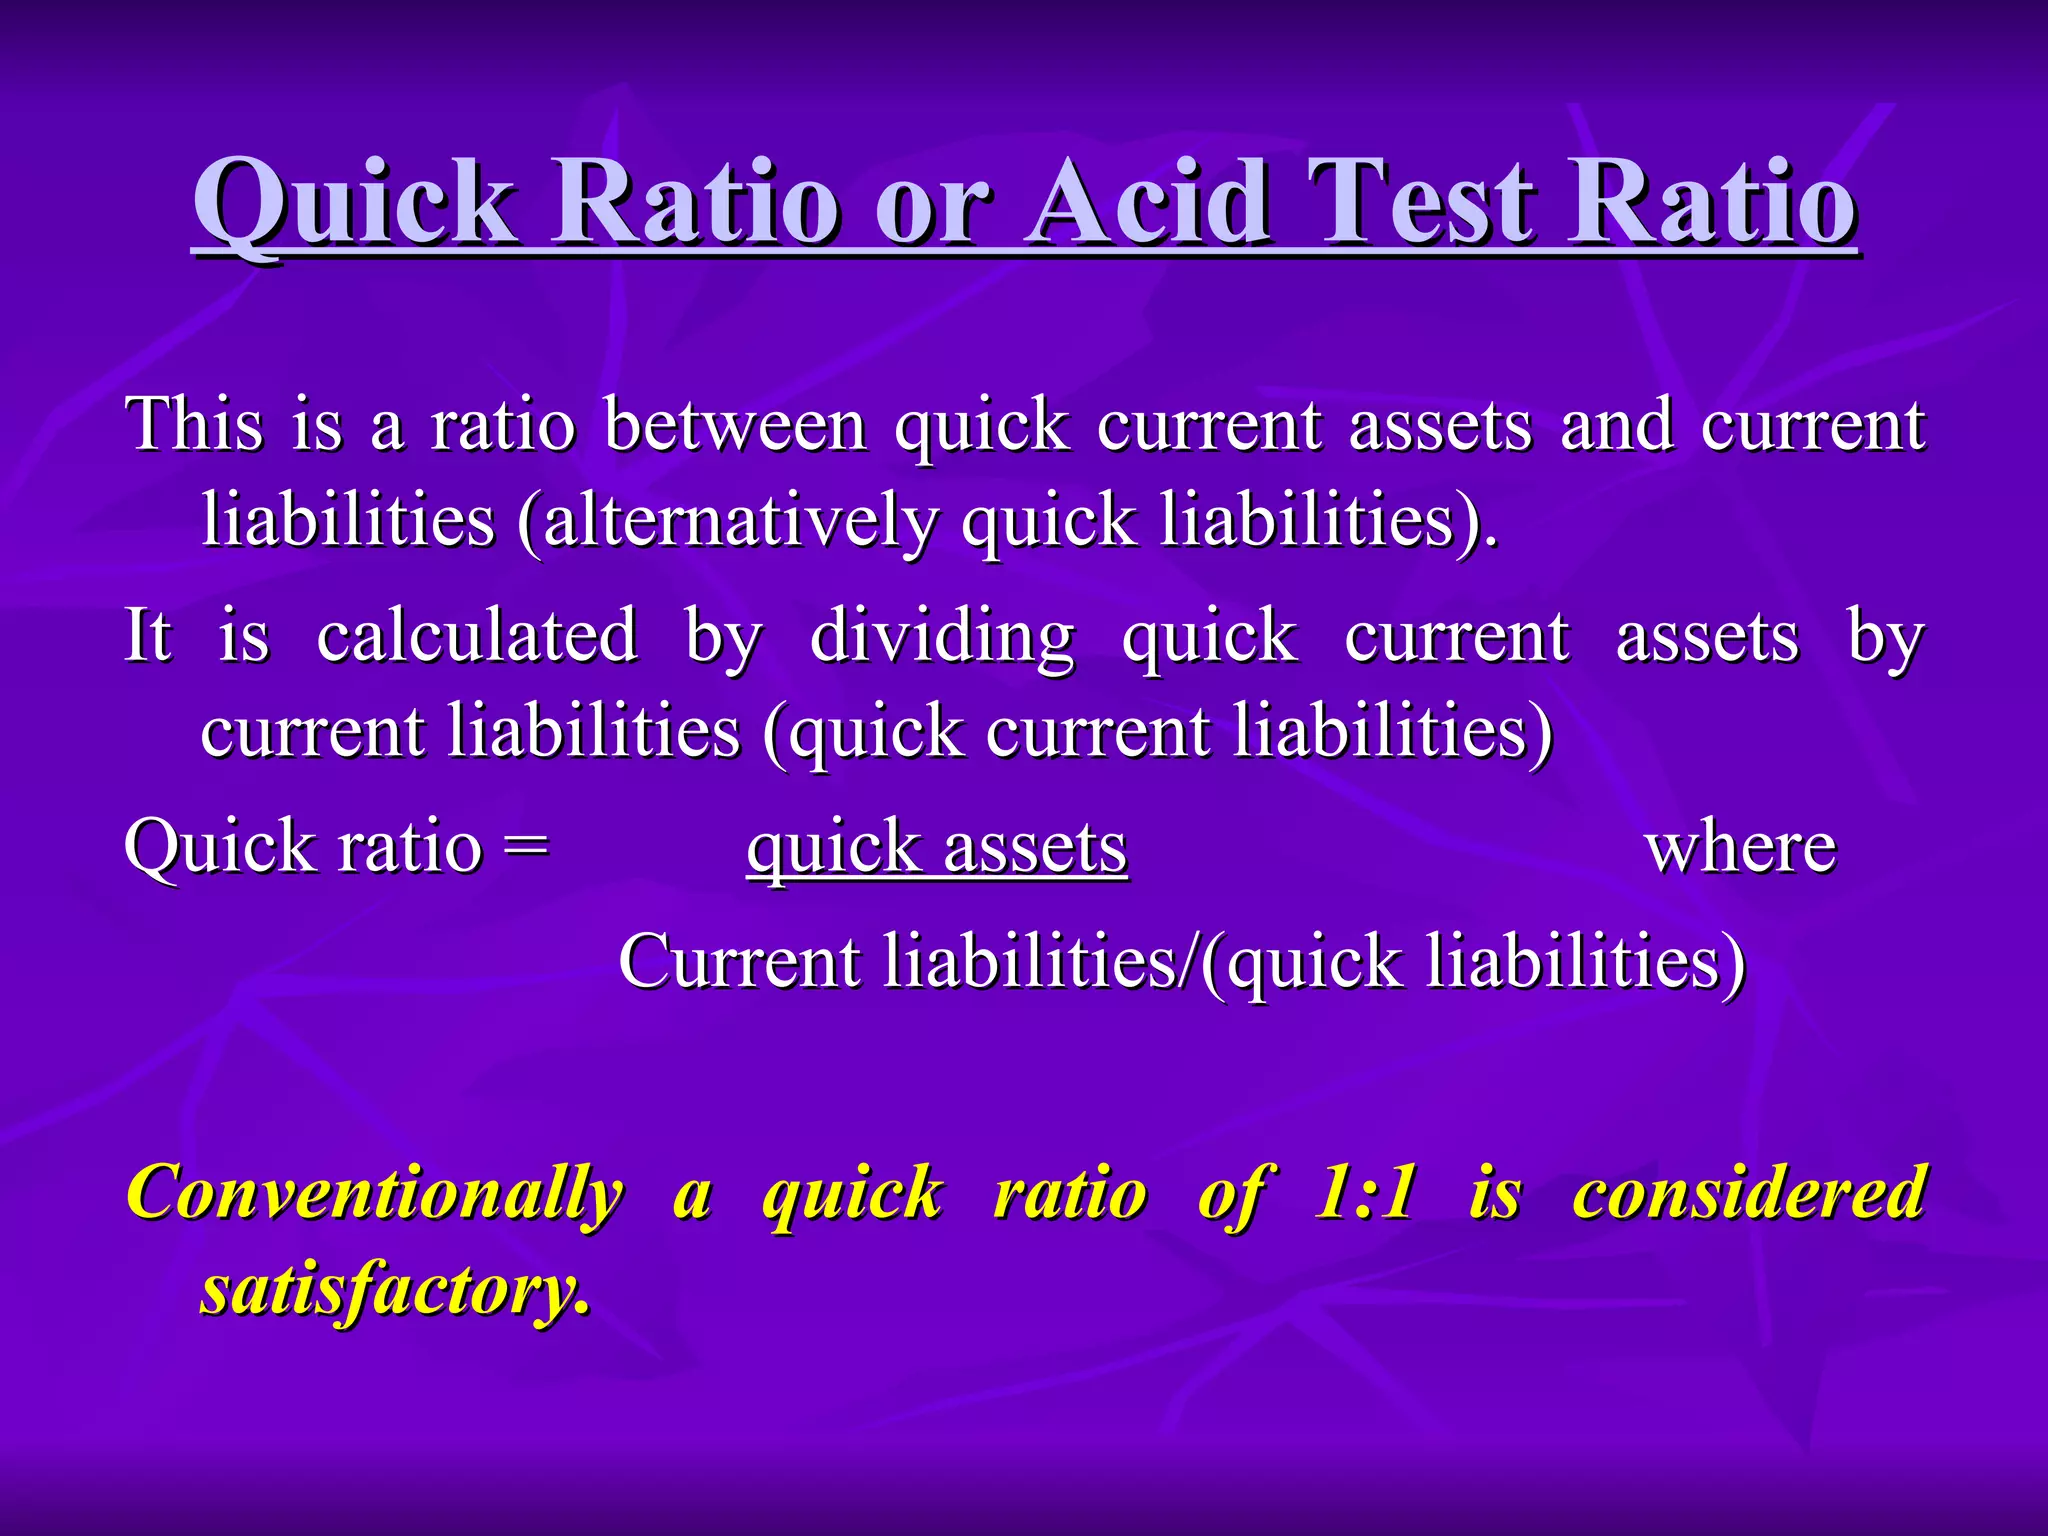


Ratio analysis involves computing relationships between financial statement items to interpret a firm's strengths, weaknesses, historical performance, and current condition. Ratios are classified into liquidity, capital structure, profitability, and activity ratios. Liquidity ratios measure short-term solvency and ability to meet current commitments, such as current and quick ratios. Capital structure ratios indicate long-term solvency and ability to repay debt, like debt-equity and proprietary ratios. Ratios are most informative when compared over time, against industry standards, or between firms.