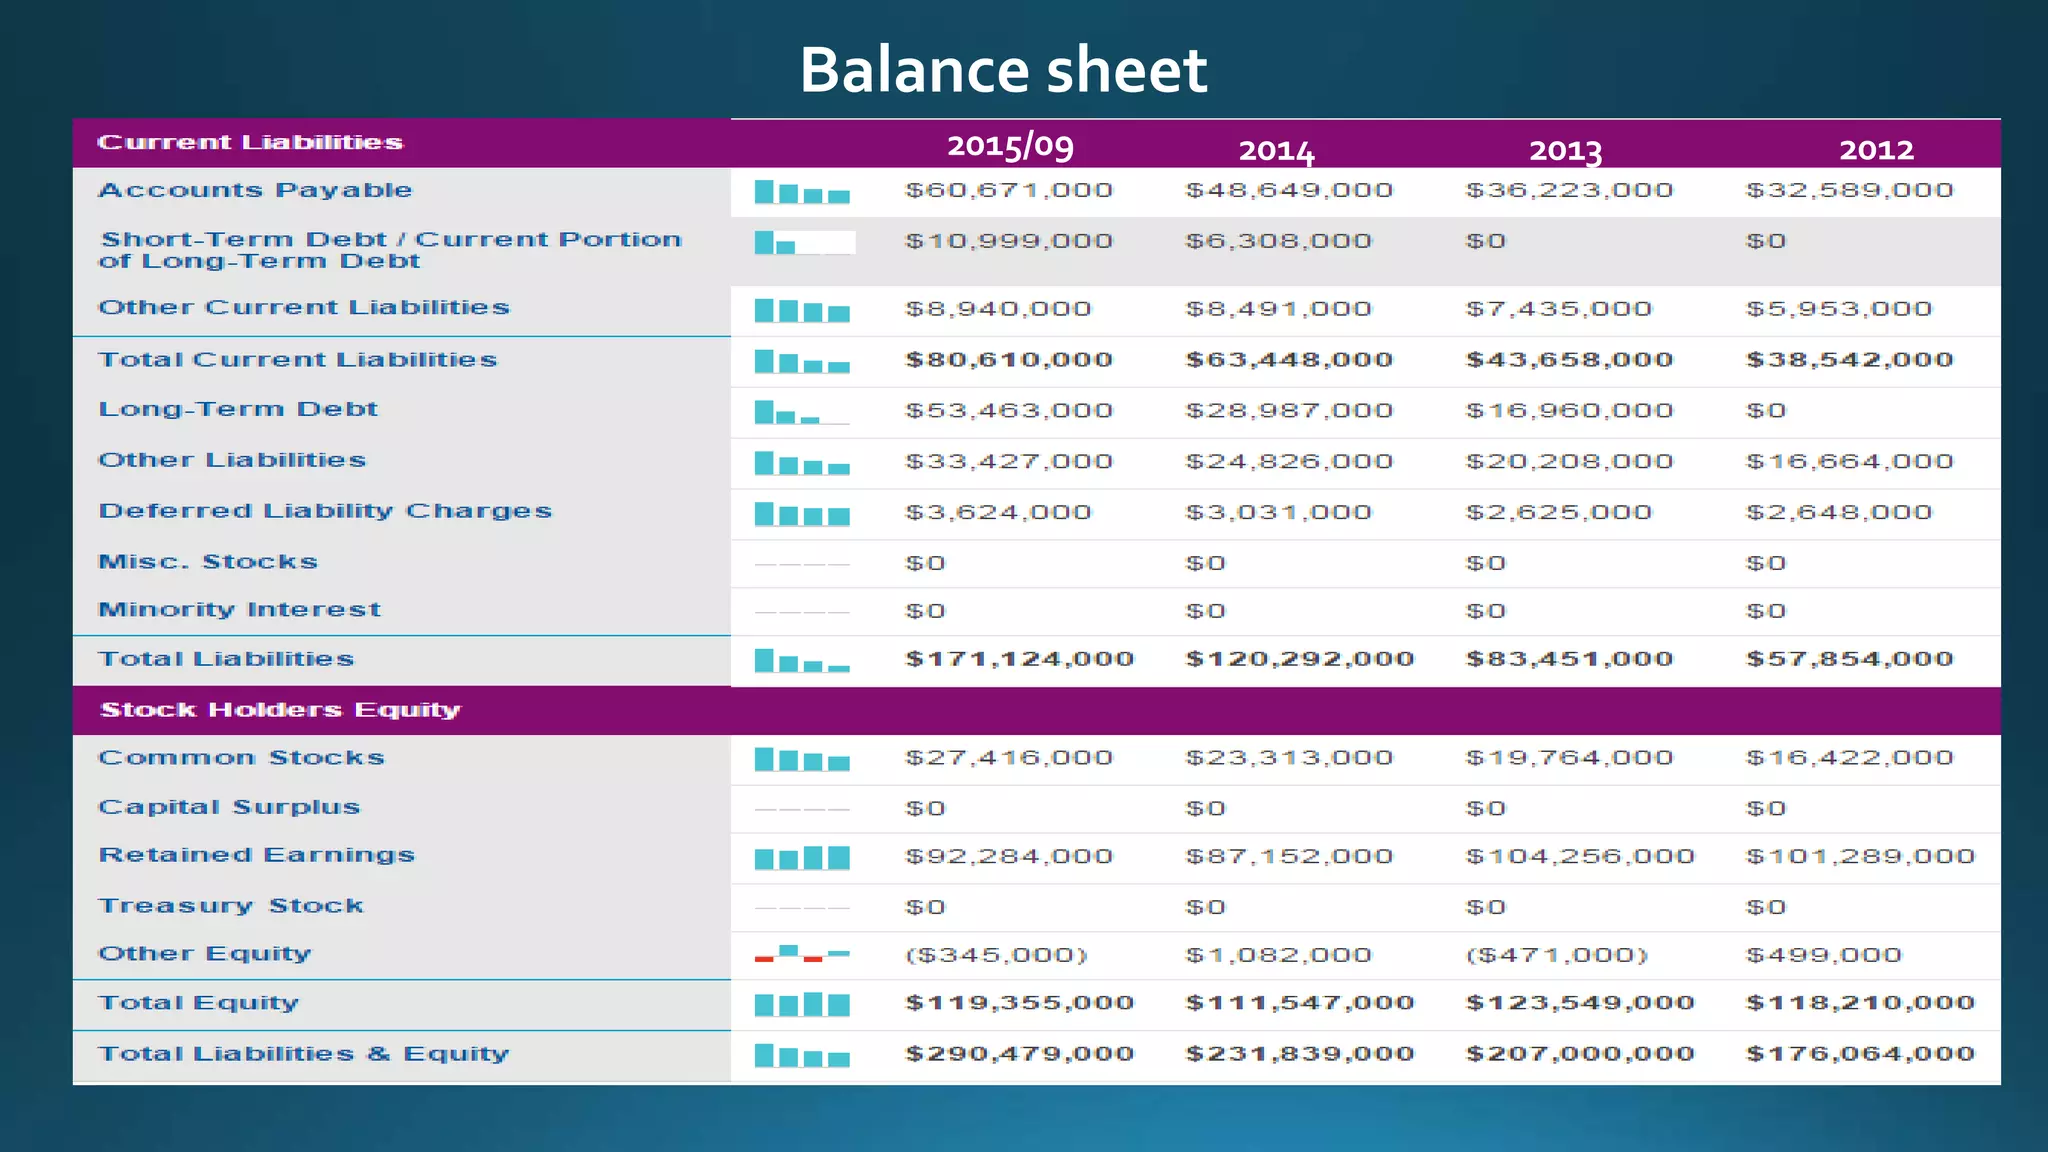
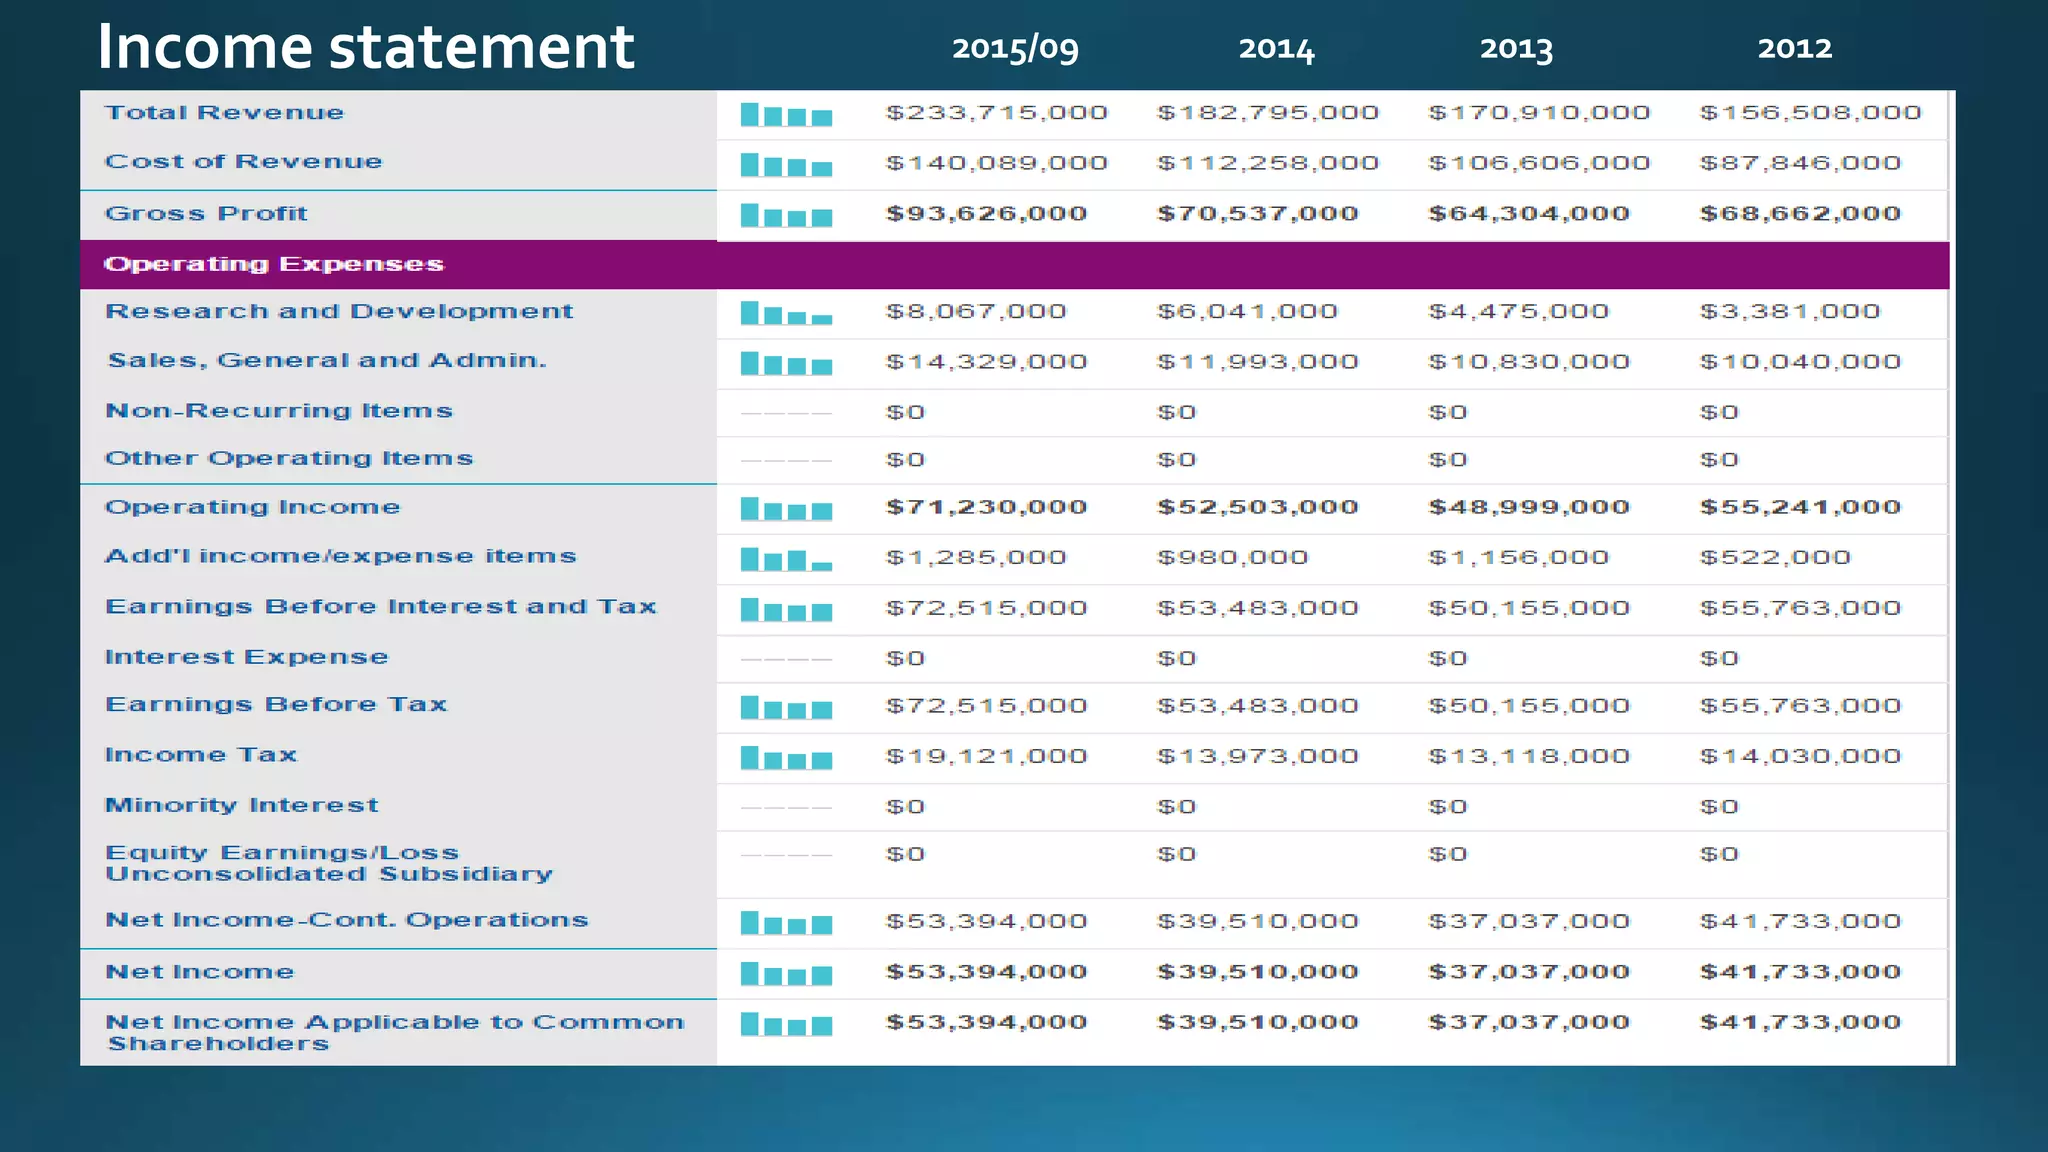
Introduction Financial Statement Ratio Analysis Profitability Analysis Conclusion
2015/09 2014 2013 2012
Balance sheet
2015/09 2014 2013 2012
Balance sheet
2015/09 2014 2013 2012Income statement
2015/09 2014 2013 2012Cash Flow
Ratio
Analysis
Liquidity
Leverage/
Solvency
Turnover/
Activity
Profitability
Current Asset : Current Liabilities
2013 2014
Current Asset 73,286,000 68,531,000
Current Liabilities 43,658,000 63,448,000
Current Ratio 1.67 1.08
Here, it shows that the firm has 1.08 which is not quite satisfactory
and can be improved by better turnover and profit and also by
decreasing liabilities
Apple can pay 108 % of its liability
(cash + short-term marketable securities + accounts
receivable) ÷ current liabilities
2013 2014
Cash & cash equivalents 64,640,000 56,614,000
Current Liabilities 43,658,000 63,448,000
Quick Ratio 1.48 0.89
A quick ratio of 89% means that a company has $0,89 of liquid
assets available to cover each $1 of current liabilities. The higher the
quick ratio, the better the company's liquidity position.
Ability to pay 89 %
(cash + short-term marketable securities )
÷ current liabilities
2013 2014
cash + short-term marketable
securities
40,546,000 25,077,000
current liabilities 43,658,000 63,448,000
Cash Ratio 0.928 0.395
The cash ratio is generally a more conservative look at a
company's ability to cover its liabilities than many
other liquidity ratios.
Apple can pay 39.5% of its current liabilities using cash
2013 2014
Total Liabilities 83,451,000 120,292,000
Total Assets 207,000,000 231,839,000
Debt-to-assets Ratio 0.4031 0.5188
total liabilities ÷ total assets
>0.5 indicates that equity position by Apple is less than 50%
From the above 51,8% of Apple Inc assets have been financed by debt,
Apple Inc in 2014 has a much higher degree of leverage than in 2013.
2013 2014
Total liability 123,549,000 111,391,000
Total equity 163,342,000 168,391,000
Debt-assets Ratio 0.675 0.673
(Total liability :Total equity)
67.3% assets of Apple are financed by equity
Income from operations(EBIT) ÷ interest expenses
2013 2014
EBIT 48,999,000 52,503,000
Interest expenses 0 0
Interest-coverage-ratio Ratio 48,999,000 52,503,000
Interest expense is zero.
High ratio, high strength.
cost of goods sold ÷ average inventory
2013 2014
Cost of goods sold 106,606,000 112,258,000
Average inventory 1,277,500 987,500
Inventory Turnover 83.44 57.94
Measures how fast the company turns over its inventory within
a year.
Sales ÷ AverageTotal Assets
2013 2014
Net Sales 170,910,000 182,795,000
Average total assets 191,532,000 219,419,500
Asset-turn-over Ratio 0.8923 0.8330
The AssetTurnover ratio can often be used as an indicator of
the efficiency with which a company is deploying its assets in
generating revenue. Generally speaking, the higher the asset
turnover ratio, the better the company is performing.
Accounting payable ÷ Cost of sales * Days in Period
2013 2014
Accounting payable 36,223,000 48,649,000
Cost of sales * days in period 39,017,796,000 40,974,170,000
Days-accounts-payable Ratio 0.0009283712 0.001187309
Days Accounts Payable indicates the number of days that the
accounts payable relative to cost of goods sold the company
has.
Delays in paying to suppliers .
Net income ÷ Net revenue
2013 2014
Net income 37,037,000 39,510,000
Net revenue 106,606,000 112,258,000
Net-profit-margin 0.347 0.351
35.1% - translates sales into earning.
2013 2014
Net income 37,037,000 39,510,000
Total assets 207,000,000 231,839,000
ROA 0.17 0.15
Net income ÷Total Assets
An indicator of how profitable a company is relative to its total assets. ROA
gives an idea as to how efficient management is at using its assets to
generate earnings.
Assets contribution towards making profit is 15 %
2013 2014
Net income 37,037,000 39,510,000
T.Stockholder’s equity 123,549,000 111,547,000
Roe 0.299 0.354
Net income ÷ total stockholder’s equity
Return on equity measures a corporation's profitability by
revealing how much profit a company generates with the
money shareholders have invested.
Apple Financial Analysis 2013-2014

Apple Financial Analysis 2013-2014

  • 2.
    Introduction Financial StatementRatio Analysis Profitability Analysis Conclusion
  • 7.
    2015/09 2014 20132012 Balance sheet
  • 8.
    2015/09 2014 20132012 Balance sheet
  • 9.
    2015/09 2014 20132012Income statement
  • 10.
    2015/09 2014 20132012Cash Flow
  • 11.
  • 13.
    Current Asset :Current Liabilities 2013 2014 Current Asset 73,286,000 68,531,000 Current Liabilities 43,658,000 63,448,000 Current Ratio 1.67 1.08 Here, it shows that the firm has 1.08 which is not quite satisfactory and can be improved by better turnover and profit and also by decreasing liabilities Apple can pay 108 % of its liability
  • 14.
    (cash + short-termmarketable securities + accounts receivable) ÷ current liabilities 2013 2014 Cash & cash equivalents 64,640,000 56,614,000 Current Liabilities 43,658,000 63,448,000 Quick Ratio 1.48 0.89 A quick ratio of 89% means that a company has $0,89 of liquid assets available to cover each $1 of current liabilities. The higher the quick ratio, the better the company's liquidity position. Ability to pay 89 %
  • 15.
    (cash + short-termmarketable securities ) ÷ current liabilities 2013 2014 cash + short-term marketable securities 40,546,000 25,077,000 current liabilities 43,658,000 63,448,000 Cash Ratio 0.928 0.395 The cash ratio is generally a more conservative look at a company's ability to cover its liabilities than many other liquidity ratios. Apple can pay 39.5% of its current liabilities using cash
  • 17.
    2013 2014 Total Liabilities83,451,000 120,292,000 Total Assets 207,000,000 231,839,000 Debt-to-assets Ratio 0.4031 0.5188 total liabilities ÷ total assets >0.5 indicates that equity position by Apple is less than 50% From the above 51,8% of Apple Inc assets have been financed by debt, Apple Inc in 2014 has a much higher degree of leverage than in 2013.
  • 18.
    2013 2014 Total liability123,549,000 111,391,000 Total equity 163,342,000 168,391,000 Debt-assets Ratio 0.675 0.673 (Total liability :Total equity) 67.3% assets of Apple are financed by equity
  • 19.
    Income from operations(EBIT)÷ interest expenses 2013 2014 EBIT 48,999,000 52,503,000 Interest expenses 0 0 Interest-coverage-ratio Ratio 48,999,000 52,503,000 Interest expense is zero. High ratio, high strength.
  • 21.
    cost of goodssold ÷ average inventory 2013 2014 Cost of goods sold 106,606,000 112,258,000 Average inventory 1,277,500 987,500 Inventory Turnover 83.44 57.94 Measures how fast the company turns over its inventory within a year.
  • 22.
    Sales ÷ AverageTotalAssets 2013 2014 Net Sales 170,910,000 182,795,000 Average total assets 191,532,000 219,419,500 Asset-turn-over Ratio 0.8923 0.8330 The AssetTurnover ratio can often be used as an indicator of the efficiency with which a company is deploying its assets in generating revenue. Generally speaking, the higher the asset turnover ratio, the better the company is performing.
  • 23.
    Accounting payable ÷Cost of sales * Days in Period 2013 2014 Accounting payable 36,223,000 48,649,000 Cost of sales * days in period 39,017,796,000 40,974,170,000 Days-accounts-payable Ratio 0.0009283712 0.001187309 Days Accounts Payable indicates the number of days that the accounts payable relative to cost of goods sold the company has. Delays in paying to suppliers .
  • 25.
    Net income ÷Net revenue 2013 2014 Net income 37,037,000 39,510,000 Net revenue 106,606,000 112,258,000 Net-profit-margin 0.347 0.351 35.1% - translates sales into earning.
  • 27.
    2013 2014 Net income37,037,000 39,510,000 Total assets 207,000,000 231,839,000 ROA 0.17 0.15 Net income ÷Total Assets An indicator of how profitable a company is relative to its total assets. ROA gives an idea as to how efficient management is at using its assets to generate earnings. Assets contribution towards making profit is 15 %
  • 29.
    2013 2014 Net income37,037,000 39,510,000 T.Stockholder’s equity 123,549,000 111,547,000 Roe 0.299 0.354 Net income ÷ total stockholder’s equity Return on equity measures a corporation's profitability by revealing how much profit a company generates with the money shareholders have invested.