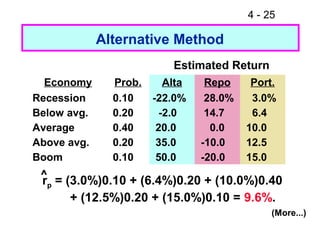
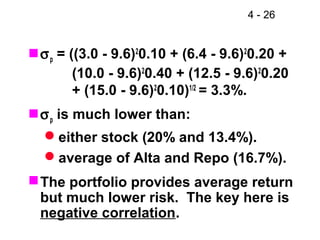
Downloaded 118 times


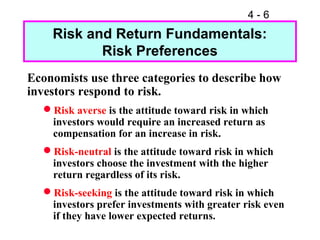
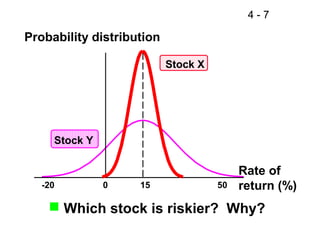
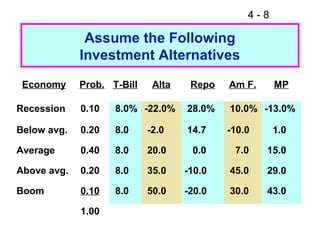


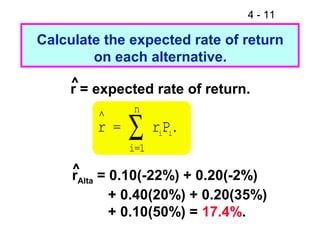
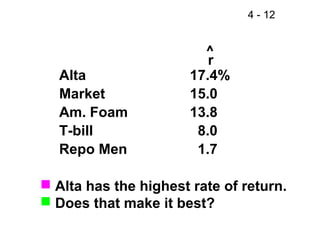

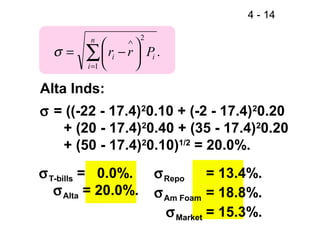
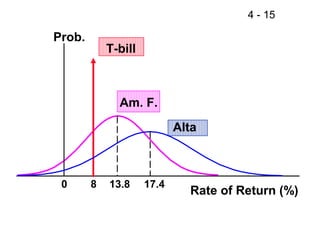
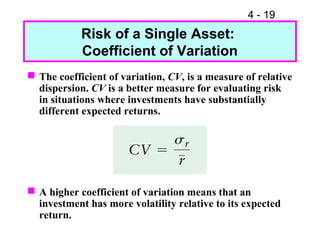
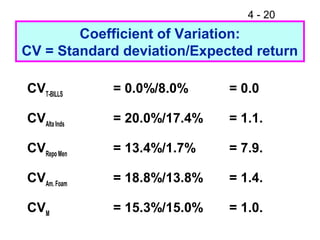
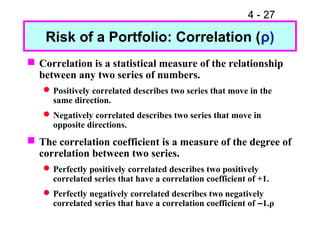
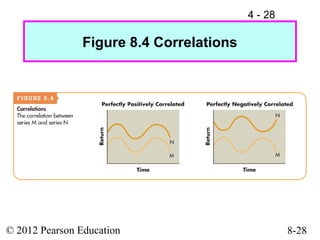


This document discusses key concepts related to risk and return in investments. It defines investment returns, risk, and different types of risk such as stand-alone risk and portfolio (market) risk. It introduces the capital asset pricing model (CAPM) and security market line (SML). The document also discusses risk preferences of investors, measures of risk such as standard deviation and coefficient of variation, and how diversification reduces portfolio risk through low correlations between assets.


