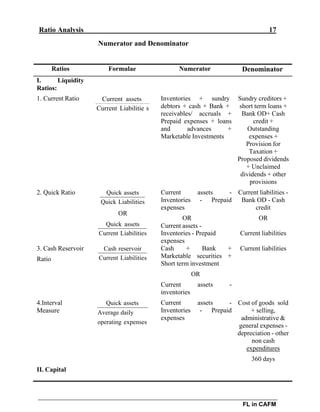
This document discusses ratio analysis and various types of ratios used to analyze a company's financial performance and health. It begins by explaining that ratio analysis compares financial statement figures to provide useful insights beyond absolute numbers. It then covers several categories of ratios:
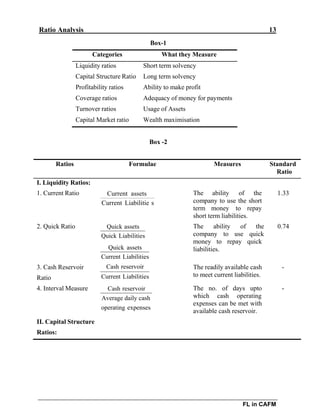
1. Liquidity or short-term solvency ratios measure a firm's ability to pay short-term debts and include the current ratio and quick ratio.
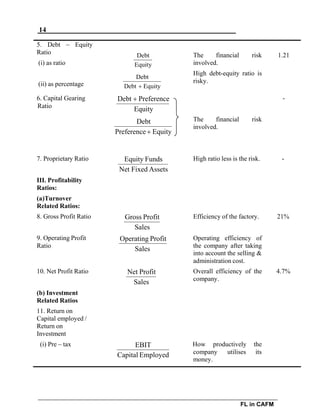
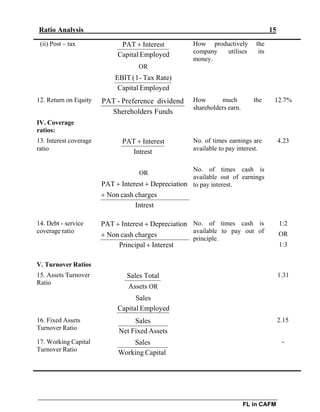
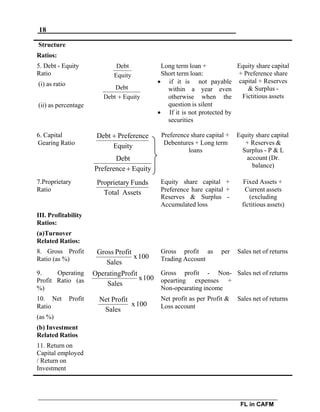
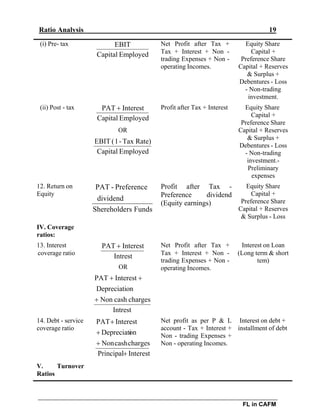
2. Capital structure or long-term solvency ratios assess financial leverage and include the debt ratio and interest coverage ratio.
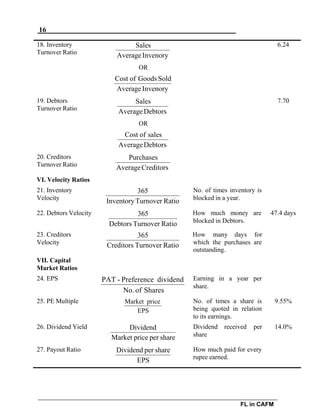
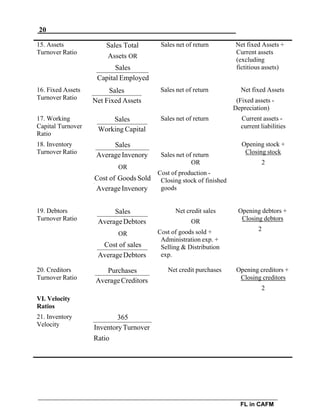
3. Asset management or turnover ratios evaluate efficiency in deploying assets and include total asset turnover, fixed asset turnover, and inventory turnover.
4. Profitability
Investment Valuation Ratios are used by investors to estimate the attractiveness of a potential or existing investment and get an idea of its valuation. Investment valuation ratios compare relevant data that help users gain an estimate of valuation.
Investment Valuation Ratios: Per Share Ratios, Dividend Per Share (DPS), Earnings Per Share (EPS), Dividend Payout Ratio (DPR),
Dividend Yield Ratio, Price / Earnings ratio (PER), Price to Cash Flow, Price to Book Value, Price to Earnings Growth (PEG), Enterprise Value (EV) multiple
Liquidity Ratios are an integral part of financial statement analysis. These are various measures to find or to ascertain the firm’s ability to meet the short term expenses or liabilities and convertibility to liquid assets (for further reading click the link) into cash on requirement. Copy the link given below and paste it in new browser window to get more information on Liquidity Ratio:- http://www.transtutors.com/homework-help/accounting/financial-statement-analysis-liquidity-ratios/
Original article from the Flevy business blog can be found here:
http://flevy.com/blog/whats-the-impact-of-ratios-in-financial-analysis/
Financial statement analysis can be referred as a process of understanding the risk and profitability of a company by analyzing reported financial info, especially annual and quarterly reports. In other words, financial statement analysis is a study about accounting ratios among various items included in the balance sheet.
Advantages of Financial Statement Analysis
The different advantages of financial statement analysis are listed below:
The most important benefit if financial statement analysis is that it provides an idea to the investors about deciding on investing their funds in a particular company.
Another advantage of financial statement analysis is that regulatory authorities can ensure the company following the required accounting standards.
Financial statement analysis is helpful to the government agencies in analyzing the taxation owed to the firm.
Above all, the company is able to analyze its own performance over a specific time period.
From the above, it is obvious that only way for financial analysis is ratio analysis.
What is Ratio analysis?
What is the role/Importance of ratio analysis in financial analysis?
What are its advantages?
How it helps out in decision making?
How it helps the auditor in assessment of the risk of material misstatement?
These are some questions the answer of each must be known by every professional, business man and by user of financial statement. Some of you may already know about these. The answer of these questions must be part of professional’s life and business man must know to keep check on the management progress.
In simple words, we can say that ratio analysis is “quantitative analysis of information contained in a company’s financial statements.” In fact, it is critical quantitative analysis.
Financial analysis for juhayna & domty co . graduation project zagzig uni...Eslam Fathi
Financial Analysis is the process of selecting, evaluating, and identifying the financial
strength and weaknesses of the firm by properly establishing relationship between
items of financial statements. Firms, bank, loan officers and business owners all use
Financial analysis to learn more about a company’s current financial health as well as its
potential.
Ratio analysis advantages and limitations (Complete Chapter)Syed Mahmood Ali
The aim of this PPT's to provide complete knowledge of Ratio Analysis chapter covering all the formula's for any university student of B.com, M.com, BBA and MBA.
The following is Investopedia's Financial Ratios Tutorial (Eng), made into a PPTx for easy use where internet services are limited. The information only covers the formulas presented, but not the whole process of usage, nor the file the site provides.
Also, it comes with a translated (Spa) chart of the most common financial ratios used in Mexican accounting.
This content is property of the original authors and I claim no ownership over it. Hopefully, it will serve as a tool for promoting knowledge and internationalization.
Ratios and Formulas in Customer Financial AnalysisFinancial stat.docxcatheryncouper
Ratios and Formulas in Customer Financial Analysis
Financial statement analysis is a judgmental process. One of the primary objectives is identification of major changes in trends, and relationships and the investigation of the reasons underlying those changes. The judgment process can be improved by experience and the use of analytical tools. Probably the most widely used financial analysis technique is ratio analysis, the analysis of relationships between two or more line items on the financial statement. Financial ratios are usually expressed in percentage or times. Generally, financial ratios are calculated for the purpose of evaluating aspects of a company's operations and fall into the following categories:
· Liquidity ratios measure a firm's ability to meet its current obligations.
· Profitability ratios measure management's ability to control expenses and to earn a return on the resources committed to the business.
· Leverage ratios measure the degree of protection of suppliers of long-term funds and can also aid in judging a firm's ability to raise additional debt and its capacity to pay its liabilities on time.
· Efficiency, activity or turnover ratios provide information about management's ability to control expenses and to earn a return on the resources committed to the business.
A ratio can be computed from any pair of numbers. Given the large quantity of variables included in financial statements, a very long list of meaningful ratios can be derived. A standard list of ratios or standard computation of them does not exist. The following ratio presentation includes ratios that are most often used when evaluating the credit worthiness of a customer. Ratio analysis becomes a very personal or company driven procedure. Analysts are drawn to and use the ones they are comfortable with and understand.
1. Liquidity Ratios
Working Capital
Working capital compares current assets to current liabilities, and serves as the liquid reserve available to satisfy contingencies and uncertainties. A high working capital balance is mandated if the entity is unable to borrow on short notice. The ratio indicates the short-term solvency of a business and in determining if a firm can pay its current liabilities when due.
Formula
Current Assets - Current Liabilities
Acid Test or Quick Ratio
A measurement of the liquidity position of the business. The quick ratio compares the cash plus cash equivalents and accounts receivable to the current liabilities. The primary difference between the current ratio and the quick ratio is the quick ratio does not include inventory and prepaid expenses in the calculation. Consequently, a business's quick ratio will be lower than its current ratio. It is a stringent test of liquidity.
Formula
Cash + Marketable Securities + Accounts Receivable
Current Liabilities
Current Ratio
provides an indication of the liquidity of the business by comparing the amount of current assets to current liabilities. A business's curren ...
Cancer cell metabolism: special Reference to Lactate PathwayAADYARAJPANDEY1
Normal Cell Metabolism:
Cellular respiration describes the series of steps that cells use to break down sugar and other chemicals to get the energy we need to function.
Energy is stored in the bonds of glucose and when glucose is broken down, much of that energy is released.
Cell utilize energy in the form of ATP.
The first step of respiration is called glycolysis. In a series of steps, glycolysis breaks glucose into two smaller molecules - a chemical called pyruvate. A small amount of ATP is formed during this process.
Most healthy cells continue the breakdown in a second process, called the Kreb's cycle. The Kreb's cycle allows cells to “burn” the pyruvates made in glycolysis to get more ATP.
The last step in the breakdown of glucose is called oxidative phosphorylation (Ox-Phos).
It takes place in specialized cell structures called mitochondria. This process produces a large amount of ATP. Importantly, cells need oxygen to complete oxidative phosphorylation.
If a cell completes only glycolysis, only 2 molecules of ATP are made per glucose. However, if the cell completes the entire respiration process (glycolysis - Kreb's - oxidative phosphorylation), about 36 molecules of ATP are created, giving it much more energy to use.
IN CANCER CELL:
Unlike healthy cells that "burn" the entire molecule of sugar to capture a large amount of energy as ATP, cancer cells are wasteful.
Cancer cells only partially break down sugar molecules. They overuse the first step of respiration, glycolysis. They frequently do not complete the second step, oxidative phosphorylation.
This results in only 2 molecules of ATP per each glucose molecule instead of the 36 or so ATPs healthy cells gain. As a result, cancer cells need to use a lot more sugar molecules to get enough energy to survive.
introduction to WARBERG PHENOMENA:
WARBURG EFFECT Usually, cancer cells are highly glycolytic (glucose addiction) and take up more glucose than do normal cells from outside.
Otto Heinrich Warburg (; 8 October 1883 – 1 August 1970) In 1931 was awarded the Nobel Prize in Physiology for his "discovery of the nature and mode of action of the respiratory enzyme.
WARNBURG EFFECT : cancer cells under aerobic (well-oxygenated) conditions to metabolize glucose to lactate (aerobic glycolysis) is known as the Warburg effect. Warburg made the observation that tumor slices consume glucose and secrete lactate at a higher rate than normal tissues.
Earliest Galaxies in the JADES Origins Field: Luminosity Function and Cosmic ...Sérgio Sacani
We characterize the earliest galaxy population in the JADES Origins Field (JOF), the deepest
imaging field observed with JWST. We make use of the ancillary Hubble optical images (5 filters
spanning 0.4−0.9µm) and novel JWST images with 14 filters spanning 0.8−5µm, including 7 mediumband filters, and reaching total exposure times of up to 46 hours per filter. We combine all our data
at > 2.3µm to construct an ultradeep image, reaching as deep as ≈ 31.4 AB mag in the stack and
30.3-31.0 AB mag (5σ, r = 0.1” circular aperture) in individual filters. We measure photometric
redshifts and use robust selection criteria to identify a sample of eight galaxy candidates at redshifts
z = 11.5 − 15. These objects show compact half-light radii of R1/2 ∼ 50 − 200pc, stellar masses of
M⋆ ∼ 107−108M⊙, and star-formation rates of SFR ∼ 0.1−1 M⊙ yr−1
. Our search finds no candidates
at 15 < z < 20, placing upper limits at these redshifts. We develop a forward modeling approach to
infer the properties of the evolving luminosity function without binning in redshift or luminosity that
marginalizes over the photometric redshift uncertainty of our candidate galaxies and incorporates the
impact of non-detections. We find a z = 12 luminosity function in good agreement with prior results,
and that the luminosity function normalization and UV luminosity density decline by a factor of ∼ 2.5
from z = 12 to z = 14. We discuss the possible implications of our results in the context of theoretical
models for evolution of the dark matter halo mass function.
This presentation explores a brief idea about the structural and functional attributes of nucleotides, the structure and function of genetic materials along with the impact of UV rays and pH upon them.
Richard's entangled aventures in wonderlandRichard Gill
Since the loophole-free Bell experiments of 2020 and the Nobel prizes in physics of 2022, critics of Bell's work have retreated to the fortress of super-determinism. Now, super-determinism is a derogatory word - it just means "determinism". Palmer, Hance and Hossenfelder argue that quantum mechanics and determinism are not incompatible, using a sophisticated mathematical construction based on a subtle thinning of allowed states and measurements in quantum mechanics, such that what is left appears to make Bell's argument fail, without altering the empirical predictions of quantum mechanics. I think however that it is a smoke screen, and the slogan "lost in math" comes to my mind. I will discuss some other recent disproofs of Bell's theorem using the language of causality based on causal graphs. Causal thinking is also central to law and justice. I will mention surprising connections to my work on serial killer nurse cases, in particular the Dutch case of Lucia de Berk and the current UK case of Lucy Letby.
This pdf is about the Schizophrenia.
For more details visit on YouTube; @SELF-EXPLANATORY;
https://www.youtube.com/channel/UCAiarMZDNhe1A3Rnpr_WkzA/videos
Thanks...!
1. Ratio
Analysis
Ratio basics
Ratio Analysis compares one figure in one financial
statement (say P&L account or Balance Sheet) with
another figure in the same financial statement or in
another financial statement of the company.
A ratio is expressed in the numerator denominator
format. Thus the numerator and denominator can be
either from the P&L account or the Balance sheet of
the same company.
Ratios give colour to absolute figures. For example a
profit of Rs.100 lakhs means very little to an analyst
because he needs to know what the sales was or what
the networth was against which the Rs.100 lakhs was
earned. More than the profit, the ratio of profit to sales
and the ratio of profit to networth is useful to
understand the performance of a company. Thus if
profit grew from Rs 100 lakhs to Rs 125 lakhs, while
it is good, what is more important is how it stacked up
against the sales achieved or the networth deployed.
1. Ratio basics
2. Computing ratios
Short term solvency
Long term solvency
Asset management
Profitability
Market
3. Interpreting ratios
Common size analysis
Trend analysis
DuPont chart
Limitations
2. 2
FL in CAFM
Hence, ratio analysis facilitates intra firm comparison. i.e. comparison of your
company’s performance in the current year with your company’s performance in the
previous year.
It also facilitates inter firm comparison. i.e. comparison of your company’s
performance in the current year with your competitor’s performance in the current year.
Peer review, as this is called, helps you benchmark your performance with your peers.
Ratios help in ascertaining the financial health of the company and also its future
prospects. These ratios can be classified under various heads to reflect what they
measure. There may be a tendency to work a number of ratios. But we believe that being
thorough in the computation and interpretation of a few ratios (Say 20-25) would be ideal,
since too much of analysis could lead to paralysis.
Computing Ratios
When a ratio has a P&L figure both in the numerator and in the denominator or has a
balance sheet figure both in the numerator and in the denominator it is called a straight
ratio. Where it has the P&L figure in the numerator and the balance sheet figure in the
denominator or the balance sheet figure in the numerator and the P&L figure in the
denominator it is called a cross or hybrid ratio.
A: Liquidity or Short Term Solvency Ratios
Liquidity refers to the speed and ease with which an asset can be converted to cash.
Liquidity has two dimensions: ease of conversion versus loss of value. Remember any
asset can be quickly converted to cash if you slash the price. A house property valued at
Rs 25 lakhs can be converted to cash within 24 hours if you slash the price to Rs 5 lakhs!
So a liquid asset is really one which can be converted to cash without major loss of value.
An illiquid asset is one that cannot be en-cashed without a major slash in price.
Current assets are most liquid. Fixed assets are least liquid. Tangible fixed assets like
land and building and equipment aren’t generally converted to cash at all in normal
business activity. They are used in the business to generate cash. Intangibles such as
trademark have no physical existence and aren’t normally converted to cash.
Liquidity is invaluable. The more liquid a business is, the less is the possibility of it
facing financial troubles.
But too much of liquidity too is not good. That’s because liquidity has a price tag.
Liquid assets are less profitable to hold. Therefore there is a trade off between the
advantages of liquidity and foregone potential profits.
Liquidity or Short term solvency ratios provide information about a firm’s liquidity. The
primary concern is the firm’s ability to pay its bills over the short run without undue
stress. Hence these ratios focus on current assets and current liabilities. These ratios are
particularly useful to the short term lenders.
3. Ratio Analysis 3
FL in CAFM
A major advantage of looking at current assets and current liabilities is that their book
values approximate towards their market values. Often these assets and liabilities do not
live long enough for the two to step out of line.
1. Current Ratio: This is the ratio of current assets to current liabilities.
Current Assets / Current Liabilities
Because current assets are convertible to cash in one year and current liabilities are
payable within one year, the current ratio is an indicator of short term solvency. The unit
of measure is “times”. For instance if the current ratio is 1.4 we say that the ratio is 1.4
times. It means that current assets are 1.4 times the current liabilities.
To a short term lender, including a creditor, a high current ratio is a source of comfort.
To the firm, a high current ratio indicates liquidity, but it also may mean inefficient use of
cash and other current assets. A ratio of 1.33 is considered welcome.
The current radio is affected by various types of transactions. For example suppose the
firm borrows over the long term to raise money. The short term effect would be an
increase in cash and an increase in long term debt. So the current ratio would rise.
Finally, a low current ratio is not necessarily bad for a company which has a large
reservoir of untapped borrowing.
2. Quick or Acid test Ratio: This is the ratio of quick assets to current liabilities or to
quick liabilities.
Quick Assets / Current Liabilities
Quick Assets / Quick Liabilities
Three points merit attention.
a. Inventory: The book values of inventory are least reliable as measures of realisable
value because over time they may become lost, damaged or obsolete. Further, to an
external analyst the market value of inventory may not be available since they are
carried in the books at cost.
Large inventories are often a sign of short-term trouble. The firm may have
overestimated sales and consequently may have overbought or overproduced leading
to a substantial part of the liquidity locked in low moving inventory. Hence inventory
is eliminated from current assets to arrive at quick assets.
b. Prepaid expenses. Prepaid expenses too are deducted from current assets since they
are not really convertible into cash. They are only adjustments against future
payments.
c. Overdraft: In practice, overdraft is not exactly repayable within 12 months because
it is almost always renewed. Therefore there is a view that in computing quick
liabilities we must deduct overdraft from current liabilities.
4. 4
FL in CAFM
3. Cash Reservoir Ratio: Does a company have enough cash or cash equivalents to
meet its current liabilities? The Cash reservoir ratio measures this.
Cash Reservoir / Current Liabilities
Cash Reservoir = Cash + Bank + Marketable securities.
Alternatively, Cash Reservoir = Current Assets – Inventory.
But the former one is more appropriate.
A very short term creditor (one who gives money for say a week or 15 days) should
be interested in this ratio.
B: Capital Structure or Long Term Solvency Ratios
Long term solvency ratios measure the firm’s long term ability to meet its payment
obligations. They are also referred to as leverage ratios. Back in the chapter Capital
Structure Planning you learnt about financial leverage as arising out of the existence of
debt in the capital structure. In Introduction to Financial Management we understood this
as being the first quadrant of the balance sheet.
4. Total debt ratio: This is the ratio of total debt to total assets.
Total Debt / Total assets
The term “total debt” means all debt; both long term and short term i.e. it includes current
liabilities. The term “total assets” means all assets; both fixed assets and current assets.
There are two variants to this ratio namely debt-equity ratio and equity multiplier.
a. The debt equity ratio is measured as total debt to total equity.
b. The equity multiplier is the ratio of total assets to total equity
The equity multiplier is 1 plus debt equity ratio. Given any one of these three ratios, you
can immediately compute the other two so they all say the same thing.
5. Times interest earned (Interest coverage ratio): This is the ratio of EBIT to
Interest.
EBIT / Interest
The interest referred to here is the interest on both long term and short term loan. The
ratio measures how much earnings are available to cover interest obligations. If coverage
is computed only for long term interest then only long term interest should be considered
in the denominator and the EBIT will mean earnings before long term interest and taxes.
There are various variants to the above ratio. For instance, there is a view that the earning
should be recorded after tax i.e. earnings before interest but after tax. And that the
denominator will be unchanged at Interest. However we have stuck to the more
traditional and more popular view.
5. Ratio Analysis 5
FL in CAFM
6. Cash coverage: This is the ratio of ‘EBIT plus depreciation’ to Interest.
(EBIT + Depreciation ) / Interest
Need to compute cash cover
While interest is a cash measure, EBIT is not.
That’s because it has taken into account
depreciation which is a non-cash charge.
This ratio is considered as a measure of the firm’s ability to generate cash from operations
and is used as a measure of cash flow available to meet financial obligations.
C: Asset Management or Turnover Ratios
The Asset management ratios (a k a Asset turnover ratios) measure the efficiency with
which a company deploys its assets to generate sales.
7. Total Assets turnover ratio: This is the ratio of sales to total assets.
Sales / Total Assets
While “total assets” is technically more correct, average assets could also be used.
Average asset is the simple average of opening and closing assets.
If the total assets turnover ratio is 4, it means that for every rupee invested we have
generated Rs.4 of sales. The term total assets would be the sum of fixed assets and
current assets.
The higher the ratio the better it is for the company.
The reciprocal of the total assets turnover ratio is the “Capital Intensity ratio”. It can be
interpreted as the rupee invested in assets needed to generate Re.1 of sales. High values
correspond to capital intensive industries.
1 / Total assets turnover ratio
The total assets turnover ratio can be split into FATO and WCTO ratio.
8. Fixed Assets turnover ratio (FATO): This is the ratio of sales to fixed assets.
The fixed assets should typically be on net basis i.e. net of accumulated depreciation.
Sales / Net fixed assets
Average fixed assets i.e. the simple average of opening and closing fixed assets can also
be used.
If the fixed assets turnover ratio is 3, it means that for every rupee invested in fixed assets
we have generated Rs.3 of sales.
The higher the ratio the better it is for the company.
6. 6
FL in CAFM
9. Working capital turnover ratio (WCTO): This is the ratio of sales to net
working capital. Net working capital would mean current assets less current liabilities.
Sales / Net Working Capital
Average working capital i.e. the simple average of opening and closing working capital
can also be used.
If the working capital turnover ratio is 6, it means that for every rupee invested in
working capital we have generated Rs.6 of sales.
The higher the ratio the better it is for the company.
This ratio becomes more understandable if we convert it into number of days. If we
turned over our working capital 6 times a year, it means that the working capital was
unlocked every 60 days. This is called the working capital days’ ratio and is given by
the following formula:
365 / Working capital turnover ratio
The lower this ratio, the better it is for the company.
The working capital turnover ratio can now be broken into its component parts.
10. Inventory turnover ratio: This is the ratio of cost of goods sold to closing
inventory.
Cost of goods sold / Inventory
It can also be expressed as the ratio of cost of goods sold to average inventory. While
closing inventory is technically more correct, average inventory could be used since an
external analyst is unsure whether the year end numbers are dressed up.
The numerator is “Cost of goods sold” and not sales because inventory is valued at cost.
However to use “Sales” in the numerator is also a practice that many adopt.
If the inventory turnover ratio is 3, it means that we sold off the entire inventory thrice.
As long as we are not running out of stock and hence losing sales, the higher this ratio is,
the more efficient is the management of inventory.
If we turned over inventory over 3 times during the year, then we can say that we held
inventory for approximately 121 days before selling it. This is called the average days’
sales in Inventory and is given by the following formula:
365 / Inventory turnover ratio
The ratio measures how fast we sold our products. Note that inventory turnover ratio and
average days’ sales in inventory measure the same thing.
11. Receivable / Debtors turnover ratio: This is the ratio of sales to closing debtors.
Sales / Debtors
7. Ratio Analysis 7
FL in CAFM
While closing debtors is technically more correct, average debtors could be used since an
external analyst is unsure whether the year end numbers are dressed up.
If the debtors’ turnover ratio is 8, it means that we collected our outstanding 8 times a
year. As long as we do not miss out sales, the higher this ratio is, the more efficient is the
management of debtors.
This ratio is far easier to grasp if we converted it into number of days. If we turned over
debtors 8 times a year, we can say that debtors on an average were 45 days. This is called
the average days’ sales in receivable and is given by the following formula:
365 / Receivable turnover ratio
The ratio is often called the Average Collection period.
12. Payables / Creditors turnover ratio: In so far as we wanted to know how well
we used our debtors we must also know how well we utilise the creditors. Towards this
we compute the Creditors turnover ratio which is the ratio of purchases to closing
creditors.
Credit Purchases / Creditors
Average creditors could also be used since an external analyst is unsure whether the year
end numbers are dressed up.
If the creditors’ turnover ratio is 5, it means that we paid our outstanding 5 times a year.
As long as we do not miss out purchases, the smaller this ratio is, the more efficient is the
management of creditors.
This ratio becomes more understandable if we convert it into number of days. If we
turned over creditors 5 times a year, we can say that creditors on an average were 73
days. This is called the average days’ purchases in payables and is given by the
following formula:
365 / Creditors turnover ratio
The ratio is often called the Average Payment period.
D: Profitability Ratios
The profitability ratios measure how efficiently a company manages it assets and how
efficiently it manages its operation. The focus is on profits. All of these ratios are
expressed in terms of a percentage.
13. Gross profit margin: This is the ratio of gross profit to sales.
Gross Profit / Sales
The term gross profit refers to the difference between sales and works cost.
Higher the percentage the better it is for the company.
8. 8
FL in CAFM
14. Operating profit margin: This is the ratio of operating profit to sales.
Operating Profit / Sales
The term operating profit is the difference between gross profit and administration and
selling overheads. Non operating income and expenses are excluded. Interest expenditure
is also excluded because interest is the reward for a particular form of financing and has
nothing to do with operational excellence.
Higher the percentage the better it is for the company.
15. Net profit margin: This is the ratio of net profit to sales.
Net Profit / Sales
The term net profit refers to the final profit of the company. It takes into account all
incomes and all expenses including interest costs.
Higher the percentage the better it is for the company.
16. Return on total assets: This is the ratio of EBIT to Total Assets.
EBIT / Total Assets
The term “total assets” refers to all assets namely net fixed assets and current assets.
Higher the percentage the better it is for the company.
17. Return on capital employed (ROCE): This is the more popular ratio and is the
ratio of EBIT to capital employed
EBIT / Capital employed
The term “capital employed” refers to the sum of net fixed assets and net working capital.
This ratio measures the productivity of money.
Higher the percentage the better it is for the company.
18. Return on net-worth: This is the ratio of PAT to Net worth.
PAT / Net worth
The term “Net-worth” means money belonging to equity share holders and includes
reserves net of fictitious assets awaiting write off. It measures how much income a firm
generates for each rupee stockholders have invested.
Higher the percentage the better it is for the company.
E: Market Ratios
As these ratios are based on the market price they become crucial numbers to analyse a
company.
9. Ratio Analysis 9
FL in CAFM
19. Earnings per share: This is the ratio of profit after tax and preference dividends to
number of equity shares outstanding.
(Profit after tax – Preference dividend) / No. of equity shares outstanding
This measures the amount of money available per share to equity shareholders.
The EPS has to be used with care. Two companies raising identical amounts of money
and making identical after tax profits can report substantially different EPS.
Consider this example. A Ltd. raises Rs.100 lakhs of equity with each share having a
face value of Rs.10. The premium on issue is Rs.90 implying that 1,00,000 shares are
raised. In accounting speak, Rs.10 lakhs goes to equity account and Rs.90 lakhs goes to
share premium account. Suppose the company makes a profit after tax of Rs.50 lakhs.
Since there are 1 lakhs shares outstanding the EPS is Rs.50. The return on net-worth is
50%.
Now B Ltd. raises Rs.100 lakhs of equity with each share having a face value of Rs.10.
The premium on issue is Rs.40 implying that 2,00,000 shares are raised. In accounting
speak, Rs.20 lakhs goes to equity account and Rs.80 lakhs goes to share premium
account. Suppose the company makes a profit after tax of Rs.50 lakhs. Since there are 2
lakhs shares outstanding the EPS is Rs.25. The return on net-worth is 50%.
Both companies have the same RONW, the same face value per share, but the first
company returns an EPS of Rs.50 and the second an EPS of Rs.25
20. Payout and retention ratio: The payout ratio is the ratio of dividend per share to
earnings per share.
Dividend per share / EPS
Retention ratio is 1 - Payout ratio.
21. Price Earnings ratio: This is the ratio of market price per equity share to earning
per share. Also known as the PE multiple, the following is the formula:
Market price per share / Earnings per share.
Suppose the PEM is 12. Typically, this means that if all earnings are distributed as
dividends then it would take the investor 12 long years before he recovers his initial
investment. If that be so, why do investors invest in companies with high PEM? Reason:
Investors expect the company’s earnings to grow. The PEM can hence be looked upon as
an investor’s confidence in the growth prospects of the company.
22. Market to book ratio: This is the ratio of market price per equity share to book
value per equity share. The following is the formula:
Market price per share / Book value per share.
10. 10
FL in CAFM
Book value refers to net-worth. Since book value is an accounting number it reflects
historical costs. If the value is less than 1 it means that the firm has not been successful
overall in creating value for the shareholders.
Interpreting Ratios
We would like to compare the performance of one company with another (Peer review).
If we do that we could immediately run into a problem. For instance, if you wanted to
compare Infosys with Satyam you will have to reckon with the fact that Infosys is by far a
much larger company. It is difficult to even compare Infosys 2002 with Infosys 2007 as
the company’s size would have changed. If you compare Infosys with Microsoft, you
have both a size problem (Infosys is a pigmy compared to Microsoft) and a currency
problem (Infosys reports in Rs. and Microsoft reports in dollars). The solution lies in
standardising the financial statements and this is done by converting all the items from
Rs. to percentages. Such statements are called common size statements.
Common Size Balance sheet: All items in the Balance sheet are expressed as a
percentage of total assets.
Common size Income statement: All items in the Profit and Loss account are expressed
as a percentage of total sales. This statement tells us what happens to each Rupee of
sales.
Trend Analysis: One could fall back on the past. Like, take a look at the ratios across
the last five years to understand whether liquidity, solvency, profitability etc. have gone
up or come down. This is at the heart of inter-firm comparison.
Peer Review: The benchmark could be the industry leader or some company in the
industry which your company wants to catch up with. By comparing your ratios with the
benchmark company, you understand whether you are performing better than the
benchmark company or not.
What is most important in the case of ratio analysis is that not all ratios would indicate
things in the same direction. Some would be healthy; others wouldn’t be all that healthy.
It takes practice and experience to ascertain trend and interpret. In other words you need
to become a good financial doctor. It is hence important that one becomes thorough in
the computation, understanding and interpretation of a few select ratios than in trying to
crack them all. Ratio Analysis is more an art than a science.
Limitations
1. The RONW is a sacred ratio. But imagine a year when the company decides to write
off a major part of its manufacturing facility. Both PAT and Net worth will come
down by identical amounts thereby increasing the ratio!
2. Then there is the issue of book value. Book value is dangerously susceptible to
accounting jugglery and pyro-techniques.
11. Ratio Analysis 11
FL in CAFM
3. There is very little theory to help us identify which ratios to look at and to guide us in
establishing benchmarks.
4. Very little theory is available to suggest what constitutes a high ratio or a low ratio.
5. Different firms use different accounting procedure. Like valuation of inventory.
6. Different firms end their fiscal year at different times.
7. Trouble with ratios: Different people compute a ratio differently leading to
confusion. The specific definitions we use must be spelt out. Those which we are
using in this book are the popular usage. When you use ratios to do peer review
make sure that the ratios in the two companies are computed in the same way.
The DuPont Identity
Ratios by themselves mean precious little. If you can understand the link between ratios
and how some ratios can be decomposed to identify the underlying linkages your
appreciation of financial statements and corporate performance will be total. The DuPont
Company used to do just that. We present below a few famous DuPont identities.
1. Return on Equity
The Return on Assets or its cousin the Return on Capital Employed talks about the
productivity of money. The Return on Equity is generally higher than the Return on
Capital Employed. This is on account of the use of debt financing. For instance, if the
ROCE is 15%, it means that both debt money and equity money are earning 15%. Now,
if debt is rewarded at 8%, it means that the surplus or balance 7% accrues to the equity
shareholders. If the debt equity ratio is 1:1 the Return on equity will turn out to be the
15% it earns plus the 7% surplus that it pockets from debt namely 22%.
Return on Equity is decomposed as under:
ROE = PAT/Net-worth
= PAT / Net-worth x Assets / Assets
= PAT / Assets x Assets / Net-worth
= PAT / Assets x Equity Multiplier
ROE = ROA x (1+Debt-Equity ratio)
2. Return on Equity
A second decomposition works as under:
ROE = PAT / Net-worth
= PAT / Net-worth x Assets / Assets
= PAT / Assets x Assets / Net-worth
= PAT / Assets x Sales / Sales x Assets / Net-worth
= Pat / Sales x Sales / Assets x Assets / Net-worth
12. 12
FL in CAFM
akes additional debt financing
reases the retention ratio. This
the SGR.
ROE = Profit Margin x TATO x Equity multiplier
The ROE is thus the function of operating efficiency (as measured by profit margin),
Asset use efficiency (as measure by total asset turnover) and financial leverage (as
measured by equity multiplier.
ROA, ROE and Growth
Is it possible to know how rapidly a firm can grow! We must remember that over the
long haul, if sales have to grow assets too have to grow because there is only so much that
you can milk out of an asset. If assets are to grow the firm must find money to fund these
purchases. The money can come either from internal sources (retention) or external
sources (debt or fresh equity).
Internal growth rate: If a company does not want to tap external sources of financing
and uses only retained earnings to fund new assets, the rate at which sales can grow is
given by the following formula:
ROA x b
Internal growth rate =
1 ROA x b
Sustainable growth rate (SGR): If a firm relies only on internal financing, over time,
the debt equity ratio will decline. Many companies would like to maintain a target debt
equity ratio. With this in mind we now lay down the sustainable growth rate on the twin
assumptions that (a) company wishes to maintain a target debt-equity ratio and (b) it is
unwilling to raise fresh equity. Given these assumptions the maximum growth rate will be
ROE x b
Sustainable growth rate =
1 ROE x b
Piecing all these together, we now identify the four drivers of sales growth.
1. Profit margin: If the profit margin increases, the internal resources go up. This
increases the SGR.
2. TATO: An increase in TATO increases the sales per rupee of investment. This
decreases the firm’s need for new assets as sales grow and thus increases the
sustainable growth rate.
3. Financial policy: An increase in the debt equity ratio
m available, thus increasing the SGR.
4. `Dividend policy: A reduction in dividend payout inc
increases internally generated funds and thus increases
If SGR is to
Profit margin
TATO
Debt Equity Ratio
DP
13. Ratio Analysis 13
FL in CAFM
Box-1
Categories What they Measure
Liquidity ratios Short term solvency
Capital Structure Ratio Long term solvency
Profitability ratios Ability to make profit
Coverage ratios Adequacy of money for payments
Turnover ratios Usage of Assets
Capital Market ratio Wealth maximisation
Box -2
Ratios Formulae Measures Standard
Ratio
I. Liquidity Ratios:
1. Current Ratio Current assets The ability of the 1.33
Current Liabilitie s company to use the short
term money to repay
short term liabilities.
2. Quick Ratio Quick assets
Quick Liabilities
The ability of the
company to use quick
money to repay quick
0.74
Quick assets liabilities.
3. Cash Reservoir
Ratio
4. Interval Measure
II. Capital Structure
Ratios:
Current Liabilities
Cash reservoir
Current Liabilities
Cash reservoir
Average daily cash
operating expenses
The readily available cash -
to meet current liabilities.
The no. of days upto -
which cash operating
expenses can be met with
available cash reservoir.
14. 14
FL in CAFM
5. Debt – Equity
Ratio
(i) as ratio
(ii) as percentage
6. Capital Gearing
Debt
Equity
Debt
Debt Equity
Debt Preference
The financial risk
involved.
High debt-equity ratio is
risky.
1.21
-
Ratio
Equity
Debt
Preference Equity
The financial risk
involved.
7. Proprietary Ratio
III. Profitability
Ratios:
(a)Turnover
Related Ratios:
8. Gross Profit Ratio
9. Operating Profit
Equity Funds
Net Fixed Assets
Gross Profit
Sales
Operating Profit
High ratio less is the risk. -
Efficiency of the factory. 21%
Operating efficiency of
Ratio
Sales the company after taking
into account the selling &
administration cost.
10. Net Profit Ratio
(b) Investment
Related Ratios
11. Return on
Capital employed /
Return on
Investment
Net Profit
Sales
Overall efficiency of the
company.
4.7%
(i) Pre – tax EBIT How productively the
Capital Employed company utilises its
money.
15. Ratio Analysis 15
FL in CAFM
(ii) Post – tax PAT Interest
Capital Employed
OR
EBIT (1- Tax Rate)
Capital Employed
How productively the
company utilises its
money.
12. Return on Equity PAT - Preference dividend How much the 12.7%
IV. Coverage
ratios:
13. Interest coverage
Shereholders Funds
PAT Interest
shareholders earn.
No. of times earnings are 4.23
ratio
Intrest
OR
PAT Interest Depreciation
Non cash charges
Intrest
available to pay interest.
No. of times cash is
available out of earnings
to pay interest.
14. Debt - service
coverage ratio
PAT Interest Depreciation
Non cash charges
Principal Interest
No. of times cash is
available to pay out of
principle.
1:2
OR
1:3
V. Turnover Ratios
15. Assets Turnover
Ratio
Sales Total
Assets OR
Sales
Capital Employed
1.31
16. Fixed Assets
Turnover Ratio
17. Working Capital
Turnover Ratio
Sales 2.15
Net Fixed Assets
Sales -
Working Capital
16. 16
FL in CAFM
18. Inventory
Turnover Ratio
19. Debtors
Turnover Ratio
20. Creditors
Turnover Ratio
VI. Velocity Ratios
21. Inventory
Sales
AverageInvenory
OR
Cost of Goods Sold
AverageInvenory
Sales
AverageDebtors
OR
Cost of sales
AverageDebtors
Purchases
AverageCreditors
365 No. of times inventory is
6.24
7.70
Velocity
InventoryTurnover Ratio blocked in a year.
22. Debtors Velocity 365 How much money are 47.4 days
Debtors Turnover Ratio blocked in Debtors.
23. Creditors 365 How many days for
Velocity
VII. Capital
Market Ratios
Creditors Turnover Ratio which the purchases are
outstanding.
24. EPS PAT - Preference dividend Earning in a year per
No. of Shares
share.
25. PE Multiple Market price No. of times a share is 9.55%
EPS being quoted in relation
to its earnings.
26. Dividend Yield Dividend Dividend received per 14.0%
27. Payout Ratio
Market price per share
Dividend per share
EPS
share
How much paid for every
rupee earned.
17. Ratio Analysis 17
FL in CAFM
Numerator and Denominator
Ratios Formulae Numerator Denominator
I. Liquidity
Ratios:
1. Current Ratio Current assets Inventories + sundry Sundry creditors +
Current Liabilitie s debtors + cash + Bank +
receivables/ accruals +
Prepaid expenses + loans
and advances +
Marketable Investments
short term loans +
Bank OD+ Cash
credit +
Outstanding
expenses +
Provision for
Taxation +
Proposed dividends
+ Unclaimed
dividends + other
provisions
2. Quick Ratio Quick assets
Quick Liabilities
OR
Current assets -
Inventories - Prepaid
expenses
OR
Current liabilities -
Bank OD - Cash
credit
OR
Quick assets Current assets -
3. Cash Reservoir
Ratio
4.Interval
Measure
II. Capital
Current Liabilities
Cash reservoir
Current Liabilities
Quick assets
Average daily
operating expenses
Inventories - Prepaid
expenses
Cash + Bank +
Marketable securities +
Short term investment
OR
Current assets -
inventories
Current assets -
Inventories - Prepaid
expenses
Current liabilities
Current liabilities
Cost of goods sold
+ selling,
administrative &
general expenses -
depreciation - other
non cash
expenditures
360 days
18. 18
FL in CAFM
Structure
Ratios:
5. Debt - Equity
Ratio
(i) as ratio
(ii) as percentage
Debt
Equity
Debt
Debt Equity
Long term loan +
Short term loan:
if it is not payable
within a year even
otherwise when the
question is silent
If it is not protected by
securities
Equity share capital
+ Preference share
capital + Reserves
& Surplus -
Fictitious assets
6. Capital Debt Preference Preference share capital + Equity share capital
Gearing Ratio
Equity
Debt
Preference Equity
Debentures + Long term
loans
+ Reserves &
Surplus - P & L
account (Dr.
balance)
7.Proprietary Proprietary Funds Equity share capital + Fixed Assets +
Ratio
III. Profitability
Ratios:
(a)Turnover
Related Ratios:
Total Assets Preference hare capital +
Reserves & Surplus -
Accumulated loss
Current assets
(excluding
fictitious assets)
8. Gross Profit
Ratio (as %)
Gross Profit
Sales
x100
Gross profit as per
Trading Account
Sales net of returns
9. Operating
Profit Ratio (as
%)
10. Net Profit
OperatingProfit
Sales
Net Profit
x100
Gross profit - Non-
opearting expenses +
Non-opearating income
Net profit as per Profit &
Sales net of returns
Ratio
(as %)
(b) Investment
Related Ratios
11. Return on
Capital employed
/ Return on
Investment
Sales
x100 Loss account
19. Ratio Analysis 19
FL in CAFM
(i) Pre- tax EBIT Net Profit after Tax + Equity Share
Capital Employed Tax + Interest + Non -
trading Expenses + Non -
operating Incomes.
Capital +
Preference Share
Capital + Reserves
& Surplus +
Debentures - Loss
- Non-trading
investment.
(ii) Post - tax PAT Interest
Capital Employed
OR
EBIT (1- Tax Rate)
Capital Employed
Profit after Tax + Interest Equity Share
Capital +
Preference Share
Capital + Reserves
& Surplus +
Debentures - Loss
- Non-trading
investment.-
Preliminary
expenses
12. Return on
Equity
IV. Coverage
ratios:
13. Interest
PAT - Preference
dividend
Shereholders Funds
PAT Interest
Profit after Tax -
Preference dividend
(Equity earnings)
Net Profit after Tax +
Equity Share
Capital +
Preference Share
Capital + Reserves
& Surplus - Loss
Interest on Loan
coverage ratio
Intrest
OR
PAT Interest
Depreciation
Non cash charges
Intrest
Tax + Interest + Non -
trading Expenses + Non -
operating Incomes.
(Long term & short
tem)
14. Debt - service
coverage ratio
V. Turnover
Ratios
PAT Interest
Depreciatoi n
Noncashcharges
Principal Interest
Net profit as per P & L
account - Tax + Interest +
Non - trading Expenses +
Non - operating Incomes.
Interest on debt +
installment of debt
20. 20
FL in CAFM
15. Assets
Turnover Ratio
Sales Total
Assets OR
Sales
Capital Employed
Sales net of return Net fixed Assets +
Current assets
(excluding
fictitious assets)
16. Fixed Assets Sales Sales net of return Net fixed Assets
Turnover Ratio Net Fixed Assets (Fixed assets -
Depreciation)
17. Working Sales Sales net of return Current assets -
Capital Turnover
Ratio
18. Inventory
Turnover Ratio
Working Capital
Sales
AverageInvenory
OR
Cost of Goods Sold
AverageInvenory
Sales net of return
OR
Cost of production -
Closing stock of finished
goods
current liabilities
Opening stock +
Closing stock
2
19. Debtors
Turnover Ratio
Sales
AverageDebtors
OR
Cost of sales
AverageDebtors
Net credit sales
OR
Cost of goods sold +
Administration exp. +
Selling & Distribution
exp.
Opening debtors +
Closing debtors
2
20. Creditors Purchases Net credit purchases Opening creditors +
Turnover Ratio
VI. Velocity
Ratios
21. Inventory
Velocity
AverageCreditors
365
InventoryTurnover
Ratio
Closing creditors
2
21. Ratio Analysis 21
FL in CAFM
22. Debtors
Velocity
23. Creditors
Velocity
VII. Capital
Market Ratios
365
Debtors Turnover
Ratio
365 .
Creditors Turnover
Ratio
24. EPS PAT - Preference
dividend
No.of Shares
PAT - Preference
dividend
No. of equity
shares
25. PE Multiple Market price Current market price of EPS
EPS equity share
26. Dividend Dividend Dividend Current market
Yield Market price per share price of equity
share
27. Payout Ratio Dividend per share
EPS
Dividend per share EPS