Downloaded 27 times
![Ratio Analysis
By. Dr. Bhavik R. Shah
[M.Com, M.Ed, M.Phil, Ph.D]
9898462148](https://image.slidesharecdn.com/ratioanalysis-200322063307/85/Ratio-analysis-1-320.jpg)


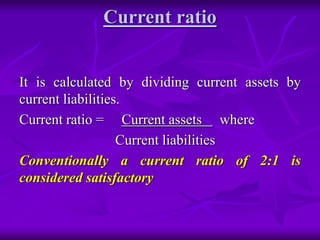
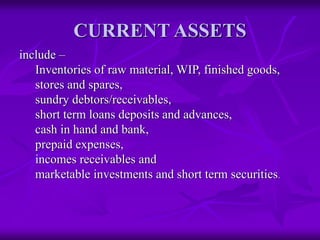
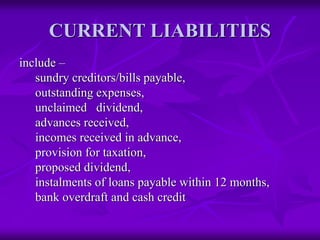


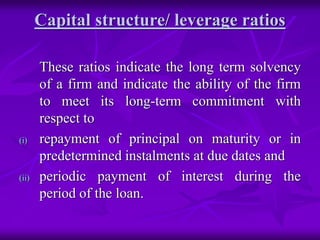


This document discusses ratio analysis, which involves calculating and presenting relationships between financial statement items. Ratios are used to interpret financial statements and assess a firm's strengths/weaknesses, historical performance, and current financial condition. The document categorizes ratios into liquidity, capital structure/leverage, profitability, and activity ratios. It provides definitions and calculations for key ratios within each category such as current ratio, debt-to-equity ratio, net profit margin, inventory turnover ratio, and discusses how ratios can be used for analysis and comparison purposes.


