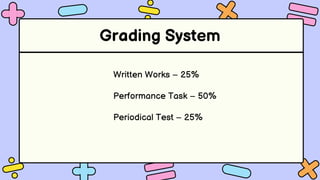
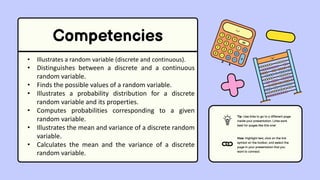
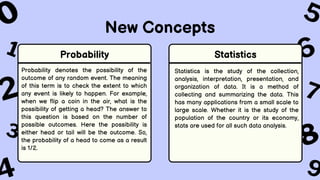
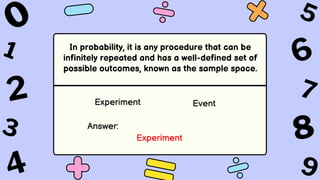
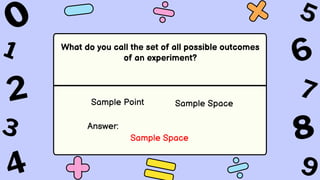
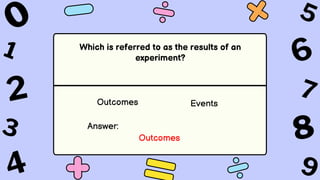
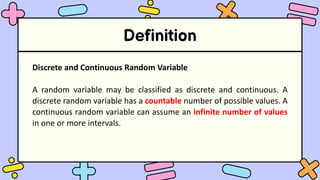
3. Competencies
• Illustrates a random variable (discrete and continuous).
• Distinguishes between a discrete and a continuous
random variable.
• Finds the possible values of a random variable.
• Illustrates a probability distribution for a discrete
random variable and its properties.
• Computes probabilities corresponding to a given
random variable.
• Illustrates the mean and variance of a discrete random
variable.
• Calculates the mean and the variance of a discrete
random variable.
Tip: Use links to go to a different page
inside your presentation. Links work
best for pages like this one!
How: Highlight text, click on the link
symbol on the toolbar, and select the
page in your presentation that you
want to connect.
4. Competencies
• Interprets the mean and the variance of a discrete
random variable.
• Solves problems involving mean and variance of
probability distributions.
• Illustrates a normal random variable and its
characteristics.
• Identifies regions under the normal curve
corresponding to different standard normal values.
• Converts a normal random variable to a standard
normal variable and vice versa.
• Computes probabilities and percentiles using the
standard normal table.
Tip: Use links to go to a different page
inside your presentation. Links work
best for pages like this one!
How: Highlight text, click on the link
symbol on the toolbar, and select the
page in your presentation that you
want to connect.
5. Competencies
• Illustrates random sampling.
• Distinguishes between parameter and statistic.
• Identifies sampling distributions of statistics (sample
mean).
• Finds the mean and variance of the sampling
distribution of the sample mean.
• Defines the sampling distribution of the sample
mean for normal population when the variance is: (a)
known; (b) unknown
• Illustrates the Central Limit Theorem.
• Defines the sampling distribution of the sample
mean using the Central Limit Theorem.
Tip: Use links to go to a different page
inside your presentation. Links work
best for pages like this one!
How: Highlight text, click on the link
symbol on the toolbar, and select the
page in your presentation that you
want to connect.
6. Competencies
• Solves problems involving sampling distributions of
the sample mean.
• Illustrates the t-distribution.
• Identifies percentiles using the t-table.
• Identifies the length of a confidence interval.
• Computes for the length of the confidence interval.
• Computes for an appropriate sample size using the
length of the interval.
• Solves problems involving sample size determination.
Tip: Use links to go to a different page
inside your presentation. Links work
best for pages like this one!
How: Highlight text, click on the link
symbol on the toolbar, and select the
page in your presentation that you
want to connect.
7. Definition
Probability and Statistics are the two important concepts in
Mathematics. Probability is all about chance. Whereas statistics
is more about how we handle various data using different
techniques. It helps to represent complicated data in a very
easy and understandable way.
8. Probability denotes the possibility of the
outcome of any random event. The meaning
of this term is to check the extent to which
any event is likely to happen. For example,
when we flip a coin in the air, what is the
possibility of getting a head? The answer to
this question is based on the number of
possible outcomes. Here the possibility is
either head or tail will be the outcome. So,
the probability of a head to come as a result
is 1/2.
Statistics is the study of the collection,
analysis, interpretation, presentation, and
organization of data. It is a method of
collecting and summarizing the data. This
has many applications from a small scale to
large scale. Whether it is the study of the
population of the country or its economy,
stats are used for all such data analysis.
New Concepts
Probability Statistics
9. In probability, it is any procedure that can be
infinitely repeated and has a well-defined set of
possible outcomes, known as the sample space.
Experiment Event
Answer:
Experiment
10. What do you call the set of all possible outcomes
of an experiment?
Sample Point Sample Space
Answer:
Sample Space
11. Which is referred to as the results of an
experiment?
Outcomes Events
Answer:
Outcomes
12. How many possible outcomes are there in tossing
three coins simultaneously?
4 8
Answer:
8
13. In playing a snake and ladder game, you hope to
get a number 5 in rolling a die once to win a
game. Which of the following describes the
phrase “get a number 5”?
Sample Space Event
Answer:
Event
14. How many possible outcomes are there for the
experiment choosing a rock, or a paper, or a pair
of scissors at random?
3 5
Answer:
3
15. From the counting numbers 1 to 30, in how many
ways can you choose a number which is a multiple
of three?
15 10
Answer:
10
16. Suppose you spin the spinner shown at the right.
Which of the following is the sample space?
𝑆 = {𝑅,𝑂, 𝑌, 𝐺,𝐵}
Answer:
𝑆 = {𝑅, 𝑂, 𝑌, 𝐺, 𝐵,𝐼, 𝑉, 𝑃}
17. In how many ways can a prime number turn up in
rolling a die once?
1 3
Answer:
3
18. When a card is drawn from the standard deck of
52 playing cards, how many possible outcomes of
getting a numbered card?
36 18
Answer:
36
20. Activity
Suppose two coins are tossed and we are interested to determine the
number of tails that will come out. Let us use T to represent the number
of tails that will come out. Determine the values of the random variable T.
STEPS:
1. List the sample space
2. Count the number of tails in each outcome and assign this number
to this outcome.
3. Make a Conclusion (Determine the values of the random variable T)
22. Random Variable
A random variable is a result of chance event, that you can measure
or count.
A random variable is a numerical quantity that is assigned to the
outcome of an experiment. It is a variable that assumes numerical
values associated with the events of an experiment.
A random variable is a quantitative variable which values depends on
change.
NOTE:
We use capital letters to represent a random variable.
31. Definition
Discrete and Continuous Random Variable
A random variable may be classified as discrete and continuous. A
discrete random variable has a countable number of possible values. A
continuous random variable can assume an infinite number of values
in one or more intervals.
33. Probability Distribution
In the previous examples, you already learned how to determine the
values of discrete random variable. Constructing a probability
distribution is just a continuation of the previous part. We just need to
include an additional step to illustrate and compute the probabilities
corresponding to a given random variable.