Download to read offline
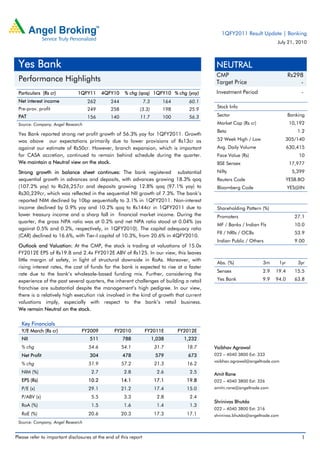
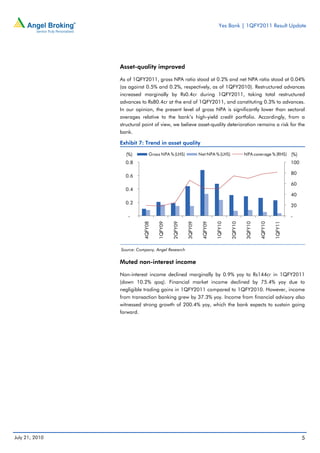
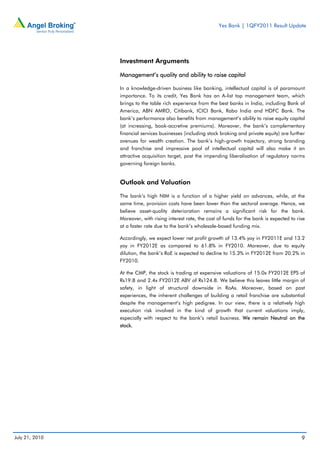
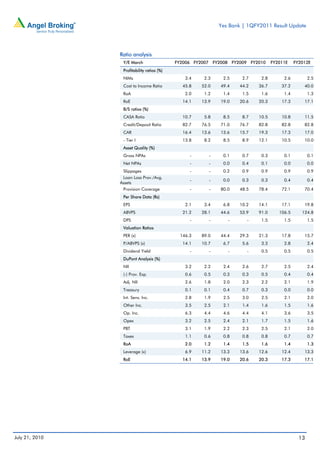

Yes Bank reported a 56.3% year-over-year increase in net profit for the first quarter of fiscal year 2011. Net profit was Rs. 156 crore, higher than the estimated Rs. 139 crore due to lower loan loss provisions. Strong loan and deposit growth continued, with advances up 18.3% quarter-over-quarter and deposits up 12.8% quarter-over-quarter. However, branch expansion remained behind schedule. The analyst maintains a Neutral rating on the stock due to high execution risks in achieving growth implied by current valuations, rising funding costs, and challenges in building a retail franchise.


