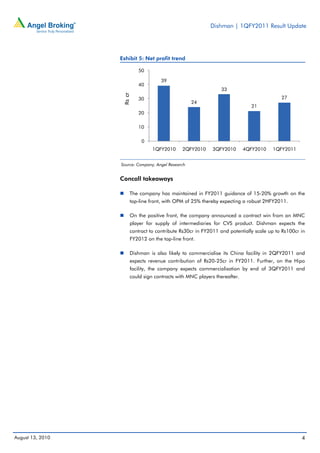
1QFY2011 Result Update | Pharmaceutical
                                                                                                                                    August 13, 2010


 Dishman Pharmaceuticals                                                                              BUY
                                                                                                      CMP                                    Rs206
 Performance Highlights                                                                               Target Price                           Rs279
   Y/E March (Rs cr)      1QFY2011        4QFY2010     % chg qoq        1QFY2010      % chg yoy       Investment Period                12 months
  Net Sales                      202             248        (18.6)           228         (11.3)
                                                                                                      Stock Info
  Other Income                      10             3       259.0                 15      (32.9)
                                                                                                      Sector                        Pharmaceutical
  Operating Profit                  44            49        (10.1)               53      (16.4)
                                                                                                      Market Cap (Rs cr)                       1,664
  Interest                           8            10        (18.1)               10      (20.8)
                                                                                                      Beta                                       0.7
  Net Profit                        27            21            28.3             39      (30.6)
                                                                                                      52 Week High / Low                     275/191
  Source: Company, Angel Research
                                                                                                      Avg. Daily Volume                       74996
 Dishman reported 1QFY2011 results, which were primarily in line with estimates                       Face Value (Rs)                             2
 boosted by other income. On the positive front, the company has announced                            BSE Sensex                              18,167
 contract win from an MNC, which could contribute Rs30cr in FY2011 and                                Nifty                                    5,452
 potentially Rs100cr in FY2012. The company has maintained its FY2011                                 Reuters Code                        DISH.BO
 guidance of 15-20% growth on the top-line front with OPM of 25% thereby                              Bloomberg Code                     DISH@IN
 expecting a robust 2HFY2011. We maintain a Buy on the stock.

 CRAMS remains subdued, but outlook positive: Dishman reported net sales to                           Shareholding Pattern (%)
 the tune of Rs202cr (Rs228cr), down 11.3% yoy mainly on the back of subdued                          Promoters                                60.9
 performance by the CRAMS segment. The company reported OPM of 22.0%                                  MF / Banks / Indian Fls                  25.4
 (23.4%), which contracted by 140bp following de-growth on the sales front.                           FII / NRIs / OCBs                         9.1
 Dishman reported net profit of Rs27cr (Rs39cr), which was in line with estimates                     Indian Public / Others                    4.6
 buoyed by other income.
 Outlook and Valuation: We believe that this is a good time to get an exposure to
 the CRAMS sector given that inventory rationalisation is likely to end. Over                         Abs. (%)                 3m      1yr       3yr

 FY2010-12E, we expect net sales to post a CAGR of 20.8% to Rs1,335cr and net                         Sensex                5.2      17.1      17.1

 profit to clock CAGR of 21.7% to Rs174cr. At current levels, Dishman is trading                      Dishman               (3.8)      0.7      0.0
 at attractive valuations of 11.8x and 9.6x FY2011E and FY2012E earnings
 respectively, which is at 33% discount to its historical average. We maintain a
 Buy on the stock, with a Target Price of Rs279.

 Key Financials (Consolidated)
  Y/E March (Rs cr)                  FY2009       FY2010E              FY2011E        FY2012E
  Net Sales                              1,062           915             1,099          1,335
  % chg                                   32.3         (13.8)             20.1           21.5
  Net Profit                              146           118               142            174
  % chg                                   22.1         (19.5)             20.5           23.0
  EPS (Rs)                                18.1          14.5              17.4           21.4
  EBITDA Margin (%)                       26.0          22.3              24.1           25.5
  P/E (x)                                 11.4          14.2              11.8            9.6        Sarabjit Kour Nangra
  RoE (%)                                 22.7          15.2              15.8           16.8        Tel: 022 – 4040 3800 Ext: 343
  RoCE (%)                                15.9           9.3              10.7           12.5        sarabjit@angeltrade.com
  P/BV (x)                                 2.3           2.0               1.7            1.5
                                                                                                     Sushant Dalmia
  EV/Sales (x)                             2.2           2.6               2.2            1.8
                                                                                                     Tel: 022 – 4040 3800 Ext: 320
  EV/EBITDA (x)                            8.5          11.6               9.0            7.0
                                                                                                     sushant.dalmia@angeltrade.com
  Source: Company, Angel Research


Please refer to important disclosures at the end of this report                                                                                   1
Dishman | 1QFY2011 Result Update


Exhibit 1: 1QFY2011 performance (consolidated)
Y/E March (Rs cr)                 1QFY2011     4QFY2010         % chg qoq   1QFY2010      % chg yoy    FY2010         FY2009      % chg
Net Sales                              202               248       (18.6)        228         (11.3)       915          1,062     (13.8)
Other Income                            10                  3      259.0          15         (32.9)        27             5       466.9
Total Income                           212               251       (15.4)        243         (12.7)       942          1,067     (11.7)
Gross profit                           146               146        (0.2)        172         (14.9)       639           738      (13.5)
Gross margins                         72.3               59.0                   75.3                     69.8           69.5
Operating Profit                        44                 49      (10.1)         53         (16.4)       204           261      (22.1)
OPM (%)                               22.0               20.0                   23.4                     22.3           24.6
Interest                                 8                 10      (18.1)         10         (20.8)        39            46      (15.5)
Dep & Amortisation                      16                 13        19.5         15           11.0        59            63        (5.6)
PBT                                     31                 29         5.7         44         (30.3)       133           157      (15.8)
Provision for Taxation                   3                  7      (54.2)          5               -       15            11        38.9
Reported Net Profit                     27                 21       26.3          39         (30.8)       118           147      (19.8)
Less : Exceptional Items                (0)                 0     (140.0)           -                        -             -
Minority Interest                         -                 -                       -                        0            1
PAT after Exceptional Items             27                 21       28.3          39         (30.6)       117           146      (19.7)
EPS (Rs)                               3.4                2.6                    4.9                     14.6           18.1
Source: Company, Angel Research

                                              Exhibit 2: 1QFY2011- Actual v/s Angel estimates
                                              Rs cr                                       Actual        Estimates              Variation
                                              Net Sales                                     202              228                 (11.5)
                                              Other Income                                   10                   3               315.2
                                              Operating Profit                               44                  55              (18.8)
                                              Interest                                        8                  11              (21.9)
                                              Tax                                             3                   6              (39.5)
                                              Net Profit                                     27                  28                (1.3)
                                              Source: Company, Angel Research

                                              Revenue below estimates, CRAMS remains subdued: Dishman reported net sales
                                              to the tune of Rs202cr (Rs228cr), down 11.3% yoy mainly on the back of subdued
                                              performance by the CRAMS segment. The company clocked revenue of Rs143cr
                                              (Rs168cr) in the CRAMS segment, down 15.2% on low pick-up on the contract
                                              research front. Carbogen clocked revenues of Rs93cr (Rs118cr), while India assets
                                              recorded revenues of Rs48cr (Rs51cr), down 4.5% yoy. On the Marketable
                                              Molecules (MM) front, revenues remained flat at Rs59cr driven by the Vitamin D
                                              business, which grew 16.2% to Rs32cr (Rs27cr).


August 13, 2010                                                                                                                        2
Dishman | 1QFY2011 Result Update


                  Exhibit 3: Sales trend

                             300
                                                                                    248
                             250      228                            222
                                                     217
                                                                                                202


                    Rs  cr
                             200

                             150

                             100

                              50

                               0
                                    1QFY2010       2QFY2010       3QFY2010        4QFY2010    1QFY2011


                  Source: Company, Angel Research


                  OPM contracts on lower sales: Dishman reported OPM to the tune of 22.0%
                  (23.4%), which contracted by 140bp due to de-growth on the sales front. Overall
                  raw material costs remained flat yoy at Rs56cr in spite of decrease in sales
                  resulting in lower gross margins. Employee expenses for the quarter slipped 14.7%
                  yoy to Rs63cr (Rs74cr) owing to the restructuring done at Carbogen.

                  Exhibit 4: OPM trend

                             26.0
                             24.0
                                            23.4                           23.1
                             22.0                                                                     22.0
                             20.0                          20.4
                                                                                       20.0
                     %


                             18.0
                             16.0
                             14.0
                             12.0
                             10.0
                                    1QFY2010       2QFY2010        3QFY2010       4QFY2010     1QFY2011

                  Source: Company, Angel Research


                  Net profit in line boosted by other income: Dishman reported net profit of Rs27cr
                  (Rs39cr), which was in line with estimates buoyed by other income. The company
                  reported MTM forex gain to the tune of Rs10cr (Rs15cr). Interest cost for the
                  quarter came in at Rs8cr (Rs10cr) on lower rates.


August 13, 2010                                                                                           3
Dishman | 1QFY2011 Result Update


                  Exhibit 5: Net profit trend

                            50

                                       39
                            40
                                                                 33


                   Rs  cr
                            30                                                              27
                                                    24
                                                                               21
                            20

                            10

                              0
                                   1QFY2010     2QFY2010      3QFY2010       4QFY2010   1QFY2011


                  Source: Company, Angel Research


                  Concall takeaways

                         The company has maintained in FY2011 guidance of 15-20% growth on the
                         top-line front, with OPM of 25% thereby expecting a robust 2HFY2011.

                         On the positive front, the company announced a contract win from an MNC
                         player for supply of intermediaries for CVS product. Dishman expects the
                         contract to contribute Rs30cr in FY2011 and potentially scale up to Rs100cr in
                         FY2012 on the top-line front.

                         Dishman is also likely to commercialise its China facility in 2QFY2011 and
                         expects revenue contribution of Rs20-25cr in FY2011. Further, on the Hipo
                         facility, the company expects commercialisation by end of 3QFY2011 and
                         could sign contracts with MNC players thereafter.


August 13, 2010                                                                                      4
Dishman | 1QFY2011 Result Update


                  Recommendation Rationale
                  Capex benefits to accrue from FY2011 onwards

                  Dishman is well placed to benefit from the organic capex of Rs300cr incurred over
                  the last three years towards building its China and Hipo facilities and expansion of
                  other existing facilities at its Bavla unit targeting the European and Asian markets.
                  Post the new facilities getting operational, Dishman is likely to enter into long-term
                  API supply contracts with these players resulting in stable revenue flow going
                  ahead. The company’s ties with the global innovators would also strengthen apart
                  from reducing its dependence on Abbott.

                  Abbott contract back on track

                  Abbott has been one of the key clients (13% sales and 17% of operating profit in
                  FY2010) for Dishman. As per a long-term contract, Dishman primarily supplies
                  Eprosartan (Teveten) API to the company. Revenues from the contract have risen at
                  a CAGR of 36.1% to Rs174.0cr over FY2007-09 driven by increasing
                  off-take of Eprosartan resulting in higher margins. However, during FY2010, key
                  products of Solvay, viz. Tricor and Teveten de-grew on account of inventory
                  rationalisation in the channels and acquisition by Abbott leading to revenues of
                  Rs120cr. With the global inventory rationalisation likely to end and the acquisition
                  of Solvay by Abbott now completed, we expect the contract to normalise in
                  FY2011.

                  Outlook and Valuation
                  We believe that this is a good time to get an exposure to the CRAMS sector given
                  that inventory rationalisation is likely to end. Over, FY201-12E, we expect the
                  company’s net sales to increase at a CAGR of 20.8% to Rs1,335cr and net profit to
                  clock CAGR of 21.7% to Rs174cr. At current levels, Dishman is trading at attractive
                  valuations of 11.8x and 9.6x FY2011E and FY2012E earnings respectively, which
                  is at 33% discount to its historical average. We maintain a Buy on the stock, with a
                  Target Price of Rs279.


                  Exhibit 6: Key assumptions
                                                                                 FY2011E       FY2012E
                  CRAMS Sales Growth (%)                                             24.9          26.6
                  MM Sales Growth (%)                                                  5.0          5.7
                  Growth in Employee Expenses (%)                                    17.2          19.7
                  Operating Margins (excl operating income) (%)                      24.1          25.5
                  Capex (Rs cr)                                                     180.0        180.0
                  Source: Company, Angel Research


August 13, 2010                                                                                       5
Dishman | 1QFY2011 Result Update


                                                     Exhibit 7: One-year forward PE band

                                                            500                                                                                                                                                                                                     24x


                                                            400
                                                                                                                                                                                                                                                                     18x

                                                            300
                                                                                                                                                                                                                                                                     12x
                                                            200

                                                                                                                                                                                                                                                                         6x
                                                            100


                                                             -

                                                                   Apr-05


                                                                                                       Apr-06


                                                                                                                                           Apr-07


                                                                                                                                                                               Apr-08


                                                                                                                                                                                                                   Apr-09


                                                                                                                                                                                                                                                       Apr-10
                                                                                     Oct-05


                                                                                                                         Oct-06


                                                                                                                                                             Oct-07


                                                                                                                                                                                                 Oct-08


                                                                                                                                                                                                                                     Oct-09
                                                                                              Jan-06


                                                                                                                                  Jan-07


                                                                                                                                                                      Jan-08


                                                                                                                                                                                                          Jan-09


                                                                                                                                                                                                                                              Jan-10
                                                                            Jul-05


                                                                                                                Jul-06


                                                                                                                                                    Jul-07


                                                                                                                                                                                        Jul-08


                                                                                                                                                                                                                            Jul-09


                                                                                                                                                                                                                                                                Jul-10
                                                      Source: Company, Angel Research


Exhibit 8: Recommendation Summary
Company                        Reco     CMP     Tgt Price        Upside                                                  FY2012E                                                                    FY10-12E                                      FY2012E
                                         (Rs)        (Rs)               %            PE (x)               EV/Sales (x)                              EV/EBITDA (x)                                CAGR in EPS (%)                                RoCE                     RoE
Alembic                     Buy           58          74          27.6                  9.1                                   0.8                                          6.5                                                46.4               14.8              18.5
Aventis*                  Reduce       1,888      1,658          (12.2)              20.5                                     3.0                                       16.0                                                  16.1               18.0              18.9
Cadila Healthcare           Buy          623         714          14.6               15.7                                     2.6                                       12.2                                                  26.6               26.0              34.7
Cipla                       Buy          315         360          14.3               18.4                                     3.7                                       17.5                                                  12.7               15.3              19.1
Dr Reddy's#               Neutral      1,336            -                   -        17.1                                     2.1                                       10.9                                                  93.6               23.8              25.5
Dishman Pharma              Buy          206         279          35.3                  9.6                                   1.8                                          7.0                                                21.7               12.5              16.8
GSK Pharma*               Reduce       1,961      1,700          (13.3)              26.5                                     5.9                                       16.8                                                  11.0               38.7              28.9
Indoco Remedies             Buy          394         541          37.3                  7.3                                   1.0                                          5.9                                                25.7               14.6              18.7
Ipca labs                 Neutral        280            -                   -        11.8                                     1.8                                          8.5                                                20.0               23.9              27.1
Lupin                       Buy        1,832      2,099           14.6               15.7                                     2.5                                       13.0                                                  23.2               23.9              31.2
Orchid Chemicals          Neutral        196            -                   -        11.5                                     1.6                                          8.7                                                         -               7.0         13.0
Piramal Healthcare        Neutral        477            -                   -        14.1                                     2.2                                       10.5                                                  21.1               25.4              32.7
Ranbaxy*                Accumulate       444         485            9.2              15.3                                     1.9                                       10.1                                                101.4                18.8              20.2
Sun Pharma                Neutral      1,750            -                   -        20.6                                     5.5                                       16.5                                                  14.0               16.4              17.7
Source: Company, Angel Research; Note: # The current estimates are as per IGAAP; *December year ending


August 13, 2010                                                                                                                                                                                                                                                               6
Dishman | 1QFY2011 Result Update


                  Profit & Loss Statement (Consolidated)
                  Y/E March (Rs cr)               FY07     FY08    FY09    FY10E    FY11E   FY12E
                  Net Sales                        579      803    1,062    915     1,099   1,335
                  Other operating income              -        -       -        -       -       -
                  Total operating income           579      803    1,062    915     1,099   1,335
                  % chg                           108.9     38.8    32.3   (13.8)    20.1    21.5
                  Total Expenditure                463      650     786     712      834     995
                  Net Raw Materials                207      302     330     277      330     397
                  Other Mfg costs                   47       49      73         -     82      99
                  Personnel                        141      215     273     254      298     356
                  Other                             69       84     110     181      124     143
                  EBITDA                           115      153     276     204      265     340
                  % chg                            78.5     32.8    80.5   (26.2)    29.9    28.5
                  (% of Net Sales)                 19.9     19.0    26.0    22.3     24.1    25.5
                  Depreciation& Amortisation        26       47      63       59      76     101
                  EBIT                              89      106     213     144      188     240
                  % chg                            69.2     19.0   101.6   (32.2)    30.5    27.1
                  (% of Net Sales)                 15.4     13.2    20.1    15.8     17.1    17.9
                  Interest & other Charges          16       30      46       39      50      51
                  Other Income                      23       48     (10)      27      22      27
                  (% of PBT)                       24.2     38.8       -    20.3     13.7    12.4
                  Share in profit of Associates     0.1      0.0     0.0        -       -       -
                  Recurring PBT                     96      123     157     133      160     215
                  % chg                            26.1     28.2    28.2   (15.8)    20.7    34.5
                  Extraordinary Expense/(Inc.)        -        -       -        -       -       -
                  PBT (reported)                    96      123     157     133      160     215
                  Tax                               3.2      1.3    10.7    14.9     18.3    40.9
                  (% of PBT)                        3.3      1.1     6.8    11.2     11.4    19.0
                  PAT (reported)                    93      122     147     118      142     174
                  Prior period items                 1        2       1         -       -       -
                  PAT after MI (reported)           92      120     146     118      142     174
                  ADJ. PAT                          92      120     146     118      142     174
                  % chg                            79.6     30.7    22.1   (19.5)    20.5    23.0
                  (% of Net Sales)                 15.8     14.9    13.8    12.9     12.9    13.1
                  Basic EPS (Rs)                   12.7     15.0    18.1    14.5     17.4    21.4
                  Fully Diluted EPS (Rs)           12.7     15.0    18.1    14.5     17.4    21.4
                  % chg                            71.6     18.3    20.6   (20.1)    20.5    23.0


August 13, 2010                                                                                 7
Dishman | 1QFY2011 Result Update


                  Balance Sheet (Consolidated)
                  Y/E March (Rs cr)           FY07   FY08    FY09    FY10E   FY11E   FY12E
                  SOURCES OF FUNDS
                  Equity Share Capital         14      16      16      16      16      16
                  Share Application Money       3      23       2       2       2       2
                  Reserves& Surplus           300     534     696     816     943    1,097
                  Shareholders Funds          318     573     714     834     961    1,115
                  Minority Interest              -       -       -       -       -       -
                  Total Loans                 561     630     724     788     892     809
                  Deferred Tax Liability       17      15      21      23      22      24
                  Total Liabilities           896    1,218   1,459   1,645   1,875   1,948
                  APPLICATION OF FUNDS
                  Gross Block                 473     645     798     968    1,248   1,428
                  Less: Acc. Depreciation      70     112     195     264     340     441
                  Net Block                   403     533     603     704     908     987
                  Capital Work-in-Progress     65     148     223     183      83      83
                  Goodwill                    135     152     175     175     175     175
                  Investments                  14       1       1       1       1       1
                  Current Assets              542     631     685     738     912     965
                  Cash                         36      37      45     101     185      89
                  Loans & Advances             84     113     187     144     160     194
                  Other                       423     481     453     492     566     683
                  Current liabilities         265     247     228     157     204     264
                  Net Current Assets          278     384     457     581     708     701
                  Mis. Exp. not written off     1        -       -       -       -       -
                  Total Assets                896    1,218   1,459   1,645   1,875   1,948


August 13, 2010                                                                          8
Dishman | 1QFY2011 Result Update


                  Cash Flow Statement (Consolidated)
                  Y/E March (Rs cr)              FY07    FY08    FY09    FY10E   FY11E   FY12E
                  Profit before tax                96     123     157     133     160     215
                  Depreciation                     27      47      63      59      76     101
                  (Inc)/Dec in Working Capital    (83)   (139)    (11)    (68)    (43)    (90)
                  Less: Other income               52      35      36      27      22      27
                  Direct taxes paid                (6)    (11)    (14)     (3)    (19)    (39)
                  Cash Flow from Operations       (19)    (15)    160      94     152     161
                  (Inc.)/Dec.in Fixed Assets     (416)   (269)   (174)   (130)   (180)   (180)
                  (Inc.)/Dec. in Investments       (7)     13       0        -       -       -
                  Other income                     52      35      36      27      22      27
                  Cash Flow from Investing       (370)   (221)   (139)   (103)   (158)   (153)
                  Issue of Equity                   3      20       2        -       -       -
                  Inc./(Dec.) in loans            302     228     107      77     105     (84)
                  Dividend Paid (Incl. Tax)        (5)     (9)     (9)    (11)    (15)    (20)
                  Others                           (9)     (2)   (112)       -       -       -
                  Cash Flow from Financing        290     237     (13)     66      90    (104)
                  Inc./(Dec.) in Cash            (100)      2       8      56      84     (97)
                  Opening Cash balances           135      35      37      45     101     185
                  Closing Cash balances            35      37      45     101     185      89


August 13, 2010                                                                              9
Dishman | 1QFY2011 Result Update


                  Key Ratios
                  Y/E March                                FY07   FY08   FY09   FY10E   FY11E   FY12E
                  Valuation Ratio (x)
                  P/E (on FDEPS)                           16.2   13.7   11.4    14.2    11.8     9.6
                  P/CEPS                                   12.6    9.8    8.0     9.5     7.7     6.1
                  P/BV                                      4.7    2.9    2.3     2.0     1.7     1.5
                  Dividend yield (%)                        0.5    0.5    0.6     0.6     0.8     1.0
                  EV/Sales                                  3.5    2.8    2.2     2.6     2.2     1.8
                  EV/EBITDA                                17.5   14.6    8.5    11.6     9.0     7.0
                  EV / Total Assets                         2.2    1.8    1.6     1.4     1.3     1.2
                  Per Share Data (Rs)
                  EPS (Basic)                              12.7   15.0   18.1    14.5    17.4    21.4
                  EPS (fully diluted)                      12.7   15.0   18.1    14.5    17.4    21.4
                  Cash EPS                                 16.3   20.9   25.9    21.8    26.8    33.8
                  DPS                                       1.1    1.0    1.2     1.2     1.6     2.1
                  Book Value                               44.0   72.0   88.5   102.6   118.2   137.1
                  Dupont Analysis
                  EBIT margin                              15.4   13.2   20.1    15.8    17.1    17.9
                  Tax retention ratio                      96.7   98.9   93.2    88.8    88.6    81.0
                  Asset turnover (x)                        0.9    0.8    0.8     0.6     0.7     0.8
                  ROIC (Post-tax)                          13.9   10.2   15.3     8.7    10.3    10.9
                  Cost of Debt (Post Tax)                   3.5    5.1    6.3     4.6     5.3     4.9
                  Leverage (x)                              0.9    1.3    1.0     0.9     0.8     0.7
                  Operating ROE                            22.9   17.2   24.2    12.3    14.2    15.1
                  Returns (%)
                  ROCE (Pre-tax)                           12.6   10.0   15.9     9.3    10.7    12.5
                  Angel ROIC (Pre-tax)                     17.9   13.7   22.5    13.1    14.4    15.8
                  ROE                                      36.2   26.9   22.7    15.2    15.8    16.8
                  Turnover ratios (x)
                  Asset Turnover (Gross Block)              1.7    1.4    1.5     1.0     1.0     1.0
                  Inventory / Sales (days)                 128    137    105     119     106     105
                  Receivables (days)                        67     68     56      70      69      66
                  Payables (days)                           48     38     40      50      43      44
                  Working capital cycle (ex-cash) (days)   210    134    130     178     166     155
                  Solvency ratios (x)
                  Net debt to equity                        1.7    1.0    0.9     0.8     0.7     0.6
                  Net debt to EBITDA                        4.6    3.9    2.5     3.4     2.7     2.1
                  Interest Coverage (EBIT / Interest)       5.5    3.5    4.6     3.7     3.7     4.7


August 13, 2010                                                                                    10
Dishman | 1QFY2011 Result Update


  Research Team Tel: 022 - 4040 3800               E-mail: research@angeltrade.com                   Website: www.angeltrade.com

 DISCLAIMER

 This document is solely for the personal information of the recipient, and must not be singularly used as the basis of any investment
 decision. Nothing in this document should be construed as investment or financial advice. Each recipient of this document should make
 such investigations as they deem necessary to arrive at an independent evaluation of an investment in the securities of the companies
 referred to in this document (including the merits and risks involved), and should consult their own advisors to determine the merits and
 risks of such an investment.

 Angel Broking Limited, its affiliates, directors, its proprietary trading and investment businesses may, from time to time, make
 investment decisions that are inconsistent with or contradictory to the recommendations expressed herein. The views contained in this
 document are those of the analyst, and the company may or may not subscribe to all the views expressed within.

 Reports based on technical and derivative analysis center on studying charts of a stock's price movement, outstanding positions and
 trading volume, as opposed to focusing on a company's fundamentals and, as such, may not match with a report on a company's
 fundamentals.

 The information in this document has been printed on the basis of publicly available information, internal data and other reliable
 sources believed to be true, but we do not represent that it is accurate or complete and it should not be relied on as such, as this
 document is for general guidance only. Angel Broking Limited or any of its affiliates/ group companies shall not be in any way
 responsible for any loss or damage that may arise to any person from any inadvertent error in the information contained in this report.
 Angel Broking Limited has not independently verified all the information contained within this document. Accordingly, we cannot testify,
 nor make any representation or warranty, express or implied, to the accuracy, contents or data contained within this document. While
 Angel Broking Limited endeavours to update on a reasonable basis the information discussed in this material, there may be regulatory,
 compliance, or other reasons that prevent us from doing so.
 This document is being supplied to you solely for your information, and its contents, information or data may not be reproduced,
 redistributed or passed on, directly or indirectly.

 Angel Broking Limited and its affiliates may seek to provide or have engaged in providing corporate finance, investment banking or
 other advisory services in a merger or specific transaction to the companies referred to in this report, as on the date of this report or in
 the past.

 Neither Angel Broking Limited, nor its directors, employees or affiliates shall be liable for any loss or damage that may arise from or in
 connection with the use of this information.

 Note: Please refer to the important `Stock Holding Disclosure' report on the Angel website (Research Section). Also, please
 refer to the latest update on respective stocks for the disclosure status in respect of those stocks. Angel Broking Limited and
 its affiliates may have investment positions in the stocks recommended in this report.


 Disclosure of Interest Statement                                                Dishman
 1. Analyst ownership of the stock                                                  No
 2. Angel and its Group companies ownership of the stock                            Yes
 3. Angel and its Group companies' Directors ownership of the stock                 No
 4. Broking relationship with company covered                                       No

 Note: We have not considered any Exposure below Rs 1 lakh for Angel, its Group companies and Directors.


 Ratings (Returns) :             Buy (> 15%)                      Accumulate (5% to 15%)                 Neutral (-5 to 5%)
                                 Reduce (-5% to 15%)              Sell (< -15%)


August 13, 2010                                                                                                                           11

Dishman

  • 1.
    1QFY2011 Result Update| Pharmaceutical August 13, 2010 Dishman Pharmaceuticals BUY CMP Rs206 Performance Highlights Target Price Rs279 Y/E March (Rs cr) 1QFY2011 4QFY2010 % chg qoq 1QFY2010 % chg yoy Investment Period 12 months Net Sales 202 248 (18.6) 228 (11.3) Stock Info Other Income 10 3 259.0 15 (32.9) Sector Pharmaceutical Operating Profit 44 49 (10.1) 53 (16.4) Market Cap (Rs cr) 1,664 Interest 8 10 (18.1) 10 (20.8) Beta 0.7 Net Profit 27 21 28.3 39 (30.6) 52 Week High / Low 275/191 Source: Company, Angel Research Avg. Daily Volume 74996 Dishman reported 1QFY2011 results, which were primarily in line with estimates Face Value (Rs) 2 boosted by other income. On the positive front, the company has announced BSE Sensex 18,167 contract win from an MNC, which could contribute Rs30cr in FY2011 and Nifty 5,452 potentially Rs100cr in FY2012. The company has maintained its FY2011 Reuters Code DISH.BO guidance of 15-20% growth on the top-line front with OPM of 25% thereby Bloomberg Code DISH@IN expecting a robust 2HFY2011. We maintain a Buy on the stock. CRAMS remains subdued, but outlook positive: Dishman reported net sales to Shareholding Pattern (%) the tune of Rs202cr (Rs228cr), down 11.3% yoy mainly on the back of subdued Promoters 60.9 performance by the CRAMS segment. The company reported OPM of 22.0% MF / Banks / Indian Fls 25.4 (23.4%), which contracted by 140bp following de-growth on the sales front. FII / NRIs / OCBs 9.1 Dishman reported net profit of Rs27cr (Rs39cr), which was in line with estimates Indian Public / Others 4.6 buoyed by other income. Outlook and Valuation: We believe that this is a good time to get an exposure to the CRAMS sector given that inventory rationalisation is likely to end. Over Abs. (%) 3m 1yr 3yr FY2010-12E, we expect net sales to post a CAGR of 20.8% to Rs1,335cr and net Sensex 5.2 17.1 17.1 profit to clock CAGR of 21.7% to Rs174cr. At current levels, Dishman is trading Dishman (3.8) 0.7 0.0 at attractive valuations of 11.8x and 9.6x FY2011E and FY2012E earnings respectively, which is at 33% discount to its historical average. We maintain a Buy on the stock, with a Target Price of Rs279. Key Financials (Consolidated) Y/E March (Rs cr) FY2009 FY2010E FY2011E FY2012E Net Sales 1,062 915 1,099 1,335 % chg 32.3 (13.8) 20.1 21.5 Net Profit 146 118 142 174 % chg 22.1 (19.5) 20.5 23.0 EPS (Rs) 18.1 14.5 17.4 21.4 EBITDA Margin (%) 26.0 22.3 24.1 25.5 P/E (x) 11.4 14.2 11.8 9.6 Sarabjit Kour Nangra RoE (%) 22.7 15.2 15.8 16.8 Tel: 022 – 4040 3800 Ext: 343 RoCE (%) 15.9 9.3 10.7 12.5 sarabjit@angeltrade.com P/BV (x) 2.3 2.0 1.7 1.5 Sushant Dalmia EV/Sales (x) 2.2 2.6 2.2 1.8 Tel: 022 – 4040 3800 Ext: 320 EV/EBITDA (x) 8.5 11.6 9.0 7.0 sushant.dalmia@angeltrade.com Source: Company, Angel Research Please refer to important disclosures at the end of this report 1
  • 2.
    Dishman | 1QFY2011Result Update Exhibit 1: 1QFY2011 performance (consolidated) Y/E March (Rs cr) 1QFY2011 4QFY2010 % chg qoq 1QFY2010 % chg yoy FY2010 FY2009 % chg Net Sales 202 248 (18.6) 228 (11.3) 915 1,062 (13.8) Other Income 10 3 259.0 15 (32.9) 27 5 466.9 Total Income 212 251 (15.4) 243 (12.7) 942 1,067 (11.7) Gross profit 146 146 (0.2) 172 (14.9) 639 738 (13.5) Gross margins 72.3 59.0 75.3 69.8 69.5 Operating Profit 44 49 (10.1) 53 (16.4) 204 261 (22.1) OPM (%) 22.0 20.0 23.4 22.3 24.6 Interest 8 10 (18.1) 10 (20.8) 39 46 (15.5) Dep & Amortisation 16 13 19.5 15 11.0 59 63 (5.6) PBT 31 29 5.7 44 (30.3) 133 157 (15.8) Provision for Taxation 3 7 (54.2) 5 - 15 11 38.9 Reported Net Profit 27 21 26.3 39 (30.8) 118 147 (19.8) Less : Exceptional Items (0) 0 (140.0) - - - Minority Interest - - - 0 1 PAT after Exceptional Items 27 21 28.3 39 (30.6) 117 146 (19.7) EPS (Rs) 3.4 2.6 4.9 14.6 18.1 Source: Company, Angel Research Exhibit 2: 1QFY2011- Actual v/s Angel estimates Rs cr Actual Estimates Variation Net Sales 202 228 (11.5) Other Income 10 3 315.2 Operating Profit 44 55 (18.8) Interest 8 11 (21.9) Tax 3 6 (39.5) Net Profit 27 28 (1.3) Source: Company, Angel Research Revenue below estimates, CRAMS remains subdued: Dishman reported net sales to the tune of Rs202cr (Rs228cr), down 11.3% yoy mainly on the back of subdued performance by the CRAMS segment. The company clocked revenue of Rs143cr (Rs168cr) in the CRAMS segment, down 15.2% on low pick-up on the contract research front. Carbogen clocked revenues of Rs93cr (Rs118cr), while India assets recorded revenues of Rs48cr (Rs51cr), down 4.5% yoy. On the Marketable Molecules (MM) front, revenues remained flat at Rs59cr driven by the Vitamin D business, which grew 16.2% to Rs32cr (Rs27cr). August 13, 2010 2
  • 3.
    Dishman | 1QFY2011Result Update Exhibit 3: Sales trend 300 248 250 228 222 217 202 Rs  cr 200 150 100 50 0 1QFY2010 2QFY2010 3QFY2010 4QFY2010 1QFY2011 Source: Company, Angel Research OPM contracts on lower sales: Dishman reported OPM to the tune of 22.0% (23.4%), which contracted by 140bp due to de-growth on the sales front. Overall raw material costs remained flat yoy at Rs56cr in spite of decrease in sales resulting in lower gross margins. Employee expenses for the quarter slipped 14.7% yoy to Rs63cr (Rs74cr) owing to the restructuring done at Carbogen. Exhibit 4: OPM trend 26.0 24.0 23.4 23.1 22.0 22.0 20.0 20.4 20.0 % 18.0 16.0 14.0 12.0 10.0 1QFY2010 2QFY2010 3QFY2010 4QFY2010 1QFY2011 Source: Company, Angel Research Net profit in line boosted by other income: Dishman reported net profit of Rs27cr (Rs39cr), which was in line with estimates buoyed by other income. The company reported MTM forex gain to the tune of Rs10cr (Rs15cr). Interest cost for the quarter came in at Rs8cr (Rs10cr) on lower rates. August 13, 2010 3
  • 4.
    Dishman | 1QFY2011Result Update Exhibit 5: Net profit trend 50 39 40 33 Rs  cr 30 27 24 21 20 10 0 1QFY2010 2QFY2010 3QFY2010 4QFY2010 1QFY2011 Source: Company, Angel Research Concall takeaways The company has maintained in FY2011 guidance of 15-20% growth on the top-line front, with OPM of 25% thereby expecting a robust 2HFY2011. On the positive front, the company announced a contract win from an MNC player for supply of intermediaries for CVS product. Dishman expects the contract to contribute Rs30cr in FY2011 and potentially scale up to Rs100cr in FY2012 on the top-line front. Dishman is also likely to commercialise its China facility in 2QFY2011 and expects revenue contribution of Rs20-25cr in FY2011. Further, on the Hipo facility, the company expects commercialisation by end of 3QFY2011 and could sign contracts with MNC players thereafter.                                 August 13, 2010 4
  • 5.
    Dishman | 1QFY2011Result Update Recommendation Rationale Capex benefits to accrue from FY2011 onwards Dishman is well placed to benefit from the organic capex of Rs300cr incurred over the last three years towards building its China and Hipo facilities and expansion of other existing facilities at its Bavla unit targeting the European and Asian markets. Post the new facilities getting operational, Dishman is likely to enter into long-term API supply contracts with these players resulting in stable revenue flow going ahead. The company’s ties with the global innovators would also strengthen apart from reducing its dependence on Abbott. Abbott contract back on track Abbott has been one of the key clients (13% sales and 17% of operating profit in FY2010) for Dishman. As per a long-term contract, Dishman primarily supplies Eprosartan (Teveten) API to the company. Revenues from the contract have risen at a CAGR of 36.1% to Rs174.0cr over FY2007-09 driven by increasing off-take of Eprosartan resulting in higher margins. However, during FY2010, key products of Solvay, viz. Tricor and Teveten de-grew on account of inventory rationalisation in the channels and acquisition by Abbott leading to revenues of Rs120cr. With the global inventory rationalisation likely to end and the acquisition of Solvay by Abbott now completed, we expect the contract to normalise in FY2011. Outlook and Valuation We believe that this is a good time to get an exposure to the CRAMS sector given that inventory rationalisation is likely to end. Over, FY201-12E, we expect the company’s net sales to increase at a CAGR of 20.8% to Rs1,335cr and net profit to clock CAGR of 21.7% to Rs174cr. At current levels, Dishman is trading at attractive valuations of 11.8x and 9.6x FY2011E and FY2012E earnings respectively, which is at 33% discount to its historical average. We maintain a Buy on the stock, with a Target Price of Rs279. Exhibit 6: Key assumptions FY2011E FY2012E CRAMS Sales Growth (%) 24.9 26.6 MM Sales Growth (%) 5.0 5.7 Growth in Employee Expenses (%) 17.2 19.7 Operating Margins (excl operating income) (%) 24.1 25.5 Capex (Rs cr) 180.0 180.0 Source: Company, Angel Research August 13, 2010 5
  • 6.
    Dishman | 1QFY2011Result Update Exhibit 7: One-year forward PE band 500 24x 400 18x 300 12x 200 6x 100 - Apr-05 Apr-06 Apr-07 Apr-08 Apr-09 Apr-10 Oct-05 Oct-06 Oct-07 Oct-08 Oct-09 Jan-06 Jan-07 Jan-08 Jan-09 Jan-10 Jul-05 Jul-06 Jul-07 Jul-08 Jul-09 Jul-10 Source: Company, Angel Research Exhibit 8: Recommendation Summary Company Reco CMP Tgt Price Upside FY2012E FY10-12E FY2012E (Rs) (Rs) % PE (x) EV/Sales (x) EV/EBITDA (x) CAGR in EPS (%) RoCE RoE Alembic Buy 58 74 27.6 9.1 0.8 6.5 46.4 14.8 18.5 Aventis* Reduce 1,888 1,658 (12.2) 20.5 3.0 16.0 16.1 18.0 18.9 Cadila Healthcare Buy 623 714 14.6 15.7 2.6 12.2 26.6 26.0 34.7 Cipla Buy 315 360 14.3 18.4 3.7 17.5 12.7 15.3 19.1 Dr Reddy's# Neutral 1,336 - - 17.1 2.1 10.9 93.6 23.8 25.5 Dishman Pharma Buy 206 279 35.3 9.6 1.8 7.0 21.7 12.5 16.8 GSK Pharma* Reduce 1,961 1,700 (13.3) 26.5 5.9 16.8 11.0 38.7 28.9 Indoco Remedies Buy 394 541 37.3 7.3 1.0 5.9 25.7 14.6 18.7 Ipca labs Neutral 280 - - 11.8 1.8 8.5 20.0 23.9 27.1 Lupin Buy 1,832 2,099 14.6 15.7 2.5 13.0 23.2 23.9 31.2 Orchid Chemicals Neutral 196 - - 11.5 1.6 8.7 - 7.0 13.0 Piramal Healthcare Neutral 477 - - 14.1 2.2 10.5 21.1 25.4 32.7 Ranbaxy* Accumulate 444 485 9.2 15.3 1.9 10.1 101.4 18.8 20.2 Sun Pharma Neutral 1,750 - - 20.6 5.5 16.5 14.0 16.4 17.7 Source: Company, Angel Research; Note: # The current estimates are as per IGAAP; *December year ending August 13, 2010 6
  • 7.
    Dishman | 1QFY2011Result Update Profit & Loss Statement (Consolidated) Y/E March (Rs cr) FY07 FY08 FY09 FY10E FY11E FY12E Net Sales 579 803 1,062 915 1,099 1,335 Other operating income - - - - - - Total operating income 579 803 1,062 915 1,099 1,335 % chg 108.9 38.8 32.3 (13.8) 20.1 21.5 Total Expenditure 463 650 786 712 834 995 Net Raw Materials 207 302 330 277 330 397 Other Mfg costs 47 49 73 - 82 99 Personnel 141 215 273 254 298 356 Other 69 84 110 181 124 143 EBITDA 115 153 276 204 265 340 % chg 78.5 32.8 80.5 (26.2) 29.9 28.5 (% of Net Sales) 19.9 19.0 26.0 22.3 24.1 25.5 Depreciation& Amortisation 26 47 63 59 76 101 EBIT 89 106 213 144 188 240 % chg 69.2 19.0 101.6 (32.2) 30.5 27.1 (% of Net Sales) 15.4 13.2 20.1 15.8 17.1 17.9 Interest & other Charges 16 30 46 39 50 51 Other Income 23 48 (10) 27 22 27 (% of PBT) 24.2 38.8 - 20.3 13.7 12.4 Share in profit of Associates 0.1 0.0 0.0 - - - Recurring PBT 96 123 157 133 160 215 % chg 26.1 28.2 28.2 (15.8) 20.7 34.5 Extraordinary Expense/(Inc.) - - - - - - PBT (reported) 96 123 157 133 160 215 Tax 3.2 1.3 10.7 14.9 18.3 40.9 (% of PBT) 3.3 1.1 6.8 11.2 11.4 19.0 PAT (reported) 93 122 147 118 142 174 Prior period items 1 2 1 - - - PAT after MI (reported) 92 120 146 118 142 174 ADJ. PAT 92 120 146 118 142 174 % chg 79.6 30.7 22.1 (19.5) 20.5 23.0 (% of Net Sales) 15.8 14.9 13.8 12.9 12.9 13.1 Basic EPS (Rs) 12.7 15.0 18.1 14.5 17.4 21.4 Fully Diluted EPS (Rs) 12.7 15.0 18.1 14.5 17.4 21.4 % chg 71.6 18.3 20.6 (20.1) 20.5 23.0 August 13, 2010 7
  • 8.
    Dishman | 1QFY2011Result Update Balance Sheet (Consolidated) Y/E March (Rs cr) FY07 FY08 FY09 FY10E FY11E FY12E SOURCES OF FUNDS Equity Share Capital 14 16 16 16 16 16 Share Application Money 3 23 2 2 2 2 Reserves& Surplus 300 534 696 816 943 1,097 Shareholders Funds 318 573 714 834 961 1,115 Minority Interest - - - - - - Total Loans 561 630 724 788 892 809 Deferred Tax Liability 17 15 21 23 22 24 Total Liabilities 896 1,218 1,459 1,645 1,875 1,948 APPLICATION OF FUNDS Gross Block 473 645 798 968 1,248 1,428 Less: Acc. Depreciation 70 112 195 264 340 441 Net Block 403 533 603 704 908 987 Capital Work-in-Progress 65 148 223 183 83 83 Goodwill 135 152 175 175 175 175 Investments 14 1 1 1 1 1 Current Assets 542 631 685 738 912 965 Cash 36 37 45 101 185 89 Loans & Advances 84 113 187 144 160 194 Other 423 481 453 492 566 683 Current liabilities 265 247 228 157 204 264 Net Current Assets 278 384 457 581 708 701 Mis. Exp. not written off 1 - - - - - Total Assets 896 1,218 1,459 1,645 1,875 1,948 August 13, 2010 8
  • 9.
    Dishman | 1QFY2011Result Update Cash Flow Statement (Consolidated) Y/E March (Rs cr) FY07 FY08 FY09 FY10E FY11E FY12E Profit before tax 96 123 157 133 160 215 Depreciation 27 47 63 59 76 101 (Inc)/Dec in Working Capital (83) (139) (11) (68) (43) (90) Less: Other income 52 35 36 27 22 27 Direct taxes paid (6) (11) (14) (3) (19) (39) Cash Flow from Operations (19) (15) 160 94 152 161 (Inc.)/Dec.in Fixed Assets (416) (269) (174) (130) (180) (180) (Inc.)/Dec. in Investments (7) 13 0 - - - Other income 52 35 36 27 22 27 Cash Flow from Investing (370) (221) (139) (103) (158) (153) Issue of Equity 3 20 2 - - - Inc./(Dec.) in loans 302 228 107 77 105 (84) Dividend Paid (Incl. Tax) (5) (9) (9) (11) (15) (20) Others (9) (2) (112) - - - Cash Flow from Financing 290 237 (13) 66 90 (104) Inc./(Dec.) in Cash (100) 2 8 56 84 (97) Opening Cash balances 135 35 37 45 101 185 Closing Cash balances 35 37 45 101 185 89 August 13, 2010 9
  • 10.
    Dishman | 1QFY2011Result Update Key Ratios Y/E March FY07 FY08 FY09 FY10E FY11E FY12E Valuation Ratio (x) P/E (on FDEPS) 16.2 13.7 11.4 14.2 11.8 9.6 P/CEPS 12.6 9.8 8.0 9.5 7.7 6.1 P/BV 4.7 2.9 2.3 2.0 1.7 1.5 Dividend yield (%) 0.5 0.5 0.6 0.6 0.8 1.0 EV/Sales 3.5 2.8 2.2 2.6 2.2 1.8 EV/EBITDA 17.5 14.6 8.5 11.6 9.0 7.0 EV / Total Assets 2.2 1.8 1.6 1.4 1.3 1.2 Per Share Data (Rs) EPS (Basic) 12.7 15.0 18.1 14.5 17.4 21.4 EPS (fully diluted) 12.7 15.0 18.1 14.5 17.4 21.4 Cash EPS 16.3 20.9 25.9 21.8 26.8 33.8 DPS 1.1 1.0 1.2 1.2 1.6 2.1 Book Value 44.0 72.0 88.5 102.6 118.2 137.1 Dupont Analysis EBIT margin 15.4 13.2 20.1 15.8 17.1 17.9 Tax retention ratio 96.7 98.9 93.2 88.8 88.6 81.0 Asset turnover (x) 0.9 0.8 0.8 0.6 0.7 0.8 ROIC (Post-tax) 13.9 10.2 15.3 8.7 10.3 10.9 Cost of Debt (Post Tax) 3.5 5.1 6.3 4.6 5.3 4.9 Leverage (x) 0.9 1.3 1.0 0.9 0.8 0.7 Operating ROE 22.9 17.2 24.2 12.3 14.2 15.1 Returns (%) ROCE (Pre-tax) 12.6 10.0 15.9 9.3 10.7 12.5 Angel ROIC (Pre-tax) 17.9 13.7 22.5 13.1 14.4 15.8 ROE 36.2 26.9 22.7 15.2 15.8 16.8 Turnover ratios (x) Asset Turnover (Gross Block) 1.7 1.4 1.5 1.0 1.0 1.0 Inventory / Sales (days) 128 137 105 119 106 105 Receivables (days) 67 68 56 70 69 66 Payables (days) 48 38 40 50 43 44 Working capital cycle (ex-cash) (days) 210 134 130 178 166 155 Solvency ratios (x) Net debt to equity 1.7 1.0 0.9 0.8 0.7 0.6 Net debt to EBITDA 4.6 3.9 2.5 3.4 2.7 2.1 Interest Coverage (EBIT / Interest) 5.5 3.5 4.6 3.7 3.7 4.7 August 13, 2010 10
  • 11.
    Dishman | 1QFY2011Result Update Research Team Tel: 022 - 4040 3800 E-mail: research@angeltrade.com Website: www.angeltrade.com DISCLAIMER This document is solely for the personal information of the recipient, and must not be singularly used as the basis of any investment decision. Nothing in this document should be construed as investment or financial advice. Each recipient of this document should make such investigations as they deem necessary to arrive at an independent evaluation of an investment in the securities of the companies referred to in this document (including the merits and risks involved), and should consult their own advisors to determine the merits and risks of such an investment. Angel Broking Limited, its affiliates, directors, its proprietary trading and investment businesses may, from time to time, make investment decisions that are inconsistent with or contradictory to the recommendations expressed herein. The views contained in this document are those of the analyst, and the company may or may not subscribe to all the views expressed within. Reports based on technical and derivative analysis center on studying charts of a stock's price movement, outstanding positions and trading volume, as opposed to focusing on a company's fundamentals and, as such, may not match with a report on a company's fundamentals. The information in this document has been printed on the basis of publicly available information, internal data and other reliable sources believed to be true, but we do not represent that it is accurate or complete and it should not be relied on as such, as this document is for general guidance only. Angel Broking Limited or any of its affiliates/ group companies shall not be in any way responsible for any loss or damage that may arise to any person from any inadvertent error in the information contained in this report. Angel Broking Limited has not independently verified all the information contained within this document. Accordingly, we cannot testify, nor make any representation or warranty, express or implied, to the accuracy, contents or data contained within this document. While Angel Broking Limited endeavours to update on a reasonable basis the information discussed in this material, there may be regulatory, compliance, or other reasons that prevent us from doing so. This document is being supplied to you solely for your information, and its contents, information or data may not be reproduced, redistributed or passed on, directly or indirectly. Angel Broking Limited and its affiliates may seek to provide or have engaged in providing corporate finance, investment banking or other advisory services in a merger or specific transaction to the companies referred to in this report, as on the date of this report or in the past. Neither Angel Broking Limited, nor its directors, employees or affiliates shall be liable for any loss or damage that may arise from or in connection with the use of this information. Note: Please refer to the important `Stock Holding Disclosure' report on the Angel website (Research Section). Also, please refer to the latest update on respective stocks for the disclosure status in respect of those stocks. Angel Broking Limited and its affiliates may have investment positions in the stocks recommended in this report. Disclosure of Interest Statement Dishman 1. Analyst ownership of the stock No 2. Angel and its Group companies ownership of the stock Yes 3. Angel and its Group companies' Directors ownership of the stock No 4. Broking relationship with company covered No Note: We have not considered any Exposure below Rs 1 lakh for Angel, its Group companies and Directors. Ratings (Returns) : Buy (> 15%) Accumulate (5% to 15%) Neutral (-5 to 5%) Reduce (-5% to 15%) Sell (< -15%) August 13, 2010 11