Downloaded 84 times

![Data Visualization
4 of 98
http://nycdatascience.com/part4_en/
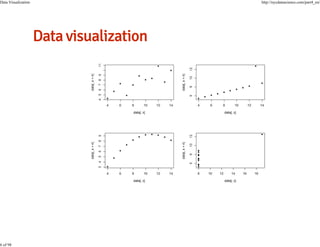
data <- read.table('data/anscombe.txt',T)
data <- data[,-1]
head(data)
1
2
3
4
5
6
x1
10
8
13
9
11
14
x2
10
8
13
9
11
14
x3 x4
y1
y2
y3
y4
10 8 8.04 9.14 7.46 6.58
8 8 6.95 8.14 6.77 5.76
13 8 7.58 8.74 12.74 7.71
9 8 8.81 8.77 7.11 8.84
11 8 8.33 9.26 7.81 8.47
14 8 9.96 8.10 8.84 7.04](https://image.slidesharecdn.com/rclass5-datavisualization-131211003425-phpapp01/85/R-class-5-data-visualization-4-320.jpg)
![Data Visualization
5 of 98
http://nycdatascience.com/part4_en/
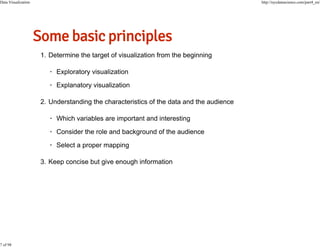
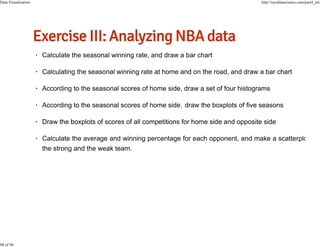
colMeans(data)
x1 x2 x3 x4 y1 y2 y3 y4
9.0 9.0 9.0 9.0 7.5 7.5 7.5 7.5
sapply(1:4,function(x) cor(data[,x],data[,x+4]))
[1] 0.816 0.816 0.816 0.817](https://image.slidesharecdn.com/rclass5-datavisualization-131211003425-phpapp01/85/R-class-5-data-visualization-5-320.jpg)
![Data Visualization
21 of 98
http://nycdatascience.com/part4_en/
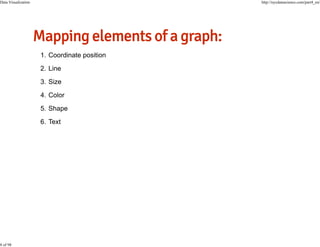
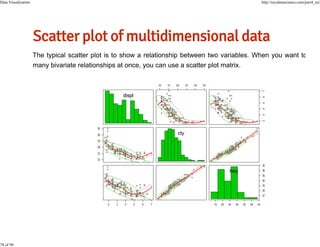
splom(iris[1:4])](https://image.slidesharecdn.com/rclass5-datavisualization-131211003425-phpapp01/85/R-class-5-data-visualization-21-320.jpg)
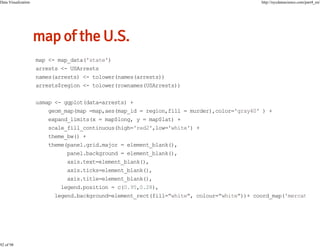
![Data Visualization
26 of 98
http://nycdatascience.com/part4_en/
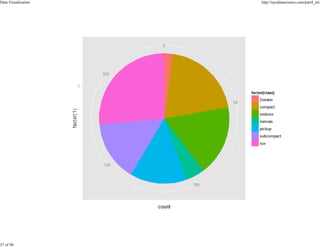
summary(p)
data: manufacturer, model, displ, year, cyl, trans, drv, cty, hwy, fl, class [234x11]
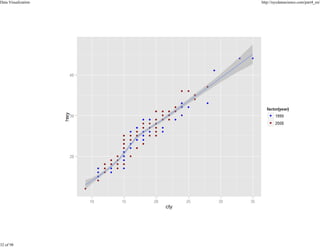
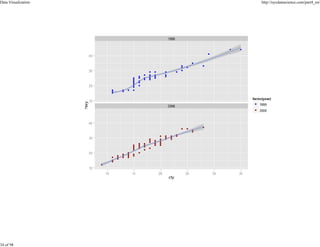
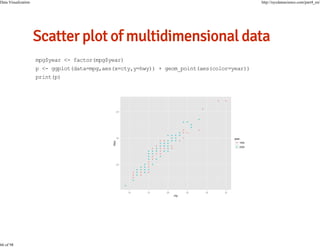
mapping: x = cty, y = hwy
faceting: facet_null()
----------------------------------geom_point: na.rm = FALSE
stat_identity:
position_identity: (width = NULL, height = NULL)](https://image.slidesharecdn.com/rclass5-datavisualization-131211003425-phpapp01/85/R-class-5-data-visualization-26-320.jpg)


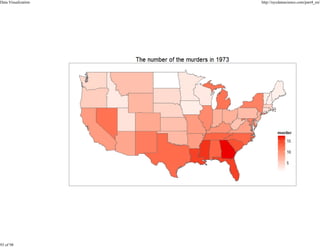
![Data Visualization
81 of 98
http://nycdatascience.com/part4_en/
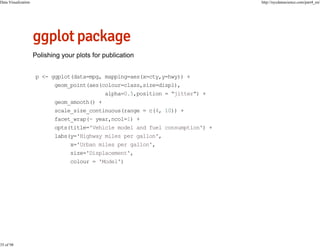
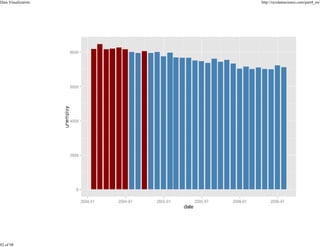
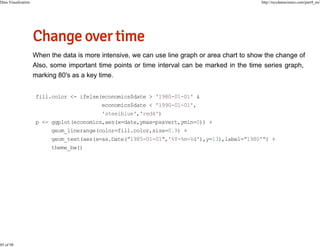
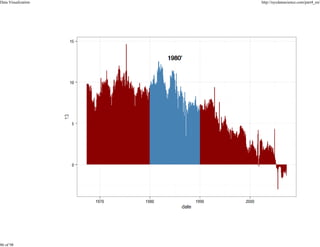
fillcolor <- ifelse(economics[440:470,'unemploy']<8000,'steelblue','red4')
p <- ggplot(economics[440:470,],aes(x=date,y=unemploy)) +
geom_bar(stat='identity',
fill=fillcolor)](https://image.slidesharecdn.com/rclass5-datavisualization-131211003425-phpapp01/85/R-class-5-data-visualization-81-320.jpg)
![Data Visualization
83 of 98
http://nycdatascience.com/part4_en/
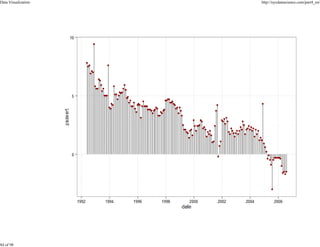
p <- ggplot(economics[300:470,],aes(x=date,ymax=psavert,ymin=0)) +
geom_linerange(color='grey20',size=0.5) +
geom_point(aes(y=psavert),color='red4') +
theme_bw()](https://image.slidesharecdn.com/rclass5-datavisualization-131211003425-phpapp01/85/R-class-5-data-visualization-83-320.jpg)


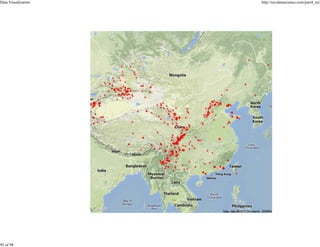
![Data Visualization
94 of 98
http://nycdatascience.com/part4_en/
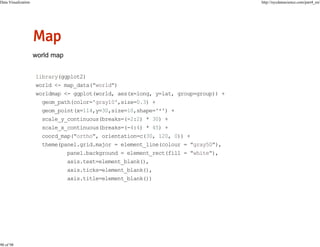
library(ggmap)
library(XML)
webpage <-'http://data.earthquake.cn/datashare/globeEarthquake_csn.html'
tables <- readHTMLTable(webpage,stringsAsFactors = FALSE)
raw <- tables[[6]]
data <- raw[,c(1,3,4)]
names(data) <- c('date','lan','lon')
data$lan <- as.numeric(data$lan)
data$lon <- as.numeric(data$lon)
data$date <- as.Date(data$date, "%Y-%m-%d")
#Read the map data from Google by the ggmap package, and mark the previous data on the
earthquake <- ggmap(get_googlemap(center = 'china', zoom=4,maptype='terrain'),extent='
geom_point(data=data,aes(x=lon,y=lan),colour = 'red',alpha=0.7)+
theme(legend.position = "none")](https://image.slidesharecdn.com/rclass5-datavisualization-131211003425-phpapp01/85/R-class-5-data-visualization-94-320.jpg)
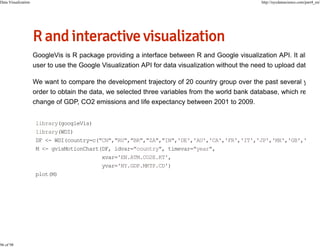


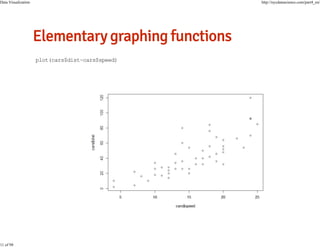
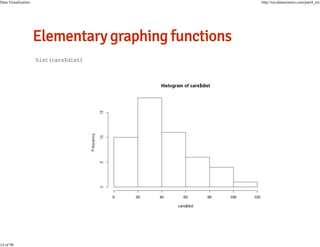
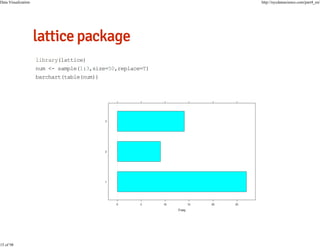
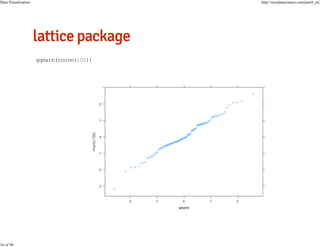
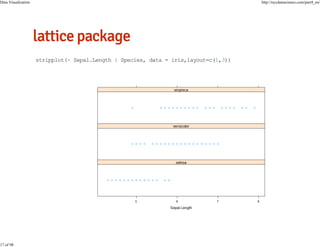
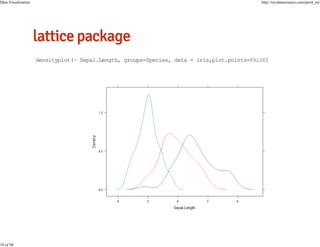
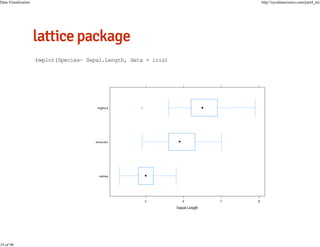
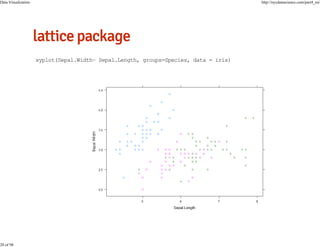
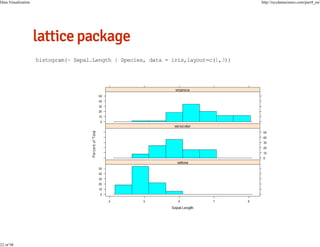
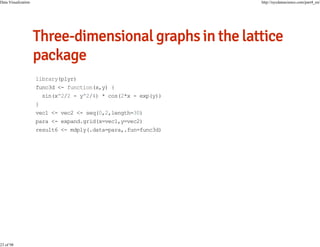
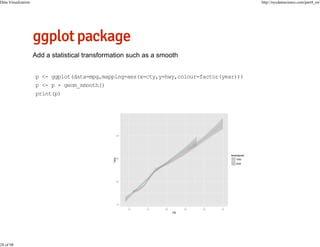
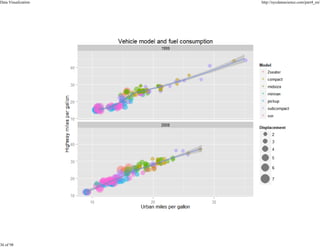
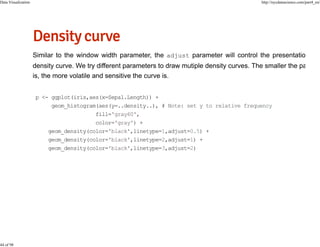
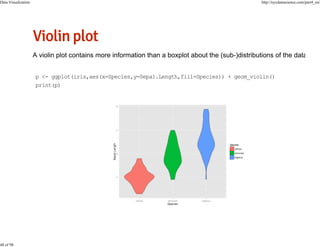
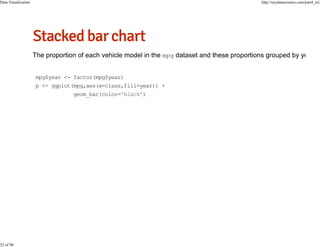
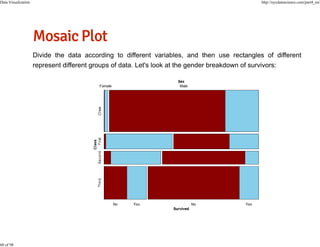
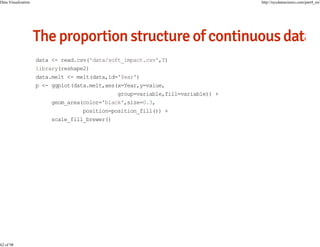
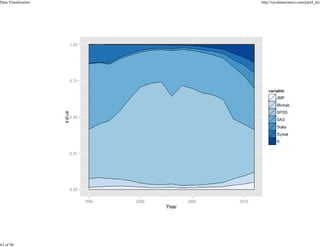
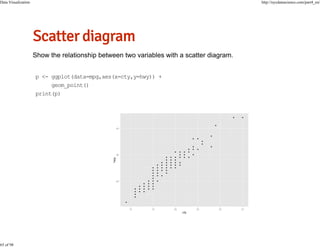
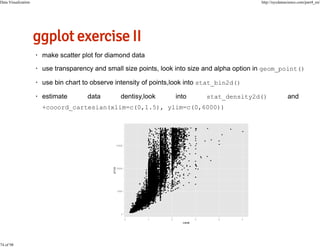
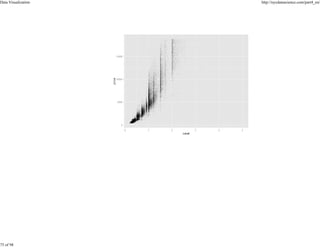
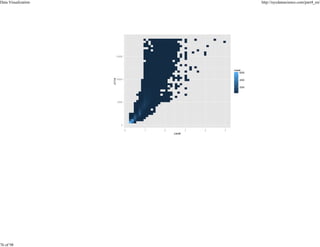
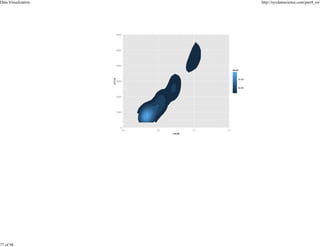
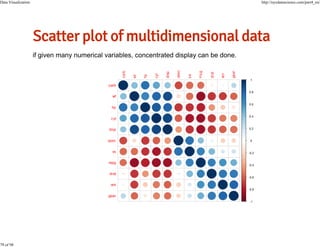
This document contains 98 pages of code examples demonstrating various data visualization techniques in R using packages such as ggplot2, lattice, and others. The code examples show how to create scatter plots, histograms, density plots, box plots, bar plots, and more using built-in and external dataset. Functions like geom_point, geom_smooth, facet_wrap are used to customize the plots.


![[系列活動] Data exploration with modern R](https://cdn.slidesharecdn.com/ss_thumbnails/dataexplorationwithmodernr1221-161219044516-thumbnail.jpg?width=640&height=640&fit=bounds)