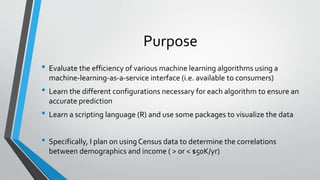
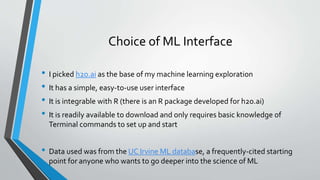
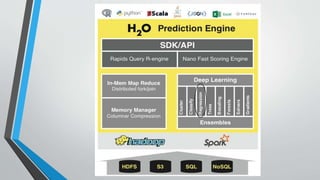
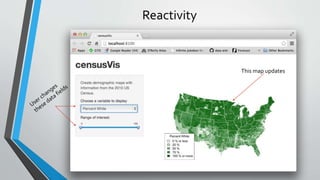
Explorations in Machine
Learning
An Evaluation of Algorithms andVisualization Interfaces
Summer 2015
Rahul Jayaraman
Brown University
Class of 2019
Purpose
• Evaluate the efficiency of various machine learning algorithms using a
machine-learning-as-a-service interface (i.e. available to consumers)
• Learn the different configurations necessary for each algorithm to ensure an
accurate prediction
• Learn a scripting language (R) and use some packages to visualize the data
• Specifically, I plan on using Census data to determine the correlations
between demographics and income ( > or < $50K/yr)
Choice of ML Interface
• I picked h2o.ai as the base of my machine learning exploration
• It has a simple, easy-to-use user interface
• It is integrable with R (there is an R package developed for h2o.ai)
• It is readily available to download and only requires basic knowledge of
Terminal commands to set up and start
• Data used was from the UC Irvine ML database, a frequently-cited starting
point for anyone who wants to go deeper into the science of ML
Building ML Models
• The UCI database contains a variety of data sets about everything from
color values to animal habitats to population income
• Each folder includes two documents: ATraining set + Actual data
• First we input the training set to build various models based on the variables present
• Then, we must configure the appropriate settings in h2o.ai (i.e. iterations, etc.)
• Finally, we apply the models to the actual data
• For this project, I used population/income data from 1994 US Census polls
Applying Algorithms (1) - Linear Regression
• Linear regression is an ML algorithm
in which each variable is assigned a
coefficient denoting its importance
to obtaining the end result
• E.g. 2x + 5y + 3z + 4a (y is highest imp.)
• The length of the bar suggests the
strength of the correlation
• Blue suggests a positive correlation,
and orange suggests a negative
correlation
• Runtime of < 0.001 s
Applying Algorithms (2) – Others
• Naïve Bayes (probabilistic) – 0.03 s
• It takes each factor into account independently and then evaluates the probability of
the desired result based upon the given factors
• K-Means Clustering (ineffective in this case) – 2 s
• Clusters data into groups of data points
• Implementation is similar to Least Squares Algorithm
• Deep Learning (takes a long time, very sensitive to small changes) – 15-30 m
• The results of these three algorithms are less useful in the context of the
problem at hand
End Result of ML Models – Accurate?
• The methods seemed to give the desired result, and h2o.ai is an intuitive
application to work with
• This is from 1994 census data; if more data from later years is released
(somewhere online), the reliability of these models can be tested
• These models can also be tested on similar data from other domains
• Demonstrates clear importance of having a test + validation method
Visualization of Data
• Numerous visualization packages (graphers, etc) exist in various languages
• To visualize my data, I picked Shiny, a package for the R scripting language
• It is simple, easy-to-use, and has high commonality with HTML
The Nuts and Bolts of Shiny
• 2 Files
• Server.R – handles the backend
• UI.R – what the user sees
• Data and pictures in a separate folder
• Helper files in the same folder (other scripts used to download files and feed
them to the other two files)
Shiny Is Function-Based (like R)
• UI document starts with a function defining UI
• Two main panels in the UI – and each can have a
variety of objects in them (images, text, graphs, etc.)
• The UI file and the Server file are mutually dependent
– if a variable is named in the Server file, with the
appropriate code it can be used in the UI file without
any messy code in R
• The server has one function with an input and output
the programmer defines
Reactivity
This map updates
Conclusions
• It’s really easy to get involved with machine learning – just download a
program, input the necessary settings, and then go!
• As datasets and their analysis become more popular, it’s important to find a
tool to reliably show “what’s important” about the data or “why should I
care” – and Shiny (R) fills that niche simply because it’s easy to use
• ML is clearly “the next big thing,” and it’s always exciting to be at the
forefront of such a novel technology

Machine Learning Exploration, R, and Data Visualization

  • 1.
    Explorations in Machine Learning AnEvaluation of Algorithms andVisualization Interfaces Summer 2015 Rahul Jayaraman Brown University Class of 2019
  • 2.
    Purpose • Evaluate theefficiency of various machine learning algorithms using a machine-learning-as-a-service interface (i.e. available to consumers) • Learn the different configurations necessary for each algorithm to ensure an accurate prediction • Learn a scripting language (R) and use some packages to visualize the data • Specifically, I plan on using Census data to determine the correlations between demographics and income ( > or < $50K/yr)
  • 3.
    Choice of MLInterface • I picked h2o.ai as the base of my machine learning exploration • It has a simple, easy-to-use user interface • It is integrable with R (there is an R package developed for h2o.ai) • It is readily available to download and only requires basic knowledge of Terminal commands to set up and start • Data used was from the UC Irvine ML database, a frequently-cited starting point for anyone who wants to go deeper into the science of ML
  • 5.
    Building ML Models •The UCI database contains a variety of data sets about everything from color values to animal habitats to population income • Each folder includes two documents: ATraining set + Actual data • First we input the training set to build various models based on the variables present • Then, we must configure the appropriate settings in h2o.ai (i.e. iterations, etc.) • Finally, we apply the models to the actual data • For this project, I used population/income data from 1994 US Census polls
  • 6.
    Applying Algorithms (1)- Linear Regression • Linear regression is an ML algorithm in which each variable is assigned a coefficient denoting its importance to obtaining the end result • E.g. 2x + 5y + 3z + 4a (y is highest imp.) • The length of the bar suggests the strength of the correlation • Blue suggests a positive correlation, and orange suggests a negative correlation • Runtime of < 0.001 s
  • 7.
    Applying Algorithms (2)– Others • Naïve Bayes (probabilistic) – 0.03 s • It takes each factor into account independently and then evaluates the probability of the desired result based upon the given factors • K-Means Clustering (ineffective in this case) – 2 s • Clusters data into groups of data points • Implementation is similar to Least Squares Algorithm • Deep Learning (takes a long time, very sensitive to small changes) – 15-30 m • The results of these three algorithms are less useful in the context of the problem at hand
  • 8.
    End Result ofML Models – Accurate? • The methods seemed to give the desired result, and h2o.ai is an intuitive application to work with • This is from 1994 census data; if more data from later years is released (somewhere online), the reliability of these models can be tested • These models can also be tested on similar data from other domains • Demonstrates clear importance of having a test + validation method
  • 9.
    Visualization of Data •Numerous visualization packages (graphers, etc) exist in various languages • To visualize my data, I picked Shiny, a package for the R scripting language • It is simple, easy-to-use, and has high commonality with HTML
  • 10.
    The Nuts andBolts of Shiny • 2 Files • Server.R – handles the backend • UI.R – what the user sees • Data and pictures in a separate folder • Helper files in the same folder (other scripts used to download files and feed them to the other two files)
  • 11.
    Shiny Is Function-Based(like R) • UI document starts with a function defining UI • Two main panels in the UI – and each can have a variety of objects in them (images, text, graphs, etc.) • The UI file and the Server file are mutually dependent – if a variable is named in the Server file, with the appropriate code it can be used in the UI file without any messy code in R • The server has one function with an input and output the programmer defines
  • 12.
  • 13.
    Conclusions • It’s reallyeasy to get involved with machine learning – just download a program, input the necessary settings, and then go! • As datasets and their analysis become more popular, it’s important to find a tool to reliably show “what’s important” about the data or “why should I care” – and Shiny (R) fills that niche simply because it’s easy to use • ML is clearly “the next big thing,” and it’s always exciting to be at the forefront of such a novel technology