Download to read offline


![CHAPTER 2. LITERATURE REVIEW 3
may have been hidden otherwise.
Multi-dimensional data visualization is a very active research area that goes back many
years [68]. In this survey we have focused on 2D multi-dimensional data visualization tech-
niques, because 2D visualizations will make it easy for the users to analyze and interact with
the data as 2D surfaces present a surface that more familiar to users and is easy to navigate.
There are multiple challenges that needs overcoming in multidimensional data visualiza-
tion. Finding a good visualization includes finding a good compromise that can overcome
some of these challenges are
• Mapping - Finding a good mapping from a multi-dimensional space to a two di-
mensional space is not a simple task. The final representation of the data should be
intuitive and interpretable. Users should be able to identify patterns and trends in the
multi-dimensional data using the two dimensional representation.
• Large amounts of data - Modern dataset contain very large amounts of data that
can lead to very dense data visualizations. This causes the loss of information in the
visualization because the users lose the ability to distinguish between small differences
in the data.
• Dimensionality - Displaying the information of multiple dimensions in two dimen-
sional space can also lead to very dense and cluttered visualizations. Techniques need
to be developed to allow users to reduce the clutter and identify important informa-
tion in the data. Techniques such as principle component analysis [29] can help in
identifying important dimensions in the data.
• Assessing effectiveness - Information needs from data varies widely with each data
set. So there is no silver bullet in visualization technique that can solve all the problem.
Different datasets and requirements can yield to varying visualization methods. There
is no method to access the effectiveness of a visualization method over another so there
is process that can be followed to come up with a visualization method that works for
any dataset.
Further according to E.R. Tufte [62] a good visualization comprises of below qualities
• Show data variations instead of design variations. This quality encourages the viewer
to think about the substance rather than about methodology, graphic design, the tech](https://image.slidesharecdn.com/vivaranafypreport-160508132741/85/Vivarana-fyp-report-10-320.jpg)
![CHAPTER 2. LITERATURE REVIEW 4
of graphic production, etc. One way to achieve this quality in a visualization is to have
a high data-to-ink ratio[10] and a high data density.
• Clear, detailed and thorough labeling and appropriate scales. A visualization can use
layering and separation techniques to show the labels of the data items
• Size of the graphic effect should be directly proportional to the numeric quantities. This
can be achieved by avoiding chart junks such as unnecessary 3D, shadowing effects and
by reducing the lie factor[37]
In-order to make the visualization more user friendly, a number of interaction techniques
have been proposed [33]. It should be noted that that the behavior of these interaction tech-
niques differ from one visualization technique to another. However, interaction techniques
allows the user to directly interact with the visualization and to change the visualization
according to the exploration objective. Below list contains the major interactive techniques
we have identified.
• Dynamic Projections
Dynamic projection means dynamically changing the projection in-order to explore
a multidimensional data set. A classic example would be the Grand Tour [3] which
tries to show all interesting pairs of dimensions of a multidimensional dataset as a
series of scatter plots. However, the sequence of projection can be random, manual,
pre-computed, or even data driven depending on the visualization technique.
• Interactive Filtering
When exploring large dataset interactively partitioning and focusing on interesting
subsets is a must. This can be achieved through direct selection of the desired subset
(browsing) or through specifying the properties of the desired subset (querying). How-
ever, browsing and querying becomes difficult and inaccurate respectively when the
dataset becomes larger. As a solution to this problem a number of techniques such as
Magic Lens [5], InfoCrystal [54] have been developed in order to improve interactive
filtering in data exploration.
• Interactive Zooming
Zooming is used in almost all the interactive visualizations. When dealing with large
amount of data, sometimes the data is highly compressed in-order to provide an](https://image.slidesharecdn.com/vivaranafypreport-160508132741/85/Vivarana-fyp-report-11-320.jpg)
![CHAPTER 2. LITERATURE REVIEW 6
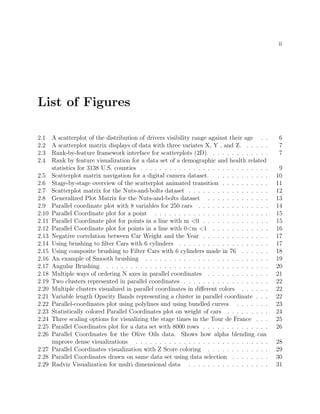
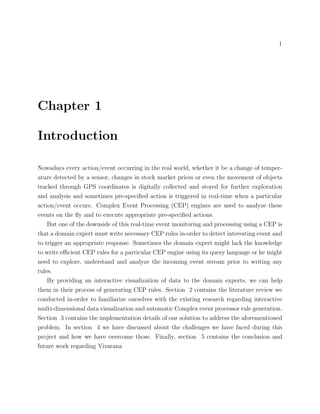
Figure 2.1: A scatterplot of the distribution of drivers visibility range against their age
single scatterplot can only depict the correlation between two dimensions. Additional limited
dimensions can be mapped to color, size or shape of the plotting points.
Advocates of 3D scatterplots argue that since the natural world is three dimensional, users
can readily grasp 3D representations. However, there is substantial empirical evidence that
for multidimensional ordinal data (rather than 3D real objects such as chairs or skeletons),
users struggle with occlusion and the cognitive burden of navigation as they try to find desired
viewpoints [51]. Advocates of higher dimensional displays have demonstrated attractive
possibilities, but their strategies are still difficult to grasp for most users.
Since two-dimensional scatterplot presentation offer ample power while maintaining com-
prehensibility, many variations have been proposed. One of the method used to visualize
multivariate data using 2D scatterplots is scatterplot matrix (SPLOM) [68].
Each individual plot in the SPLOM is identified by its row and column number in the
matrix [68]. For example, the identity of the upper left plot of the matrix in Figure 2.2 is
(1 , 3) and the lower right plot is (3, 1). The empty diagonals displays the variable names.
Plot (2, 1) is the scatter plot of parameter X against Y while plot (1 , 2) is the reverse, i.e.
Y versus X.
One of the major disadvantage of SPLOM is that as the number of dimensions of the
data set grow the n-by-n SPLOM grows and each individual scatterplot in the SPLOM will
have less space. Following frameworks provide a solution to that problem by incorporating
interactive techniques with the traditional SPLOM.](https://image.slidesharecdn.com/vivaranafypreport-160508132741/85/Vivarana-fyp-report-13-320.jpg)
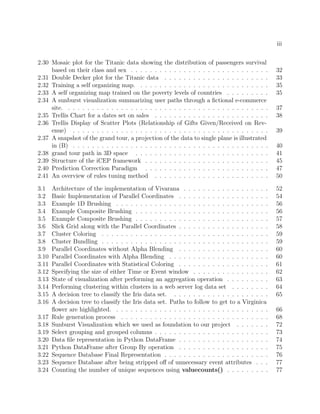
![CHAPTER 2. LITERATURE REVIEW 7
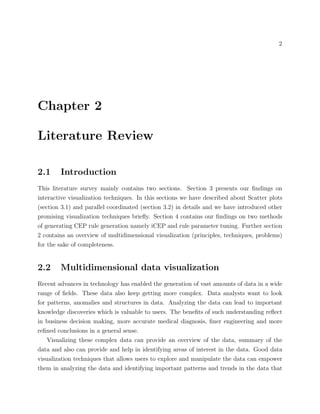
Figure 2.2: A scatterplot matrix displays of data with three variates X, Y , and Z.
Figure 2.3: Rank-by-feature framework interface for scatterplots (2D).
Rank-by-feature framework
Many variations have been proposed to the initial SPLOM to enhance its interactivity and
interpretability. One such enhancement is presented with the rank-by-feature framework [51].
Instead of directly visualizing the data point against all pairs of dimensions, this framework
allows the user to select an interesting ranking criterion which will be described later in this
section.
Figure 2.3 shows a dataset of demographic and health related statistics for 3138 U.S.
counties with 17 attributes, visualized through the rank-by-feature framework and its in-
terface consists of four coordinated components: control panel (Figure 3A), score overview
(Figure 2.3B), ordered list (Figure 2.3C), and scatterplot browser (Figure 2.3D).](https://image.slidesharecdn.com/vivaranafypreport-160508132741/85/Vivarana-fyp-report-14-320.jpg)
![CHAPTER 2. LITERATURE REVIEW 8
User can select an ordering criterion in the control panel (Figure 2.3A), and the ordered
list (Figure 2.3C) shows the pairs of dimensions (scatterplots) sorted according to the score
of the criteria with the scores color-coded on the background. But users cannot see an
overview of entire relationships between variables at a glance in the ordered list. Hence
the score overview (Figure 2.3B), an m-by-m grid view where all dimensions are aligned
in the rows and columns has been implemented. Each cell of score overview represents a
scatterplot whose horizontal and vertical axes are dimensions at the corresponding column
and row respectively.
Since this matrix is symmetric, only the lower-triangular part is shown. Each cell is col-
orcoded by its score value using the same mapping scheme as in ordered list. The scatterplot
corresponding to the cell is shown in the scatterplot browser (Figure 2.3D) simultaneously,
and the corresponding item is highlighted in the ordered list (Figure 2.3C). In the scatterplot
browser, users can quickly take a look at scatterplots by using item sliders attached to the
scatterplot view.
Simply by dragging the vertical or horizontal item slider bar, users can change the di-
mension for either the horizontal or vertical axis respectively while preserving the other
axis.
Below list contains the ranking criterions suggested by this framework.
• Correlation coefficient (-1 to 1): The Pearsons correlation coefficient (r) for a scatterplot
(S) with n points [46] is defined in Equation 1
Pearsons r is a number between -1 and 1. The sign and magnitude tells the direction and
the strength of the relationship respectively. Although correlation doesnt necessarily
imply causality, it can provide a good clue to the true cause, which could be another
variable. Linear relationships are more common and simple to understand. As a visual
representation of the linear relationship between two variables, the line of best fit or
the regression line is drawn over scatterplots.
• Least square error for curvilinear regression (0 to 1)
This criterion sort scatterplots in terms of least-square errors from the optimal quadratic
curve fit so that the user can isolate the scatterplots where all points are closely/loosely
arranged along a quadratic curve. In some scenarios it might be interesting to find non-
linear relationships in the data set in addition to linear relationship.
• Quadracity (0 to infinity)](https://image.slidesharecdn.com/vivaranafypreport-160508132741/85/Vivarana-fyp-report-15-320.jpg)
![CHAPTER 2. LITERATURE REVIEW 9
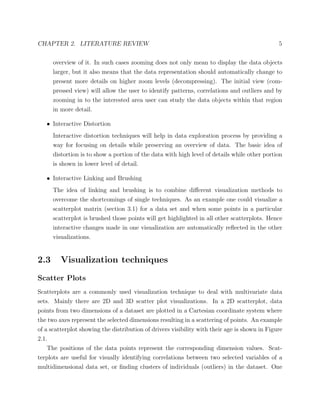
Figure 2.4: Rank by feature visualization for a data set of a demographic and health related
statistics for 3138 U.S. counties
The ”Quadricity” criterion is added to emphasize the real quadratic relationships. It
ranks scatterplots according to the coefficient of the highest degree term, so that users
can easily identify ones that are more quadratic than others.
• The number of potential outliers (0 to n)
Distance-based outlier detection methods such as DB-out [36] or Density based outlier
detection methods such as Local Outlier Factor (LOF)-based method [6] can be used to
detect outliers in a scatterplot and rank by-feature framework uses LOF-based method
(Figure 2.4), since it is more flexible and dynamic in terms of outlier definition and
detection. The outliers are highlighted with yellow triangles in the scatterplot browser
view.
• The number of items in the region of interest (0 to n)
This criterion allows the user to draw a free-formed polygon region of interest on the
scatterplot. Then the framework will use the number of data points in the region to
order all scatterplots so that user can easily find the ones with most/least number of
items in the specified region.
• Uniformity of scatterplots (0 to infinity)
To calculate this criterion the two-dimensional space is divided into regular grid cells
and then each cell is used as a bin. For example, if k-by-k grid has been generated,
the entropy of a scatterplot S would be
Where Pij is the probability that an item belongs to the cell at (i, j) of the grid.](https://image.slidesharecdn.com/vivaranafypreport-160508132741/85/Vivarana-fyp-report-16-320.jpg)
![CHAPTER 2. LITERATURE REVIEW 10
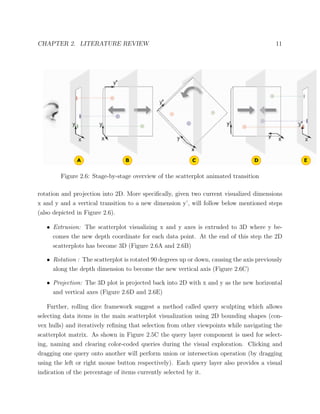
Figure 2.5: Scatterplot matrix navigation for a digital camera dataset.
Rolling Dice Framework
Rolling dice is another framework which utilizes SPLOM to visualize multidimensional data
[13]. In this framework, transitions from one scatterplot to another is performed as animated
rotations in 3D space, similar to a rolling dice. Rolling dice framework suggest a visual
querying technique so that a user can refine his requirement by exploring how the same
query would result in any scatterplot.
The interface proposed by the framework mainly consist of three components: Scatter-
plot component (Figure 2.5B), scatterplot matrix component (Figure 2.5A) and query layer
component (Figure 2.5C). The scatterplot component shows the currently viewed cell of the
scatterplot matrix with the name and labels of the two displayed axes. The scatterplot ma-
trix component can be used both as an overview and a navigational tool. Navigation in the
scatterplot matrix is restricted to orthogonal movement along the same row or column in the
matrix so that one dimension in the focused scatterplot is always preserved while the other
changes. The change is visualized using a 3D rotation animation which gives a semantic
meaning to the movement of the points, allowing human mind to interpret the motion as
shape [64].
The transition of scatterplots is performed as a three-stage animation: extrusion into 3D,](https://image.slidesharecdn.com/vivaranafypreport-160508132741/85/Vivarana-fyp-report-17-320.jpg)
![CHAPTER 2. LITERATURE REVIEW 12
Figure 2.7: Scatterplot matrix for the Nuts-and-bolts dataset
Shortcomings of Scatterplot Matrix (SPLOM)
In-order to discuss the shortcomings of SPLOM let’s consider a fictitious ”nuts-and-bolts”
dataset. This dataset shown in Table 1 involves 3 (independent) categorical variables: Region
(North, Central, and South), Month (January, February...), and Product (Nuts or Bolts).
It also consists of 3 (dependent) continuous variables: Sales, Equipment costs, and Labor
costs.
Figure 2.7 shows the SPLOM for the ”nuts-and-bolts” dataset and the top three scat-
terplots (e.g. Month vs Region) each show a crossing of two categorical variables, resulting
in an uninformative grid of points. Further, scatterplots showing continuous vs categorical
variables suffers from over plotting (e.g.: Sales vs. product)
In-order to overcome this issue Generalized Plot Matrix (GPLOM) [27] has been pro-
posed. In the GPLOM it is suggested to use heatmaps to visualize pairs of categorical
variable, bar-charts to visualize continuous vs categorical variables and scatterplots to visu-
alize pairs of continuous variables. It is important to note that in this scenario scatterplots](https://image.slidesharecdn.com/vivaranafypreport-160508132741/85/Vivarana-fyp-report-19-320.jpg)
![CHAPTER 2. LITERATURE REVIEW 13
Figure 2.8: Generalized Plot Matrix for the Nuts-and-bolts dataset
show individual tuples, whereas the barchars and heatmaps show aggregated data. Figure
2.8 shows the GPLOM for the nuts-and-bolts dataset. Even though GPLOM is a better
choice than SPLOM to visualize a combination of continuous and categorical variables, since
it uses 3 types of charts it loses the consistency of the matrix.
Parallel Coordinates
Parallel coordinates introduced by Inselberg and Dimsdale [28][30] is a popular technique
for transforming multidimensional data into a 2D image. The m-dimensional data items
are represented as lines crossing m parallel axes, each axis corresponding to one dimension](https://image.slidesharecdn.com/vivaranafypreport-160508132741/85/Vivarana-fyp-report-20-320.jpg)
![CHAPTER 2. LITERATURE REVIEW 14
Figure 2.9: Parallel coordinate plot with 8 variables for 250 cars
of the original data. Fundamentally parallel coordinates differ from all other visualization
methodologies since it yields graphical representation of multidimensional data rather than
just visualizing a finite set of points .
Figure 2.9 displays Parallel Coordinate plot with 8 variables using a dataset which con-
tains information about cars such as economy (mpg), cylinders, displacement (cc)and etc.
for a selected sample of cars manufactured within 1970 to 1982.
Definition and Representation
On the plane with xy-Cartesian coordinates starting on the y-axis, N copies of the real line,
labeled x1,x2,x3..... xn are places equi-distant and perpendicular to the x axis, They are the
axes of the parallel coordinate system for Euclidean N-Dimensional Space RN
all having the
same positive orientation as the y axis. [28]
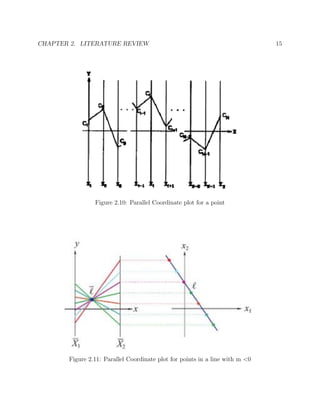
In the figure 2.10 it is shown how a point C with coordinates (c1, c2, c3.......cn) can be
represented by a polygonal line. As in the aforementioned way m number of data points can
be represented by m polygonal lines.
For lines with negative slope (m < 0) the interesting point lies between the axes as in
Figure 2.11.
For m > 1 the intersecting point lies left of the X1 axis while intersecting point for the
lines with m (0 < m < 1), lies right of the X2 axis as in the Figure 2.12
The above property can be considered as one of the main advantages in parallel coor-
dinates. Parallel Coordinates representations can provide statistical data interpretations.
In the statistical setting, the following interpretations can be made: For highly negatively
correlated pairs, the dual line segments in Parallel Coordinates tend to cross near a single](https://image.slidesharecdn.com/vivaranafypreport-160508132741/85/Vivarana-fyp-report-21-320.jpg)
![CHAPTER 2. LITERATURE REVIEW 16
Figure 2.12: Parallel Coordinate plot for points in a line with 0<m <1
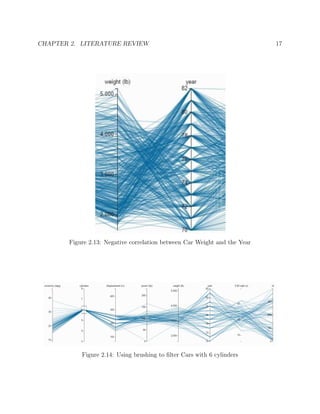
point between the two Parallel Coordinates axes. Parallel or almost parallel lines between
axes indicate positive correlation between variables [49] [60]. For an example we can see that
there is a highly negative correlation between weight and year in the Figure 2.13.
Over the years parallel coordinates have been enhanced by multiple people. Data Sci-
entists have been working on improving this technique for better data investigation and for
easier, user-friendly interaction by adding brushing, data clustering, real-time re-ordering of
coordinate axes, etc.
Brushing
Brushing is considered to be a very effective technique for specifying an explicit focus during
information visualization [20]. The user actively marks subsets of the data-set as being
especially interesting and the points that are contained by the brush are colored differently
from other points to make them standout [42]. For example if the user is interested in cars
having 6 cylinders he can use brushing as depicted in the Figure 2.14.
The introduction of composite brushes [42] allows users to more specifically define their
focus. Composite brushes are a combination of single brushes which result the conjunction
of those single brushes. For an example if the user is interested in cars having 6 cylinders
that were produced on 76 he can use composite brushing as depicted in Figure 2.15.
Brushing technique we have seen up to now uses a discrete distinction between focus and](https://image.slidesharecdn.com/vivaranafypreport-160508132741/85/Vivarana-fyp-report-23-320.jpg)
![CHAPTER 2. LITERATURE REVIEW 18
Figure 2.15: Using composite brushing to Filter Cars with 6 cylinders made in 76
context. With that we dont understand the similarity of other data points to the focused
data points. The solution that had brought forward for this is called smooth brushing [20]
where a multi-valued or even continuous transition is allowed, which inherently supports the
similarity between data-points in focus and their context. This corresponds to a degree-
of-interest (DOI) function which non-binarily maps into the [0, 1] range. Often, such a
non-binary DOI function is defined by means of spatial distances, i.e., the DOI-value reflects
the distance of a data-point from a so-called center-of interest.
The standard brushing primarily acts along the axes, but the technique called angular
brushing enables the space between axes for brushing [20]. The user can interactively specify
a sub-set of slopes which then yields all those data-points to be marked as part of the current
focus, which exhibit the matching correlation in between the brushed axes. For an example
if the user is interested on data that only has a negative correlation between Horsepower
and Acceleration he can use angular brushing as shown in Figure 2.17.
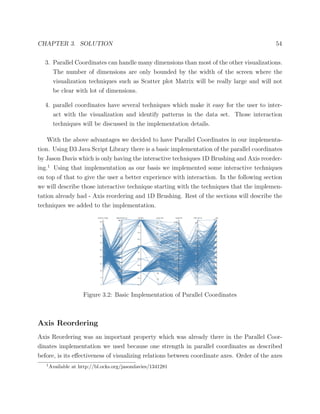
Axis Reordering
One strength of parallel coordinates as described in section 3.2.1, is its effectiveness of visual-
izing relations between coordinate axes. By bringing axes next to each other in an interactive
way, the user can investigate how values are related to each other with special respect to two
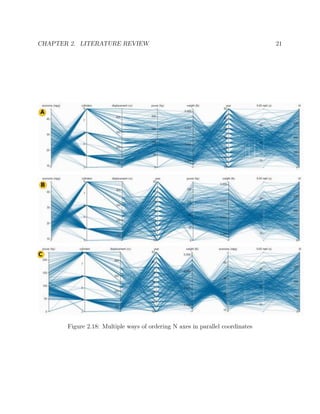
of the data dimensions. Order of the axes clearly affects the patterns revealed by parallel
coordinate plots. Figure 2.18 shows 3 ways out of N! (N = 8 in this case) ways of reordering
axes. But only the plot C in Figure 2.18 is capable of showing that there is a highly negative
correlation between weight and economy.
Many Researchers address this problem using some measure to score an order of axes while
others discuss how to visualize multiple orderings in a single display [21]. Many approaches
for this which are based on the combination of Nonlinear Correlation Coefficient and Singular](https://image.slidesharecdn.com/vivaranafypreport-160508132741/85/Vivarana-fyp-report-25-320.jpg)
![CHAPTER 2. LITERATURE REVIEW 19
Figure 2.16: An example of Smooth brushing
Value Decomposition algorithm are suggested. By using these approaches, the first Many
Researchers address this problem using some measure to score an order of axes while others
discuss how to visualize multiple orderings in a single display [24]. Many approaches for this
which are based on the combination of Nonlinear Correlation Coefficient and Singular Value
Decomposition algorithm [25] are suggested. By using these approaches, the first remarkable
axe can be selected based on mathematics theory and all axis are re-ordered in line with the
degree of similarities among them [39].
Data Clustering
Parallel Coordinates are a good technique to show clusters in the data set. There are many
techniques that researchers have used to show clusters in parallel coordinates.
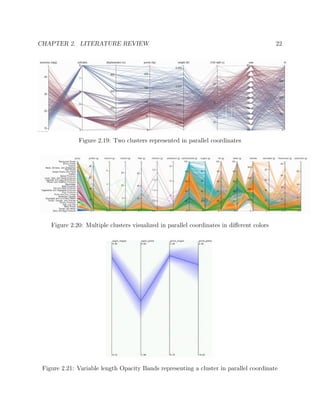
Coloring is one method that has been used to show clusters in parallel coordinates [17].
Different colors will be assigned to different clusters. As in the figure 2.19 it shows two](https://image.slidesharecdn.com/vivaranafypreport-160508132741/85/Vivarana-fyp-report-26-320.jpg)
![CHAPTER 2. LITERATURE REVIEW 20
Figure 2.17: Angular Brushing
clusters that had been given explicitly is represented with 2 different colors.
Figure 2.20 shows the same cluster visualization technique for more many clusters for the
data set taken from USDA National Nutrient Database.
Variable length Opacity bands [17] is another technique of showing clusters in Parallel
Coordinates. Figure 2.21 shows a graduated band faded from a dense middle to transparent
edges that visually encodes information for a cluster. The mean stretches across the middle
of the band and is encoded with the deepest opacity. This allows the user to differentiate
sparse, broad clusters and narrow, dense clusters. The top and bottom edges of the band
have full transparency. The opacity across the rest of the band is linearly interpolated. The
thickness of the band across each axis section represents the extents of the cluster in that
dimension.
Curved bundling [40] is also used to visualize clusters in parallel coordinates. Bundled](https://image.slidesharecdn.com/vivaranafypreport-160508132741/85/Vivarana-fyp-report-27-320.jpg)
![CHAPTER 2. LITERATURE REVIEW 23
Figure 2.22: Parallel-coordinates plot using polylines and using bundled curves
curve plots extend the traditional polyline plots and are designed to reveal the structure
of clusters previously identified in the input data. Given a data point (P1, P2,...,PN ),its
corresponding polyline is replaced by a piecewise cubic Bezier curve preserving following
properties. (Denote the main axes by X1, X2, X3 XN to avoid the confusion between them
and the added axes.)
• The curve interpolates P1, P2,..., PN at the main axes
• Curves corresponding to data points that belong to the same cluster are bundled be-
tween adjacent main axes. This is accomplished by inserting a virtual axis midway
between the main axes and by appropriately positioning the Bzier control points along
the virtual axis. To support curve bundling, control points that define curves within
the same cluster are attracted toward a cluster centroid along the virtual axis.
Figure 2.22 compares a polyline plot with its counterpart using bundled curves. Polylines
require color coding to distinguish clusters, whereas curve bundles rely on geometrical prox-
imity to naturally represent cluster information. The cluttered visualization in color-coded
polylines, which is the standard approach to cluster-membership visualization, motivates the
new geometry based method.
Bundling violates the point-line duality discussed in section 3.2.1, but can be used to
visualize clusters using geometry only, leaving the color channel free for other uses such as
statistical coloring which is described in section 3.2.6. To adjust the shape of Bzier curves
there are many algorithms proposed by many researchers [40], [22], [69].](https://image.slidesharecdn.com/vivaranafypreport-160508132741/85/Vivarana-fyp-report-30-320.jpg)
![CHAPTER 2. LITERATURE REVIEW 24
Figure 2.23: Statistically colored Parallel Coordinates plot on weight of cars
Statistical Coloring
Coloring polygonal lines can be used to display statistical coloring of axes. A popular
color scheme is to color by z-score for that dimension, so that we can understand the data
distribution of that dimension. Figure 2.23 shows how z-score coloring has been used on
weight dimension in that data set.
Scaling
Scaling of the axes are also an interesting property in the parallel coordinates. Default scaling
is to plot all values over the full range of each axis between the minimum and the maximum
of the variable. Several other scaling methods have been suggested by researchers [60]. A
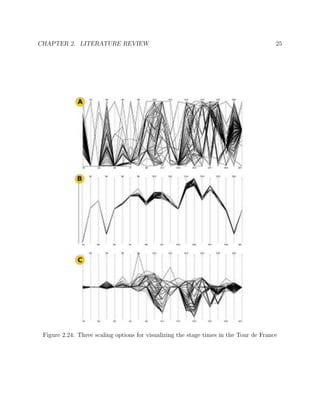
common one would be to use a common scale over all axes. Figure 2.24 shows the difference
between two scaling methods. The data taken is individual stage times of the 155 cyclists
who finished the 2005 Tour De France bicycle race. Figure 2.24A is plotted with default
scaling and Figure 2.24B is plotted using a common scale over all axes. But it is obvious
that the both Figure 2.24A and Figure 2.24B are not capable enough to reveal correlations
between axes even though Figure 2.24B shows the outliers clearly. But the spread between
the first and the last cyclist is almost invisible for most of the stages. In the Figure 2.24C,
a common scale for all stages is used, but each stage is aligned at the median value of that
stage. It is the user experience, his domain knowledge and the use case that defines the scale
and alignment on the parallel coordinates [60].](https://image.slidesharecdn.com/vivaranafypreport-160508132741/85/Vivarana-fyp-report-31-320.jpg)
![CHAPTER 2. LITERATURE REVIEW 26
Figure 2.25: Parallel Coordinates plot for a data set with 8000 rows
Limitations
Even though Parallel coordinates are a great tool to visualize high dimensional data, it soon
reached its limits. When using a very large dataset there are some identified weaknesses in
parallel coordinates such as:
1. Cross-over Problem - The zigzagging polygonal lines used for data representation are
not continuous. They generally lose visual continuation across the parallel-coordinates
axes, making it difficult to follow lines that share a common point along an axis.
2. When two or more data points have the same or similar values for a subset of the
attributes, the corresponding polylines may overlap and clutter the visualization.
Figure 2.25 depicts the aforementioned two problems - A parallel coordinate plot drawn
for 8000 data points.
Given a very large data set, with this two problems it is not easy to come to a conclusion
about the correlation in axes and brushing also will not give a clear idea about the data.
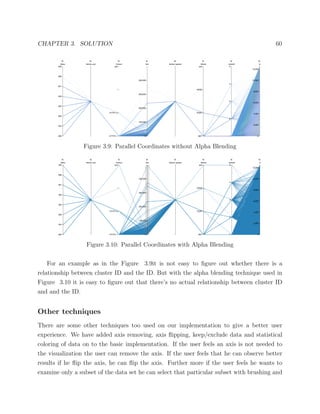
One solution to above problems is to use -blending [60]. When -blending is used, each
polygon is plotted with only percent opacity. With smaller values, areas of high line density
are more visible and hence are better contrasted to areas with a small density.
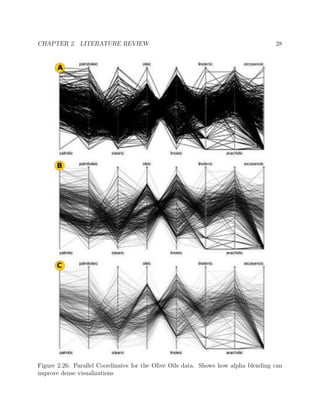
The data in Figure 2.26 are real data from Forina et al.[15] on the fatty acid content of
Italian olive oil samples from nine regions. Figure 2.26 A, B, C shows the same plot of all
eight fatty acids with -values of 0.5, 0.1, and 0.01 respectively. Depending on the amount
of - blending applied, the group structure of some of the nine regions is more or less visible
[60].](https://image.slidesharecdn.com/vivaranafypreport-160508132741/85/Vivarana-fyp-report-33-320.jpg)
![CHAPTER 2. LITERATURE REVIEW 27
It is hard to come to a conclusion about a value for . The user must adjust the value
until the graph gain enough insight.
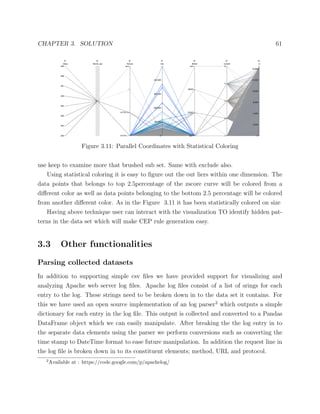
Clustering and statistical coloring were mentioned in the sections 3.2.5 and 3.2.6 will also
reduce the weaknesses in Parallel Coordinates.
As in the Figure 2.27, point line duality is preserved more when statistical coloring is
used. Data preprocessing techniques can also be used to overcome the limitations in parallel
coordinates: data selection and data aggregation. Data selection means that a display does
not represent a dataset as a whole but only a portion of it, which is selected in a certain
way [30].The display is supplied with interactive controls for changing the current selection,
which results in showing another portion of the data [1].
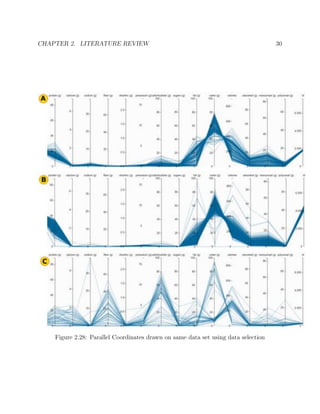
The Figure 2.28 shows how to display portion of the data and to overcome the weaknesses
in Parallel Coordinates. The Figure 2.28A only displays food group of sausages and luncheon
meats. Respectively, Figure 2.28B and Figure 2.28C displays food groups of beef products
and spices and herbs, which is a better visualization than visualizing whole data set.
Data aggregation reduces the amount of data under visualization by grouping individual
items into subsets, often called aggregates, and some collective characteristics of the aggre-
gates can be computed. The aggregates and their characteristics (jointly called aggregated
data) are then explored instead of the original data. For an example in parallel coordinates
there is just one polygonal line for the whole cluster so that mentioned limitations at the
beginning of this section will be reduced.
Parallel Coordinates might be the least affected plot from curse of dimensionality since
it can represent many dimensions as long as the screen width permits. But that also comes
to a limitation when it comes to high dimensional data because the distance d between
two coordinates gets decreased with the increase in number of dimensions. As a result the
correlation between axes might not be clear in the plot. Most of the applications assume it is
up to the user to decide which attributes should be kept in, or removed from a visualization.
This approach will not be a good approach for a user who does not have domain knowledge,
parallel coordinates itself can be used to reduce dimensions of the data set [2].
When we were discussing about axis reordering in section 3.2.4 we talked about getting
a measure to the axis similarity. Once the most similar axes are identified through that
algorithm the application can suggest user to remove them and keep one significant axe to
all those identified similar axes [2]. In that way redundant attributes can be removed from
the visualization and the space can be used efficiently to represent the remaining attributes.](https://image.slidesharecdn.com/vivaranafypreport-160508132741/85/Vivarana-fyp-report-34-320.jpg)
![CHAPTER 2. LITERATURE REVIEW 29
Figure 2.27: Parallel Coordinates visualization with Z Score coloring
Parallel Coordinates are a good technique to visualize data. It support many user in-
teractions and data analytic techniques. Even though it has limits researchers have found
many ways to overcome those limitations. Parallel Coordinates are still a hot topic for data
visualization research work.
Radviz
The Radviz (Radial Visualization) visualization method [23] maps a set of n dimensional
data points onto a two dimensional space. All dimensions are represented by a set of equally
spaced anchor points on the circumference of a circle.
For each data instance, imagine a set of springs that connects the data point to the
anchor point for each dimension. The spring constant for the spring that connects to the ith
anchor corresponds to the value of the ith
dimension of the data instance. Each data point
is then displayed where the sum of all the spring forces equals 0. All the data point values
are usually normalized to have values between 0 and 1.
Consider the example in Figure 2.29.A, this data has 8 dimensions d1,d2. dn. Each
data point is connected as shown in the diagram using springs. Following this procedure
for all the records in the dataset leads to the Radviz display. Figure 2.29.B shows a Radviz
representation for a dataset on transitional cell carcinoma (TCC) of the bladder generated
by Clifford Lab at LSUHSC-S [58].
One major disadvantage of this method is the overlap of points. Consider the following
two points on a 4 dimensional data space, (1, 1 , 1, 1) and (10, 10, 10, 10). These two data
records will overlap in a Radviz display even though they are clearly different because the](https://image.slidesharecdn.com/vivaranafypreport-160508132741/85/Vivarana-fyp-report-36-320.jpg)
![CHAPTER 2. LITERATURE REVIEW 31
Figure 2.29: Radviz Visualization for multi dimensional data
dimensions pull them both equally.
Categorical dimensions cannot be visualized with Radviz and require additional prepro-
cessing. First each categorical dimension needs to be flattened to create a new dimension
for each possible category. This becomes problematic as the number of possible categories
increase and may lead to poor visualizations.
Another challenge in generating good visualizations with this method is identifying a
good ordering for the anchor points that correspond to the dimensions. A good ordering
needs to be found that makes it easy to identify patterns in the data. An interactive approach
that allows for changing the position of anchor points can be used to help users overcome
this issue.
Mosaic Plots
Mosaic plots [19], [16] are a popular method of visualizing categorical data. They provide a
way of visualizing the counts in a multivariate n-way contingency table. The frequencies in
the contingency table are represented by a group of rectangles whose areas are proportional
to the frequency of each cell in the contingency table.](https://image.slidesharecdn.com/vivaranafypreport-160508132741/85/Vivarana-fyp-report-38-320.jpg)
![CHAPTER 2. LITERATURE REVIEW 32
Figure 2.30: Mosaic plot for the Titanic data showing the distribution of passengers survival
based on their class and sex
A mosaic plot starts as a rectangle. Then at each stage of plot creation, the rectangles
are split parallel to one of the two axes based on the proportions of data belonging to a
category. An example of a mosaic plot is shown in Figure 2.30. It shows a mosaic plot for
the Titanic dataset, which describes the attributes of passengers on Titanic details of their
survival.
The process of creating a mosaic display can be described as below [24].
Let us assume that we want to construct a mosaic plot for p categorical variables X1,...,
Xp. Let ci be the number of categories of variable Xi, i = 1, . . . , p.
1. Start with one single rectangle r (of width w and height h), and let i = 1.
2. Cut rectangle ri−1 into ci pieces: find all observations corresponding to rectangle ri1,](https://image.slidesharecdn.com/vivaranafypreport-160508132741/85/Vivarana-fyp-report-39-320.jpg)
![CHAPTER 2. LITERATURE REVIEW 33
Figure 2.31: Double Decker plot for the Titanic data
and find the breakdown for each variable Xi (i.e., count the number of observations
that fall into each of the categories). Split the width (height) of rectangle ri1 into ci
pieces, where the widths (heights) are proportional to the breakdown, and keep the
height (width) of each the same as ri1. Call these new rectangles rji, with j = 1, . . .
,ci.
3. Increase i by 1.
4. While i <= p, repeat steps 2 and 3 for all rji1 with j =1 , . . . ,ci1
In standard mosaic plots the rectangle is divided both horizontally and vertically. A
variation of mosaic plots that only divide the rectangle horizontally has been proposed called
Double Decker plots [19]. These can be used to visualize association rules. An example of a
double decker plot is show in Figure 2.31 for the same data as in Figure 2.30. There are other
variations of mosaic plots such as fluctuation diagrams that try to increase the usability of
them.
Mosaic plots are an interesting visualization technique for categorical data but they can’t
handle continuous data. To display continuous data using a mosaic plot the data needs to
be first converted to categorical through a process such as binning. Mosaic plots require
the visual comparison of rectangle and their sizes to understand the data. But this becomes](https://image.slidesharecdn.com/vivaranafypreport-160508132741/85/Vivarana-fyp-report-40-320.jpg)
![CHAPTER 2. LITERATURE REVIEW 34
complicated as the number of rectangles increase and the distance between two increases. So
they are harder to interpret and understand. Vastly different aspect ratios of the rectangles
also compound the difficulty in comparing their sizes.
Another issue with Mosaic plots is that they become more complex as the number of
dimensions in the data increase. Each additional dimension requires the rectangles to be split
again which at least doubles the possible number of rectangles leading to a final visualization
that is not very user friendly.
Self Organizing Maps
Self-organizing maps (SOM) [58] is a type of neural network that has been used widely in
data exploration and visualization among its many other uses. SOMs use an unsupervised
learning algorithm to perform a topology preserving mapping from a high dimensional data
space to a lower dimensional map (usually a two dimensional lattice). The mapping preserves
the topology of the high dimensional data space such that data points lying near each other
in the original multidimensional space maps to nearby units in the output space.
Generating self-organizing maps consists of training a set of neurons with the dataset. At
each step of the training an input data item is matched against the neurons from which the
closest one is chosen as the winner. Then the weights of the winner and the neighborhood
of the winner is updated to reinforce this behavior. the final result is a topology preserving
ordering where similar new data entry will match to neurons nearer to each other.
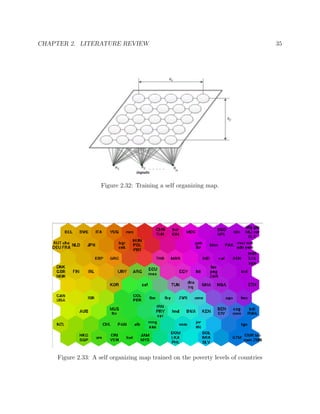
An example of a self-organizing map is shown in Figure 2.33. This shows a self-organizing
map trained on the poverty levels of countries [31]. As can be seen clearly countries with
similar poverty levels got matched to neurons close to each other. USA, Canada and other
countries with lower poverty are together in the yellow and green areas while countries such
as Afghanistan and Mali which have high poverty levels are grouped together in the purple
areas. This shows the topology preserving aspect of SOMs.
There are some challenges with using self-organizing maps for multidimensional data
visualization.
1. SOMs are not unique. The same data can lead to widely different outcomes based on
the initialization of the SOM. So the same data may yield different visualizations and
lead to confusion.](https://image.slidesharecdn.com/vivaranafypreport-160508132741/85/Vivarana-fyp-report-41-320.jpg)
![CHAPTER 2. LITERATURE REVIEW 36
2. While similar data points are grouped together in SOMs, similar groups are not guar-
anteed to be close to each other. Some SOMs may be created that have similar groups
in multiple places in the map.
3. SOMs are not very user friendly when compared with other visualization techniques.
Its not easy to look at a SOM and interpret the data.
4. The process of creating a SOM is computationally expensive. The computational
requirements grow as the dimensionality of data increases. In modern data sources
that are highly complex and detailed this becomes a major drawback.
Sunburst Visualization
The Sunburst technique, like Tree Map [65] is a space-filling visualization that uses a radial
rather than a rectangular layout to visualize hierarchical information [55]. It is comparable
to a nested pie charts. It can be used to show hierarchical information such as elements of
a decision tree. This compact visualization avoids the problem of decision trees getting too
wide to fit the display area. Its akin to visualizing the tree in a top down manner. The
center represents the root of the decision tree and the ring around it as its children.
In SunBurst, the top of the hierarchy is at the center and deeper levels farther away from
the center. The angle swept out by an item and its color correspond to some attribute of
the data. For instance, in a visualization of a file system, the angle may correspond to the
file/directory size and the color may correspond to the file type. An example Sunburst display
is shown in Figure 2.34. This visualization has been used to summarize user navigation paths
through a website [48]. Further this visualization has been used to visualize frequent item
sets [34].
Trellis Visualization
Trellis chart Also known as: Small Multiples [61], Panel Chart, Lattice Chart, Grid Chart,
is a layout of smaller charts in a grid with consistent scales. Each smaller chart represents
an item in a category, named conditions [67]. The data displayed on each smaller chart is
conditional on items in the category. Trellis Charts are useful for finding the structure and
patterns in complex data. The grid layout looks similar to a garden trellis, hence the name
Trellis Chart.](https://image.slidesharecdn.com/vivaranafypreport-160508132741/85/Vivarana-fyp-report-43-320.jpg)
![CHAPTER 2. LITERATURE REVIEW 37
Figure 2.34: A sunburst visualization summarizing user paths through a fictional e-commerce
site.
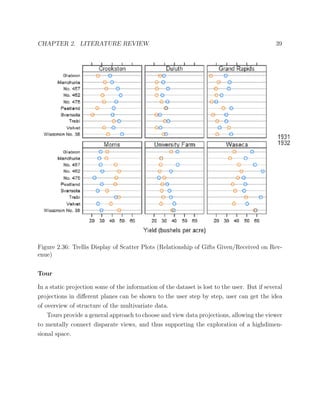
Main aspects of trellis displays are columns, rows, panels and pages [46]. The figure 2.35
consists of 4 columns, 1 row, 4 panels and 1 page. Trellised visualizations enable the user
to quickly recognize similarities or differences between different categories in the data. Each
individual panel in a trellis visualization displays a subset of the original data table, where
the subsets are defined by the categories available in a column or hierarchy. To make plots
comparable across rows and columns, the same scales are used in all the panel plots [59].
Benefits of trellis chart are;
• They are easy to understand. A Trellis Chart is a basic chart type repeated many
times. If you understand the basic chart type, you can understand the whole Trellis](https://image.slidesharecdn.com/vivaranafypreport-160508132741/85/Vivarana-fyp-report-44-320.jpg)
![CHAPTER 2. LITERATURE REVIEW 38
Figure 2.35: Trellis Chart for a dates set on sales
Chart.
• Having many small charts enables you to view complex multi-dimensional data in a
flat 2D layout avoiding the need for confusing 3D charts.
• The grid layout combined with consistent scales makes data comparison simple. Just
look up/down or across the charts.
Figure 2.36 contains a trellis chart for Minnesota Barley Data from The Design of Exper-
iments [14] by R.A. Fisher. The trial involved planting: 10 varieties of barley, in 6 different
sites over two different years. The researchers measured yield in bushels per acre for each of
the 120 possibilities.
Grand Tour
Grand tour is one of the tour methods which is used to find structure of multidimensional
data. This method can be applied to show multidimensional data in a 2D computer display.
Tour is a subset of all the possible projections of multidimensional data. The different tour
methods combine several static projections using different interpolation techniques into a
movie, which is called a tour [9].](https://image.slidesharecdn.com/vivaranafypreport-160508132741/85/Vivarana-fyp-report-45-320.jpg)
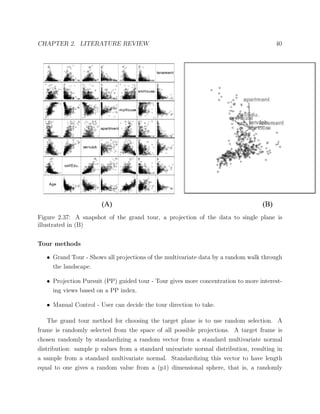
![CHAPTER 2. LITERATURE REVIEW 41
Figure 2.38: grand tour path in 3D space
generated projection vector. Do this twice to get a 2D projection, where the second vector
is orthonormalized on the first. Figure 2.38 illustrates the tour path.
The solid circle in Figure 2.38 indicates the first point on the tour path corresponding
to the starting frame. The solid square indicates the last point in the tour path, or the
last projection computed. Each point corresponds to a projection from 3 dimensions to one
dimension. The projection will look as if the data space is viewed from that direction. In
grand tour this point is chosen randomly.
2.4 CEP Rule generation
Recent advances in technology has enabled the generation of vast amounts of data in a
wide range of fields. This data is created continuously in large quantities overtime as data
streams. Complex Event Processing (CEP) can be used to analyze and process these large
data streams to identify interesting situations and respond to them as quickly as possible.
Complex event processors are used in almost every domain : vehicular traffic analysis,
network monitoring, sensor details analyzing [7], analyzing trends in stock market [11], fraud](https://image.slidesharecdn.com/vivaranafypreport-160508132741/85/Vivarana-fyp-report-48-320.jpg)
![CHAPTER 2. LITERATURE REVIEW 42
detection [50]. Any system that requires real time monitoring can use a complex event
processor.
In CEP, the processing takes place according to user-defined rules, which specify the
relations between the observed events and the actions required by the user. For an example
in a network monitoring system a complex event processor can be used to notify the system
admin about an excessive internet usage of an user in that particular network. An example
rule will look like this,
Where if a user’s bandwidth exceeds the limit, the admin will receive a notification. The
value of the ”limit” in this example should be low enough to catch high usage as well as it
should be high enough to ignore normal users.
Any complex event processing rule will have a condition to check, and an action associated
with that condition. So regardless of the domain, any system using a CEP heavily depends
on the rules defined by the user.
In current complex event processing applications, users need to manually specify the
rules that are used to identify and act on important patterns in the event streams. This is
a complex and arduous task that is time consuming, includes a lot of trial and error and
typically requires domain specific information that is hard to identify accurately.
So the rule writing is typically done by domain experts who study the parameters available
in the event streams manually or using external data analysis tools to identify the events that
need to be specially handled. Needless to say that incorrect estimation of relevant parameters
in the rules negatively impacts the utility of the systems that depend on accurate processing
of these events. Even for domain experts manually specifying textual rules in CEP specific
rule language is not a very user friendly experience. Maintaining the system after a rule is
specified to provide the same functionality through changing data and behavior may require
periodical updates to the specified rule that may require the same effort as initially spent.
Several approaches [41], [63], [44] have been proposed to overcome these difficulties using
data mining and knowledge discovery techniques to generate rules based on available data.
This provide users the ability to automatically generate rules based on their requirements.
Two approaches have been proposed that can help in generating CEP rules. One is Using
a framework that learns, from historical traces, the hidden causality between the received
events and the situations to detect, and uses them to automatically generate CEP rules
[41]. Another approach is to use a skeleton of the rule and use historical traces to tune the
parameters of the final rule [63].](https://image.slidesharecdn.com/vivaranafypreport-160508132741/85/Vivarana-fyp-report-49-320.jpg)
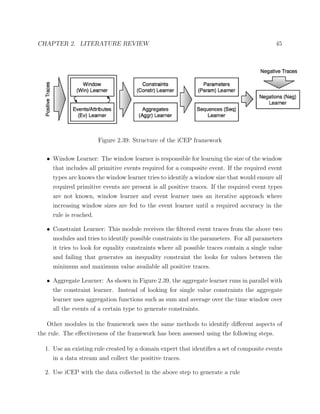
![CHAPTER 2. LITERATURE REVIEW 43
iCEP
iCEP [41] analyzes historical traces and learns from them. It adopts a highly modular design,
with different components considering different aspects of the rule.
Following terminology and definitions are used in the framework.
Each event notification is assumed to be characterized by a type and a set of attributes.
The event type defines the number, order, names, and types of the attributes that compose
the event itself. It is also assumed that events occur instantaneously at some points in time.
Accordingly, each notification includes a timestamp, which represents the time of occurrence
of the event it encodes. Author of the paper uses the following example event of type Temp.
Temp@10(room=123, value=24.5)
This event contains the fact that the air temperature measured inside room 123 at time
10 was 24.5 0C.
Another aspect of the terminology used by the authors is the difference between primi-
tive and composite events. Simple events similar to the one given above are considered as
primitive events. A composite event is defined using a pattern of primitive events. When
such a pattern is identified the CEP engine derives that a composite event has occurred
and notifies the interested components. An event trace that end with the occurrence of the
composite event is called a positive event trace.
iCEP framework uses the following basic building blocks used in most CEP systems to
generate filters for events.
• Selection: filters relevant event notifications according to the values of their attributes.
• Conjunction: combines event notifications together
• Parameterization: introduces constraints involving the values carried by different events.
• Sequence: introduces ordering relations among events.
• Window: defines the maximum timeframe of a pattern.
• Aggregation: constraints involving some aggregated value.
iCEP uses a set of modules that generates a combination of above building blocks to
generate CEP rules. The framework uses a training data set created using historical traces
to generate rules using a supervised learning technique.](https://image.slidesharecdn.com/vivaranafypreport-160508132741/85/Vivarana-fyp-report-50-320.jpg)

![CHAPTER 2. LITERATURE REVIEW 46
3. Run the data again through the CEP with the generated rule and capture the composite
events triggered.
4. Compare the two versions and calculate precision and recall
The results have been promising with a precision of around 94% based on some of the
tests that were run by the authors. But the system is far from perfect and the following are
some of the challenges that needs to be overcome.
1. A large training dataset with many positive traces are required to generate good rules
with high precision. The training methodology considers only the conjunction of all
the positive traces to generate rules. So without a large number of positive traces that
cover the variations in the data generating accurate rules is difficult.
2. High computational requirements. The iterative approach used with the windows
learner and event learner translates to a lot of computations that needs to be done.
So without hints from a domain expert on the window size or the required events and
parameters the runtime and computational cost increases rapidly.
3. The generated rules require tuning and cleanup from the user. As the rules created
are generated automatically the constraints may be over constraining or may contain
mistakes when used with previously unseen conditions. So they require a final cleanup
by the users.
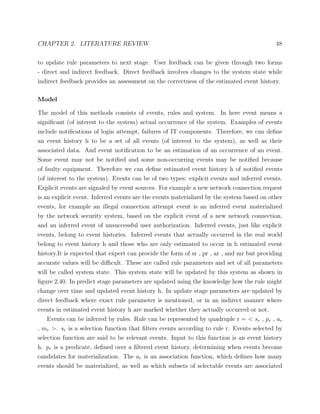
Tuning rule parameters using the Prediction-Correction Paradigm
A mechanism has been proposed by Yulia Turchin in order to automate the definition of
the rules at the beginning and automate the update of rules with the time [63]. It consists
of 2 main repetitive stages - namely rule parameter prediction and rule parameter correc-
tion. Parameter prediction is performed by updating the parameters using available expert
knowledge regarding the future changes of parameters. The rule parameter correction utilizes
expert feedback regarding the actual past occurrence of events and the events materialized
by the CEP framework to tune rule parameters.
For an example in an Intrusion detection system [4] a domain expert can specify the rule
as follow. If the size of the received packet from user has a high level of deviation from
normal packet size with estimated size of m1 and standard deviation of σ1, infer an event E1](https://image.slidesharecdn.com/vivaranafypreport-160508132741/85/Vivarana-fyp-report-53-320.jpg)
![CHAPTER 2. LITERATURE REVIEW 47
Figure 2.40: Prediction Correction Paradigm
representing the anomaly level of the packet size. It is a hard task to determine the values
for m1 and σ1 and moreover the specified values can change with the time due to dynamic
nature of network traffic.
Rule parameter determination and tuning can be done as following: Given a set of rules,
provide an initial value for rule parameters and then modify it as required. For example for
a given rule, rule tuning algorithm might suggest to replace values m1 with values m2 such
that m2 < m1. Initial prediction of m1 value can be done as special case of tuning where
arbitrary value is corrected to m1 by the rule tuning algorithm. This rule tuning algorithm
should be tied with ability of the system to correctly predict events. So that rule tuning
algorithm can see that parameter m1 is too high and because of that many intrusions were
not detected, therefore it needs to be reduced to m2.
The proposed framework is based on the Kalman Estimator which is a simple type of su-
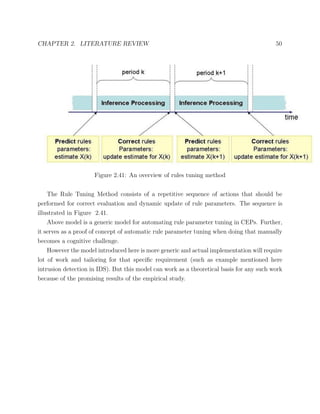
pervised, Bayesian, and predict-correct estimator [18]. As shown in figure 2.40 the framework
learns and updates the system state in two stages, namely rule parameter prediction and
rule parameter update. Unsupervised learning is carried out in rule parameter prediction -
rule parameters are updated without any user feedback and it depends on preexisting knowl-
edge about how the parameters might change over time and events created by the inference
algorithm to predict rule parameters. In rule parameter update stage, the parameters are
tuned in a supervised manner using domain experts feedback and recently generated events](https://image.slidesharecdn.com/vivaranafypreport-160508132741/85/Vivarana-fyp-report-54-320.jpg)
![51
Chapter 3
Solution
3.1 Overview
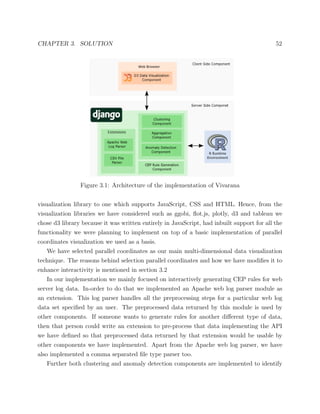
For the implementation of our tool we decided to use a web application architecture, so
as shown in Figure 3.1 our implementation mainly consists of two components and those
are client side and server side components. The server side component performs a lot of
computationally intensive actions and that is the major reason behind us choosing a web
framework so that we could utilize client-server architecture instead of going for a standalone
application. This way we could deploy server-side component in a high performance server
and the user could use it as a web application through web browser without requiring a
high-end machine.
Our solution consist of a Django web application[12]. We have mainly considered Django
and Shiny web frameworks[53] because we intended to use either python or R based develop-
ment environment because there are a lot of libraries for data mining and machine learning
in those languages. One of the main reasons we dropped Shiny was lack of documentation.
Shiny is a relatively new web framework and not as mature as Django. Further we found a
technique to execute R code within python development environment. Hence, we decided to
use Django because we could utilize both python and R libraries within Django
As for the Complex event processing engine we have considered both Siddhi and Esper.
Initially we were planing to implement support for generating queries for both of these
engines. But due to time constrain we were able to implement query generation only for
Siddhi CEP. We plan to implement support for Esper query language in future.
Since we are using a web browser as our front-end we had to narrow down our data](https://image.slidesharecdn.com/vivaranafypreport-160508132741/85/Vivarana-fyp-report-58-320.jpg)
![CHAPTER 3. SOLUTION 53
interesting pattern by the user. The algorithms used in clustering and and the implementa-
tion in details is described in section 3.3
The aggregation component is to perform aggregation operations. Complex even proces-
sors supports specifying sum, average, count, maximum and allowing group by and having
conditions in queries. Through this aggregation component we allow users to perform these
conditions on the data through a moving window. The implementation details of this com-
ponent is elaborated in section 3.3
3.2 Visualization - Parallel Coordinates
Data that is commonly associated with CEP engines are very large consisting of multi-
ple dimensions. Displaying this information in a clear, intuitive and interactive manner is
a challenge that have been the focus of a large amount of research. As we discussed in
the Literature Review there are many visualization techniques such as Scatter Plot Matri-
ces[Scatterplot], Parallel Coordinates[Parcords] Mosaic Plots[MozPlots], and Self Organizing
Maps[SOM] have been proposed to tackle this challenge along the years. After researching
on these methodologies we decided to focus on the Parallel coordinates method for our im-
plementation since we found that it fits most of our requirements as a good visualization
method for the kind of data we hope to use our method with. Parallel coordinates introduced
by Inselberg and Dimsdale is a popular technique for transforming multidimensional data
into a 2D visualization. The m-dimensional data items are represented as lines crossing m
parallel vertical axes, each axis correspondence to one dimension of the original data. Each
element of the data set corresponds to a zigzag line joining the specific values of each one of
its variables.As in the aforementioned way m number of data points can be represented by
m polygonal lines. There are many advantages that can be gained with Parallel Coordinates
over other visualization techniques.
1. With Parallel Coordinates there is no need of transforming all the dimensions to a 2D
image as with most of other visualizations. All the dimensions can be represented in a
2D image easily.
2. With the property of Point line duality in Parallel Coordinates it is easy to observe
the relationships between the dimensions. For an example two dimensions having a
highly negative correlation can be identified by the data lines of that two dimensions
intersecting at a point between those two axes.](https://image.slidesharecdn.com/vivaranafypreport-160508132741/85/Vivarana-fyp-report-60-320.jpg)
![CHAPTER 3. SOLUTION 55
clearly affects the patterns revealed by parallel coordinate plots. There are many approaches
that have been suggested to arrange the order of the axes by using some measure to score
an order of axes while others discuss how to visualize multiple orderings in a single display
[21]. Many approaches for this which are based on the combination of Nonlinear Correlation
Coefficient and Singular Value Decomposition algorithm [39] are suggested. By using these
approaches, the first remarkable axe can be selected based on mathematics theory and all axis
are re-ordered in line with the degree of similarities among them [39]. In our implementation
we noticed few disadvantages in using a mathematical model to determine the order of axes.
Calculating similarities of axes should be done before visualizing each data set in Parallel
Coordinates. But as we are dealing with big data sets, calculating axis similarities will take
much time and definitely it will affect the performance of the tool. Most importantly the
aim of our tool is letting user to interact with the visualization to identify patterns in the
data set. So rather than coming up with a fixed order of axes determined by a mathematical
model we have allowed user to bring axes next to each other in an interactive way, the user
can investigate how values are related to each other with special respect to two of the data
dimensions. The user can use his/her domain knowledge to assume the axes that will be
having a correlation and confirm it with the help of visualization later.
Brushing
Brushing can be used to distinguish an user interested area from the rest of the data points.
The user actively marks subsets of the data-set as being especially interesting and the points
that are contained by the brush are colored differently from other points to make them
standout. For an example if the user is interested in a certain area of a dimension he can
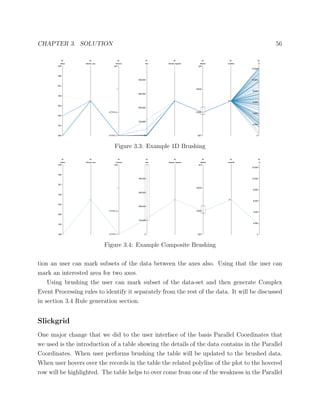
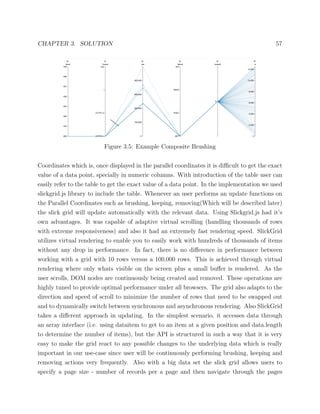
use brushing to highlight the interested area. As in the figure 3.3 user is interested only
in POST method so that he has brushed in on the axes to distinguish POST method data
points from the rest of the data.
1D brushing in our implementation is not only limited for a single axe. If the user is
interested with an area related to two dimensions the user can use composite brushing which
is a combination of single brushes which result the conjunction of those single brushes. As
in the figure 3.5 if the user is interested in data having POST method and more than 10,000
MB Bandwidth he can use composite brushing to specify it.
As described earlier the 1D Brushing technique that was already in the implementation
primarily acts along the axes. In the 2D brushing technique that we added to the visualiza-](https://image.slidesharecdn.com/vivaranafypreport-160508132741/85/Vivarana-fyp-report-62-320.jpg)
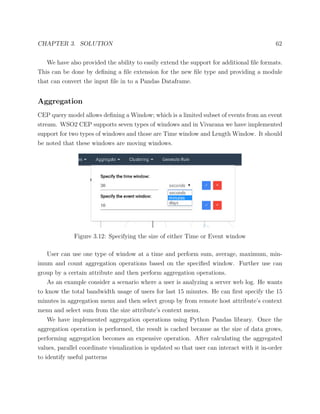
![CHAPTER 3. SOLUTION 63
(a) Before performing any aggregation operation
(b) After performing minimum aggregation operation for 15 minutes time window on Size attribute.
Figure 3.13: State of visualization after performing an aggregation operation
Clustering
Clustering is one of the major data-mining technique we have integrated in Vivarana. Ini-
tially we have implemented support for three clustering algorithm. K-modes clustering[26] is
introduced mainly to cluster data consisting of non-numeric content. It uses simple-matching
distance to find the dissimilarity between two objects and partition the given objects to k
groups. Another algorithm we implemented was the fuzzy analysis clustering[32]. It uses
euclidean distance to calculate the distance between two observations. In contrast to k-
modes clustering, fuzzy clustering produce clusters where cluster boundaries are not crisp.
The other clustering method we have implemented was hierarchical clustering[43]. This uses
Gower’s coefficient[18] as distance measure between observation.
The major disadvantage of aforementioned algorithms are that all those requires the
number of clusters as a user input initially. But since clustering is an unsupervised learning
technique, user might not know about the optimal number of clusters initially. Hence, we
decided to present a deprogram when hierarchical clustering is used. Further, we imple-
mented clustering in a way so that user can identify clusters within clusters as depicted in
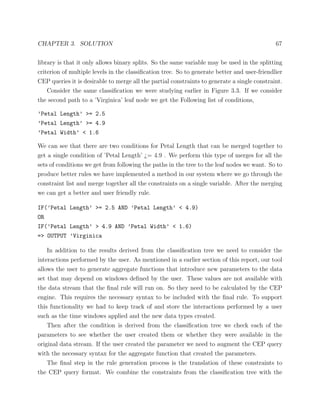
figure 3.14. It should be noted that we used R libraries to implement clustering support.](https://image.slidesharecdn.com/vivaranafypreport-160508132741/85/Vivarana-fyp-report-70-320.jpg)
![CHAPTER 3. SOLUTION 64
(a) Initial clustering using hierarchical clustering
(b) Selecting cluster number 3 and perform clustering withing that cluster
(c) After performing hierarchical clustering within initial cluster number 3
Figure 3.14: Performing clustering within clusters in a web server log data set
Both hierarchical and fuzzy clustering is implemented through cluster library[8] and k-modes
clustering is implemented through klaR[35] library
3.4 Rule Generation
As mentioned earlier there are already existing solutions to automatically generate CEP rules
but most of these systems do not depend an interactive process where the user can adjust
parameters and aid in the process of rule generation and tries to automatically generate all
aspect of the rule. So considering the interactive nature of our solution we have used a simple](https://image.slidesharecdn.com/vivaranafypreport-160508132741/85/Vivarana-fyp-report-71-320.jpg)
![CHAPTER 3. SOLUTION 65
recursive partitioning and regression tree(CART tree)[38] based method in-order to generate
CEP rules while considering the inputs user has provided through interactive visualization.
Classification and Regression Trees(CART)
Classification and Regression Trees also known as CART trees are popular a classification
method used widely. This method consists of training a classification model to partition
a data set in to categories based on conditional decision rules. For example consider the
CART tree in Figure 3.2. It shows a CART classification tree built on the Iris flower data
set, which feature various attributes of flowers and their species. The decision tree tries to
classify the flowers into their species based on the flower’s attributes By starting at the root
and traversing the tree based on the parameters on a data entry we can get a prediction for
the class it belongs to.
Figure 3.15: A decision tree to classify the Iris data set.
We used the ’rpart’ package available with R to generate decision trees to classify the
set of events selected by the user against the other events in the data set. So we create two
categories for the events based on them being selected by the user as important or not.
To create a CART tree the training data is recursively partitioned into subsets based on
a single parameter condition at each partition. This parameter can be selected based on a
impurity index such as the Gini impurity index which is what we are using with the ’rpart’
package. Gini index reaches a value of zero when only one class is present in a partition.
At each partition the Gini index is calculated for all possible splits to identify the best
possible split that can yield partitions with the least impurity. This recursive partitioning
continues until a new partition with the minimum size specified cannot be generated or all
the partitions contain events belonging to a single category.
But this leads to trees that over fit to the training dataset and reduce the value of the
classification. To prevent over fitting and produce better decision trees, the tree generated](https://image.slidesharecdn.com/vivaranafypreport-160508132741/85/Vivarana-fyp-report-72-320.jpg)

![CHAPTER 3. SOLUTION 69
of Equality, LessThan, MoreThan, etc. So if we can get a mapping from these generic
constraints to a specific CEP query format we can get a legitimate CEP query.
So providing the application with these can easily extend the language support.
After the rule are generated we need to assess the quality of the rule. We provide the
user with two methods of looking at the quality of the rule.
1. Applying the rule to the data set and comparing the classification from the rule with
the users selection to calculate the accuracy and precision of the rule. We apply the
rule to the Pandas Data frame and generate a confusion matrix between the events
selected by the user against the event filtered out from the generated rule. The user
can use these parameters to see whether the rule has the qualities he/she needs. For
example, if the user is looking for the selected events to be exactly similar to the ones
he selected in the too then the rule needs to have a higher precision.
2. The rule is also applied in the visualization to highlight the false-positives and false-
negatives to show how the filtering through the rule differs from the users intention. So
along with the rule we highlight the events that the rule selected in the visualization
with the false-positive colored in Red for better clarity
3.5 Other Approaches Attempted
Sunburst Visualization
What the primary visualization method which we have used, does is generating CEP rules
to classify and detect certain events that satisfy a specific criteria. But it does not detect or
does not concern itself with event patterns that occur in a sequence.
For Example,
from every (a1 = infoStock[action == "buy"]
-> a2 = confirmOrder[command == "OK"] )
-> b1 = StockExchangeStream [price > infoStock.price]
within 3000
select a1.action as action, b1.price as price
insert into StockQuote](https://image.slidesharecdn.com/vivaranafypreport-160508132741/85/Vivarana-fyp-report-76-320.jpg)
![CHAPTER 3. SOLUTION 70
This is an example pattern matching query for ”Siddhi” language specification which is
used in ”Siddhi” complex event processing engine (WSO2) [45].To create these kind of CEP
rules first we had to look into methods of visualizing sequences.
Patterns and Sequences
Patterns In the scenario described above, the query specified is a pattern matching query.
It matches events that occur in a pattern within a constrained amount of time(3000). That
in hindsight means there could be other unrelated events between those events which are
specified in the pattern.
Sequences In sequences all events need to be in the specified sequence with no unrelated
events occurring in between.
For example,
A ⇒ A ⇒ B ⇒ B ⇒ B ⇒ C
this sequences of events can be said to be in the A, B, C sequence.
Sunburst Partition
After looking into already existing visualizations we picked sunburst plot [56, 55] for visual-
izing patterns and sequences. Sunburst is a visualization resembling a multilevel pie chart
that is able to visualize hierarchical information. It includes concentric circles of varying
radii. The circle in the center represents root node. And lower level of the hierarchies are
represented from the circles further away from the center. Each circle could be segmented
by radial lines. Each segment represents a node in the hierarchy and child nodes are drawn
within the angle occupied by their parent node [66].
Visualizing sequences in Sunburst
For example, take the sequences,
1. A → B → C → D → E
2. B → C → D
3. A → C → B → D](https://image.slidesharecdn.com/vivaranafypreport-160508132741/85/Vivarana-fyp-report-77-320.jpg)
![CHAPTER 3. SOLUTION 71
At the first level sequences 1 and 3 share same element A, and sequence 2 bears element
B.
This can be shown in a tree structure as shown in 3.1 ,
Root
A B
Diagram 3.1: sequence prefixes example
In this manner above sequences can be shown in a tree structure such that longest
common prefixes are shared by several sequences.
So the above 3 sequences can be represented as a tree as shown in 3.2 ,
Root
A
B
C
D
E
C
B
D
B
C
Diagram 3.2: sequence tree
This tree structure can be directly represented in the sunburst visualization, the angle
of the segments will represent the value that how many sequences share that common prefix
and color of the segment can represent type of the element (A, B, C)
Why use Sunburst
We found many research studies done on evaluating of space filling visualizations such as
sunburst that display hierarchical information. These research studies concluded that sun-
burst is the best visualization method that uses the space effectively to display information
while making it intuitive to the user [66, 57, 33]. Also further research exists that show
sunburst being used to visualize frequency patterns using the same approach we described
earlier [34]. Further motivating factor for us to use this visualization was existing work that
used sunburst diagram to visualize summarized user navigation paths through a web site [48,](https://image.slidesharecdn.com/vivaranafypreport-160508132741/85/Vivarana-fyp-report-78-320.jpg)
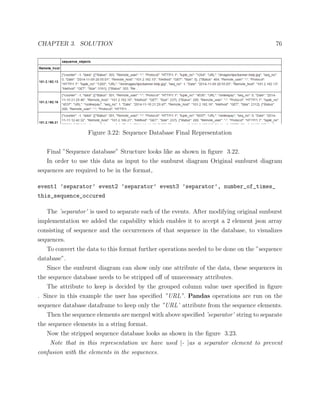
![CHAPTER 3. SOLUTION 72
52], which is displayed below in figure 3.18. We used modified version of this implementation
as groundwork for our project. The limitations of that visualization and improvements done
by our project are described below.
Figure 3.18: Sunburst Visualization which we used as foundation to our project
We used visualization depicted in 3.18, which was used to display user navigation paths
to web site as basic foundation for our project, this stock visualization had several limitations,
1. Needed to load data from a CSV in a specific format, since our project involves loading](https://image.slidesharecdn.com/vivaranafypreport-160508132741/85/Vivarana-fyp-report-79-320.jpg)

![CHAPTER 3. SOLUTION 75
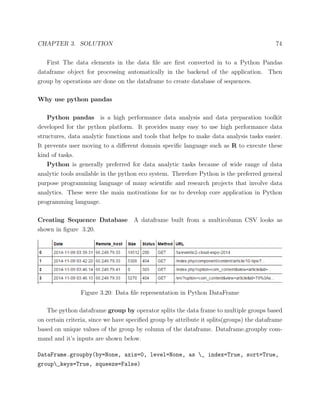
After grouping operation Pandas creates a dataframe group by object which consists of
multiple dataframes, each of which has the rows of original dataframe which has the same
value for the grouped attribute. In this example we have grouped using ”Remote host”
attribute. So the each split data frames has all the requests made by a particular remote
host.
Figure 3.21: Python DataFrame after Group By operation
Since representation shown in figure 3.21 is not suitable to be used for further data
analytic operations this data is further processed to a format by a process described below,
• Each row on these grouped dataframes is converted into a python ”dict” and all of the
”dicts” are stored in an python ”list”
[{col_name1 = value1, col_name2 = value2, col_name3 = value3},
{col_name1 = value1, col_name2 = value2, col_name3 = value3}]]
• Since all these log events occurred in a sequence a ”sequence number” attribute is
added to each of the ”dict”s.](https://image.slidesharecdn.com/vivaranafypreport-160508132741/85/Vivarana-fyp-report-82-320.jpg)
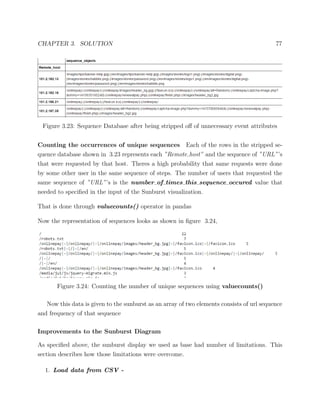
![CHAPTER 3. SOLUTION 78
This limitation was overcome by loading data formatted through above specified data
formatting steps by an Ajax call to the back end. Original sunburst implementation
was modified to accept JSON array object as input to visualize data.
2. Each name value of an event(sequence element) needed to be of limited
length and each of these sequences needed to be of limited length to display
correctly -
To overcome this limitation we added functionality to clip value of the sequence element
in the bread crumbs trail. Then added functionality to show tips displaying the value
of the element when mouse cursor is pointed to the element.
And we added capability to show sequences of arbitrary length in the visualization
without affecting coherence.
3. Shows only limited number of unique elements in limited number of colors
-
We improved the visualization to show many unique elements in many different colors
by developing a color function that assigns almost unique color to a specific unique
element(colors are guaranteed to be unique if the amount of unique values are below
121). Original hard-coded color values numbering 6 was improved to 121. These colors
were selected such that most of the browsers would be able to display those colors and
using that color will match with contrast of the overall visualization. For this purpose
certain light colors were removed from admissible color range of HTML5 and CSS3
color names which numbers to 140 [25].
(Note: that in the diagram displayed in figure 3.25 different name value types have
been assigned same color because of high number of unique name value types, in this
case it is 700.(CSS3 and HTML5 specification contains only 140 web safe colors)
4. Limitation of drill down, zoom functionality -
When the sequences are of arbitrary length and has many unique elements, visual-
ization tends to look cluttered and small elements become incoherent. So we added
functionality to drill down sequences in a separate visualization by the side of the main
visualization.
When user clicks on an element, sequence from that element onward is visualized in
the next display. Also user operations on the second display (moving mouse over the](https://image.slidesharecdn.com/vivaranafypreport-160508132741/85/Vivarana-fyp-report-85-320.jpg)
![CHAPTER 3. SOLUTION 79
elements) is referenced in the main visualization as well, so that user gets the idea of
the whole visualization in coherent and intuitive manner.
Also we added pan and zoom functionality to main display so that user can inspect
harder to see elements in the visualization by zooming in and panning.
Note - in the visualization shown in figure 3.26 the children of ”onlineimagesf” ele-
ments are depicted in the second diagram which shows drill down functionality. And moving
mouse pointer over elements in the second diagram shows original referenced elements in the
main diagram.
Note Figure 3.27 shows how hard to see areas can be zoomed and panned in the main
diagram
469.0pt
Sequential Pattern Mining (Pattern Search)
In order to use the above visualization for our CEP rule generation use case patterns needed
to be searched in the sequence database.
Expected user case User specifies event name values or a regex pattern that matches
the name values as a pattern.
A, B, ˆC[A-Z]
Pattern search engine returns sequences that contain these events occurring in the se-
quence specified above by the user and visualizes them in the display.
Also it returns length of time window in the average case that this sequence occurs in
the sequence database.
Ex:
A, B, ˆ[C[A-Z]
Average sequence length 19, min =3, max = 32
Average time window 1300 milliseconds, min = 50 milliseconds, max 2500 milliseconds
To generate above parameters pattern search engine utilizes attributes of each event,
timestamp, seq no in the sequence database.
These parameters can be used to develop a CEP rule that given the query matches and
detects this sequence in a data stream.](https://image.slidesharecdn.com/vivaranafypreport-160508132741/85/Vivarana-fyp-report-86-320.jpg)
![CHAPTER 3. SOLUTION 80
Pattern Search Methodology
There exists many work done on sequential pattern mining. But these cases involve searching
all the sequential patterns in a sequence database given the support value. But in our use
case we needed to search a specific pattern occurring in the database. For that purpose
we decided to use a modified approach based on prefix projected pattern search utilized in
prefixspan algorithm [47].
In this approach each element of the pattern will project the input sequences in the
database discarding unmatched prefixes creating a new database of sequences. This in the
long run is very efficient because of the reduction of the size of the sequence data base in
successive iterations.
Example sequence database of 4 sequences is shown below,
1. A,B,C,D,A,E
2. B,C,A,E
3. C,A,C,B,D
4. A,B,C,D,C,E
If we were to search pattern A,B,C in the given sequence data base, in the first iteration
sequence database is projected using the first element of the pattern which is A. This results
in the following database of sequences.
1. B,C,D,A,E
2. E
3. C, B, D
4. B, C, D, C, E
Notice that sequence length of all sequences has been reduced in all sequences. If this
sequences are projected again using second element of the search sequence (B),
1. C,D,A,E
2. D,](https://image.slidesharecdn.com/vivaranafypreport-160508132741/85/Vivarana-fyp-report-87-320.jpg)

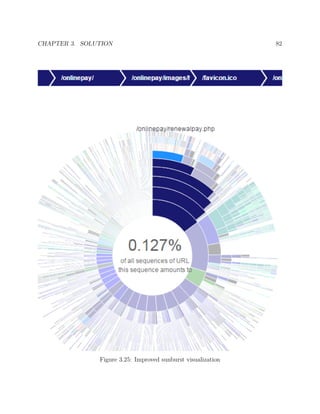
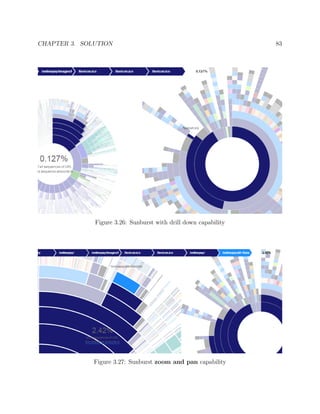
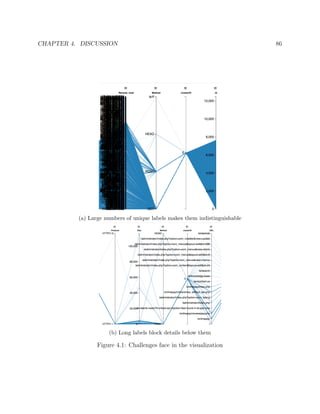
![89
Bibliography
[1] Gennady Andrienko and Natalia Andrienko. “Blending aggregation and selection:
Adapting parallel coordinates for the visualization of large datasets”. In: The Car-
tographic Journal 42.1 (2005), pp. 49–60.
[2] Almir Olivette Artero, Maria Cristina Ferreira de Oliveira, and Haim Levkowitz. “En-
hanced high dimensional data visualization through dimension reduction and attribute
arrangement”. In: Information Visualization, 2006. IV 2006. Tenth International Con-
ference on. IEEE. 2006, pp. 707–712.
[3] Daniel Asimov. “The grand tour: a tool for viewing multidimensional data”. In: SIAM
journal on scientific and statistical computing 6.1 (1985), pp. 128–143.
[4] Stefan Axelsson. Intrusion detection systems: A survey and taxonomy. Tech. rep. Tech-
nical report, 2000.
[5] Eric A Bier et al. “Toolglass and magic lenses: the see-through interface”. In: Proceed-
ings of the 20th annual conference on Computer graphics and interactive techniques.
ACM. 1993, pp. 73–80.
[6] Markus M Breunig et al. “LOF: identifying density-based local outliers”. In: ACM
sigmod record. Vol. 29. 2. ACM. 2000, pp. 93–104.
[7] Krysia Broda et al. SAGE: a logical agent-based environment monitoring and control
system. Springer, 2009, pp. 112–117.
[8] cluster: Cluster Analysis Extended Rousseeuw et al. http://cran.r-project.org/
web/packages/cluster/index.html/. [Online; accessed 03-February-2015]. 2015.
[9] Dianne Cook et al. “Grand tours, projection pursuit guided tours, and manual con-
trols”. In: Handbook of data visualization. Springer, 2008, pp. 295–314.
[10] Data-Ink Ratio. http://www.infovis- wiki.net/index.php/Data- Ink_Ratio.
[Online; accessed 03-February-2015]. 2015.](https://image.slidesharecdn.com/vivaranafypreport-160508132741/85/Vivarana-fyp-report-96-320.jpg)
![BIBLIOGRAPHY 90
[11] Alan Demers et al. “Towards expressive publish/subscribe systems”. In: Advances in
Database Technology-EDBT 2006. Springer, 2006, pp. 627–644.
[12] Django overview, Django. https://www.djangoproject.com/start/overview/.
[Online; accessed 03-February-2015]. 2015.
[13] Niklas Elmqvist, Pierre Dragicevic, and Jean-Daniel Fekete. “Rolling the dice: Multi-
dimensional visual exploration using scatterplot matrix navigation”. In: Visualization
and Computer Graphics, IEEE Transactions on 14.6 (2008), pp. 1539–1148.
[14] Ronald Aylmer Fisher. “The design of experiments.” In: (1935).
[15] M Forina et al. “Classification of olive oils from their fatty acid composition”. In: Food
research and data analysis: proceedings from the IUFoST Symposium, September 20-
23, 1982, Oslo, Norway/edited by H. Martens and H. Russwurm, Jr. London: Applied
Science Publishers, 1983. 1983, pp. 189–214.
[16] Michael Friendly. “A brief history of the mosaic display”. In: Journal of Computational
and Graphical Statistics 11.1 (2002).
[17] Ying-Huey Fua, Matthew O Ward, and Elke A Rundensteiner. “Hierarchical parallel
coordinates for exploration of large datasets”. In: Proceedings of the conference on
Visualization’99: celebrating ten years. IEEE Computer Society Press. 1999, pp. 43–
50.
[18] John C Gower. “A general coefficient of similarity and some of its properties”. In:
Biometrics (1971), pp. 857–871.
[19] John A Hartigan and Beat Kleiner. “Mosaics for contingency tables”. In: Computer
science and statistics: Proceedings of the 13th symposium on the interface. Springer.
1981, pp. 268–273.
[20] Helwig Hauser, Florian Ledermann, and Helmut Doleisch. “Angular brushing of ex-
tended parallel coordinates”. In: Information Visualization, 2002. INFOVIS 2002.
IEEE Symposium on. IEEE. 2002, pp. 127–130.
[21] Julian Heinrich and Daniel Weiskopf. “State of the art of parallel coordinates”. In:
STAR Proceedings of Eurographics 2013 (2013), pp. 95–116.
[22] Julian Heinrich et al. “Evaluation of a bundling technique for parallel coordinates”.
In: arXiv preprint arXiv:1109.6073 (2011).](https://image.slidesharecdn.com/vivaranafypreport-160508132741/85/Vivarana-fyp-report-97-320.jpg)
![BIBLIOGRAPHY 91
[23] Patrick Hoffman et al. “DNA visual and analytic data mining”. In: Visualization’97.,
Proceedings. IEEE. 1997, pp. 437–441.
[24] Heike Hofmann. “Mosaic plots and their variants”. In: Handbook of data visualization.
Springer, 2008, pp. 617–642.
[25] HTML Color Names. http://www.w3schools.com/html/html_colornames.asp.
[Online; accessed 03-February-2015]. 2015.
[26] Zhexue Huang. “A Fast Clustering Algorithm to Cluster Very Large Categorical Data
Sets in Data Mining.” In: DMKD. Citeseer. 1997.
[27] J-F Im, Michael J McGuffin, and Rock Leung. “GPLOM: the generalized plot matrix
for visualizing multidimensional multivariate data”. In: Visualization and Computer
Graphics, IEEE Transactions on 19.12 (2013), pp. 2606–2614.
[28] Alfred Inselberg and Bernard Dimsdale. Parallel coordinates for visualizing multi-
dimensional geometry. Springer, 1987.
[29] Ian Jolliffe. Principal component analysis. Wiley Online Library, 2002.
[30] Rudolph Emil Kalman. “A new approach to linear filtering and prediction problems”.
In: Journal of Fluids Engineering 82.1 (1960), pp. 35–45.
[31] Samuel Kaski and Teuvo Kohonen. “Exploratory data analysis by the self-organizing
map: Structures of welfare and poverty in the world”. In: Neural networks in financial
engineering. Proceedings of the third international conference on neural networks in
the capital markets. Citeseer. 1996.
[32] Leonard Kaufman and Peter J Rousseeuw. Finding groups in data: an introduction to
cluster analysis. Vol. 344. John Wiley & Sons, 2009.
[33] Daniel A Keim. “Information visualization and visual data mining”. In: Visualization
and Computer Graphics, IEEE Transactions on 8.1 (2002), pp. 1–8.
[34] Daniel A Keim, J¨orn Schneidewind, and Mike Sips. “Fp-viz: Visual frequent pattern
mining”. In: (2005).
[35] klaR: Classification and visualization. http://cran.r-project.org/web/packages/
klaR/index.html. [Online; accessed 03-February-2015]. 2015.
[36] Edwin M Knorr, Raymond T Ng, and Vladimir Tucakov. “Distance-based outliers:
algorithms and applications”. In: The VLDB JournalThe International Journal on
Very Large Data Bases 8.3-4 (2000), pp. 237–253.](https://image.slidesharecdn.com/vivaranafypreport-160508132741/85/Vivarana-fyp-report-98-320.jpg)
![BIBLIOGRAPHY 92
[37] Lie Factor. http://www.infovis-wiki.net/index.php?title=Lie_Factor. [Online;
accessed 03-February-2015]. 2015.
[38] Wei-Yin Loh. “Classification and regression trees”. In: Wiley Interdisciplinary Reviews:
Data Mining and Knowledge Discovery 1.1 (2011), pp. 14–23. issn: 1942-4795. doi:
10.1002/widm.8. url: http://dx.doi.org/10.1002/widm.8.
[39] Liang Fu Lu, Mao Lin Huang, and Tze-Haw Huang. “A new axes re-ordering method in
parallel coordinates visualization”. In: Machine Learning and Applications (ICMLA),
2012 11th International Conference On. Vol. 2. IEEE. 2012, pp. 252–257.
[40] Yuan Luo et al. “Cluster Visualization in Parallel Coordinates Using Curve Bundles”.
In: Visualization and Computer Graphics, IEEE Transactions on 20 (2008).
[41] Alessandro Margara, Gianpaolo Cugola, and Giordano Tamburrelli. “Learning from
the past: automated rule generation for complex event processing”. In: Proceedings
of the 8th ACM International Conference on Distributed Event-Based Systems. ACM.
2014, pp. 47–58.
[42] Allen R Martin and Matthew O Ward. “High dimensional brushing for interactive
exploration of multivariate data”. In: Proceedings of the 6th Conference on Visualiza-
tion’95. IEEE Computer Society. 1995, p. 271.
[43] Fionn Murtagh and A Heck. “Multivariate data analysis with Fortran, C and Java
code”. In: Northern Ireland: Queen University Belfast, Astronomical Observatory Stras-
bourg (2000), p. 272.
[44] Christopher Mutschler and Michael Philippsen. “Learning event detection rules with
noise hidden markov models”. In: Adaptive Hardware and Systems (AHS), 2012 NASA/ESA
Conference on. IEEE. 2012, pp. 159–166.
[45] Patterns. https://docs.wso2.com/display/CEP310/Patterns. [Online; accessed
03-February-2015]. 2015.
[46] Karl Pearson. “Note on regression and inheritance in the case of two parents”. In:
Proceedings of the Royal Society of London 58.347-352 (1895), pp. 240–242.
[47] Jian Pei et al. “Prefixspan: Mining sequential patterns efficiently by prefix-projected
pattern growth”. In: 2013 IEEE 29th International Conference on Data Engineering
(ICDE). IEEE Computer Society. 2001, pp. 0215–0215.](https://image.slidesharecdn.com/vivaranafypreport-160508132741/85/Vivarana-fyp-report-99-320.jpg)
![BIBLIOGRAPHY 93
[48] Kerry Rodden. “Applying a Sunburst Visualization to Summarize User Navigation
Sequences”. In: (2014).
[49] S Savoska and S Loskovska. “Parallel Coordinates as Tool of Exploratory Data Anal-
ysis”. In: 17th Telecommunications Forum TELFOR, Belgrade, Serbia. 2009, pp. 24–
26.
[50] Nicholas Poul Schultz-Møller, Matteo Migliavacca, and Peter Pietzuch. “Distributed
complex event processing with query rewriting”. In: Proceedings of the Third ACM
International Conference on Distributed Event-Based Systems. ACM. 2009, p. 4.
[51] Jinwook Seo and Ben Shneiderman. “A rank-by-feature framework for interactive ex-
ploration of multidimensional data”. In: Information Visualization 4.2 (2005), pp. 96–
113.
[52] Sequences Sunburst. http://bl.ocks.org/kerryrodden/7090426. [Online; accessed
03-February-2015]. 2015.
[53] Shiny. http://shiny.rstudio.com/. [Online; accessed 03-February-2015]. 2015.
[54] Anselm Spoerri. “InfoCrystal, a visual tool for information retrieval”. PhD thesis.
Massachusetts Institute of Technology, 1995.
[55] John T. Stasko. SunBurst. http://www.cc.gatech.edu/gvu/ii/sunburst/. [Online;
accessed 03-February-2015]. 2015.
[56] John Stasko and Eugene Zhang. “Focus+ context display and navigation techniques for
enhancing radial, space-filling hierarchy visualizations”. In: Information Visualization,
2000. InfoVis 2000. IEEE Symposium on. IEEE. 2000, pp. 57–65.
[57] John Stasko et al. “An evaluation of space-filling information visualizations for depict-
ing hierarchical structures”. In: International Journal of Human-Computer Studies
53.5 (2000), pp. 663–694.
[58] Randolph Stone et al. “Identification of genes correlated with early-stage bladder can-
cer progression”. In: Cancer Prevention Research 3.6 (2010), pp. 776–786.
[59] Martin Theus. “High Dimensional Data Visualizations”. In: Handbook of data visual-
ization. Springer, 2008, pp. 156–163.
[60] Martin Theus. “Parallel Coordinate Plots”. In: Handbook of data visualization. Springer,
2008, pp. 164–174.](https://image.slidesharecdn.com/vivaranafypreport-160508132741/85/Vivarana-fyp-report-100-320.jpg)
![BIBLIOGRAPHY 94
[61] Edward R Tufte. “Small Multiples”. In: Envisioning Information. Graphics press Cheshire,
CT, 1990, pp. 67–80.
[62] Edward R Tufte and PR Graves-Morris. The visual display of quantitative information.
Vol. 2. Graphics press Cheshire, CT, 1983.
[63] Yulia Turchin, Avigdor Gal, and Segev Wasserkrug. “Tuning complex event processing
rules using the prediction-correction paradigm”. In: Proceedings of the Third ACM
International Conference on Distributed Event-Based Systems. ACM. 2009, p. 10.
[64] Shimon Ullman. The interpretation of visual motion. Massachusetts Inst of Technology
Pr, 1979.
[65] Roel Vliegen, Jarke J van Wijk, and E-J Van der Linden. “Visualizing business data
with generalized treemaps”. In: Visualization and Computer Graphics, IEEE Transac-
tions on 12.5 (2006), pp. 789–796.
[66] Richard Webbera, Ric D Herbertb, and Wei Jiangbc. “Space-filling Techniques in Vi-
sualizing Output from Computer Based Economic Models”. In: ().
[67] What is a Trellis Chart? http://trellischarts.com/what-is-a-trellis-chart.
[Online; accessed 03-February-2015]. 2015.
[68] Pak Chung Wong and R Daniel Bergeron. “30 Years of Multidimensional Multivariate
Visualization.” In: Scientific Visualization. 1994, pp. 3–33.
[69] Hong Zhou et al. “Visual clustering in parallel coordinates”. In: Computer Graphics
Forum. Vol. 27. 3. Wiley Online Library. 2008, pp. 1047–1054.](https://image.slidesharecdn.com/vivaranafypreport-160508132741/85/Vivarana-fyp-report-101-320.jpg)

This document describes Vivarana, an interactive data visualization tool that generates Complex Event Processing (CEP) rules. It presents the background research on multidimensional data visualization techniques and CEP rule generation. The solution section explains the parallel coordinates visualization used in Vivarana and how user interactions like brushing filter data. It also covers the rule generation process where decision trees are used to automatically create CEP queries based on user selections in the visualization. The discussion section describes challenges faced during the project. It concludes by discussing future work to improve Vivarana's effectiveness.