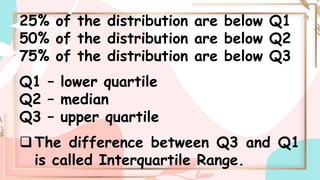
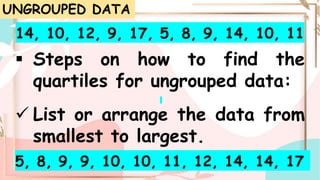
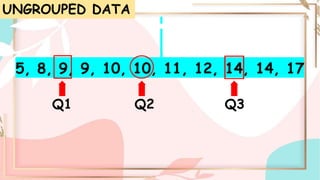
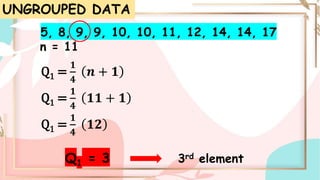
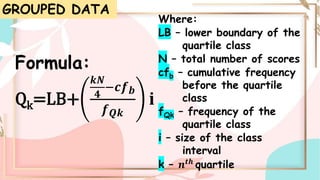
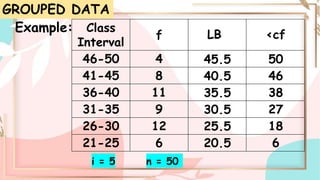
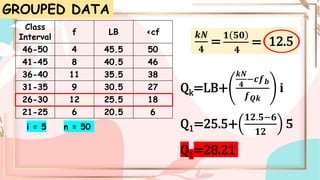
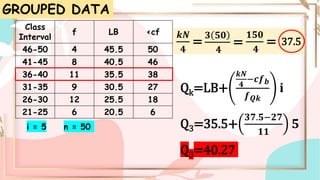
PREPARED BY: EVERLYN R. BURCES
QUARTILES
These are numbers that
separate the data into
quarters, or which divide
the distribution into four
equal parts.
25% of the distribution are below Q1
50% of the distribution are below Q2
75% of the distribution are below Q3
Q1 – lower quartile
Q2 – median
Q3 – upper quartile
The difference between Q3 and Q1
is called Interquartile Range.
Example:
The owner of a coffee shop
recorded the number of
customers who came into his
café each hour in a day. The
results were 14, 10, 12, 9, 17,
5, 8, 9, 14, 10 and 11.
UNGROUPED DATA
14, 10, 12, 9, 17, 5, 8, 9, 14, 10, 11
 Steps on how to find the
quartiles for ungrouped data:
 List or arrange the data from
smallest to largest.
5, 8, 9, 9, 10, 10, 11, 12, 14, 14, 17
UNGROUPED DATA
 Find the median or second quartile (Q2).
5, 8, 9, 9, 10, 10, 11, 12, 14, 14, 17
 The first quartile (Q1) is the
middle value of the lower half of the
data.
 The third quartile (Q3) is the
middle value of the upper half.
UNGROUPED DATA
5, 8, 9, 9, 10, 10, 11, 12, 14, 14, 17
Q1 Q2 Q3
UNGROUPED DATA
UNGROUPED DATA
Mendenhall & Sincich Method
Q1 =
𝟏
𝟒
𝒏 + 𝟏
 if this falls between two integers, ROUND UP.
Q3 =
𝟑
𝟒
𝒏 + 𝟏
 if this falls between two integers, ROUND
DOWN.
UNGROUPED DATA
5, 8, 9, 9, 10, 10, 11, 12, 14, 14, 17
n = 11
Q1 =
𝟏
𝟒
𝒏 + 𝟏
Q1 =
𝟏
𝟒
𝟏𝟏 + 𝟏
Q1 =
𝟏
𝟒
𝟏𝟐
Q1 = 3 3rd element
UNGROUPED DATA
5, 8, 9, 9, 10, 10, 11, 12, 14, 14, 17
n = 11
Q3 =
𝟑
𝟒
𝒏 + 𝟏
Q3 =
𝟑
𝟒
𝟏𝟏 + 𝟏
Q3 =
𝟑
𝟒
𝟏𝟐
Q3 = 9 9th element
Formula:
Qk=LB+
𝒌𝑵
𝟒
−𝒄𝒇𝒃
𝒇𝑸𝒌
𝐢
GROUPED DATA
Where:
LB – lower boundary of the
quartile class
N – total number of scores
cfb – cumulative frequency
before the quartile
class
fQk – frequency of the
quartile class
i – size of the class
interval
k – 𝒏𝒕𝒉
quartile
Example:
GROUPED DATA
Class
Interval
f
46-50 4
41-45 8
36-40 11
31-35 9
26-30 12
21-25 6
i = 5 n = 50
LB <cf
45.5
40.5
35.5
30.5
25.5
20.5
50
46
38
27
18
6
GROUPED DATA
Class
Interval
f LB <cf
46-50 4 45.5 50
41-45 8 40.5 46
36-40 11 35.5 38
31-35 9 30.5 27
26-30 12 25.5 18
21-25 6 20.5 6
i = 5 n = 50
Qk=LB+
𝒌𝑵
𝟒
−𝒄𝒇𝒃
𝒇𝑸𝒌
𝐢
Q1=25.5+
𝟏𝟐.𝟓−𝟔
𝟏𝟐
𝟓
Q1=28.21
𝒌𝑵
𝟒
=
𝟏 𝟓𝟎
𝟒
= 12.5
GROUPED DATA
Class
Interval
f LB <cf
46-50 4 45.5 50
41-45 8 40.5 46
36-40 11 35.5 38
31-35 9 30.5 27
26-30 12 25.5 18
21-25 6 20.5 6
i = 5 n = 50
Qk=LB+
𝒌𝑵
𝟒
−𝒄𝒇𝒃
𝒇𝑸𝒌
𝐢
Q2=30.5+
𝟐𝟓−𝟏𝟖
𝟗
𝟓
Q2=34.39
𝒌𝑵
𝟒
=
𝟐 𝟓𝟎
𝟒
=
𝟏𝟎𝟎
𝟒
=25
GROUPED DATA
Class
Interval
f LB <cf
46-50 4 45.5 50
41-45 8 40.5 46
36-40 11 35.5 38
31-35 9 30.5 27
26-30 12 25.5 18
21-25 6 20.5 6
i = 5 n = 50
Qk=LB+
𝒌𝑵
𝟒
−𝒄𝒇𝒃
𝒇𝑸𝒌
𝐢
Q3=35.5+
𝟑𝟕.𝟓−𝟐𝟕
𝟏𝟏
𝟓
Q3=40.27
𝒌𝑵
𝟒
=
𝟑 𝟓𝟎
𝟒
=
𝟏𝟓𝟎
𝟒
= 37.5
EDUC-201-QUARTILES.pptx

EDUC-201-QUARTILES.pptx

  • 1.
  • 2.
    QUARTILES These are numbersthat separate the data into quarters, or which divide the distribution into four equal parts.
  • 3.
    25% of thedistribution are below Q1 50% of the distribution are below Q2 75% of the distribution are below Q3 Q1 – lower quartile Q2 – median Q3 – upper quartile The difference between Q3 and Q1 is called Interquartile Range.
  • 5.
    Example: The owner ofa coffee shop recorded the number of customers who came into his café each hour in a day. The results were 14, 10, 12, 9, 17, 5, 8, 9, 14, 10 and 11. UNGROUPED DATA
  • 6.
    14, 10, 12,9, 17, 5, 8, 9, 14, 10, 11  Steps on how to find the quartiles for ungrouped data:  List or arrange the data from smallest to largest. 5, 8, 9, 9, 10, 10, 11, 12, 14, 14, 17 UNGROUPED DATA
  • 7.
     Find themedian or second quartile (Q2). 5, 8, 9, 9, 10, 10, 11, 12, 14, 14, 17  The first quartile (Q1) is the middle value of the lower half of the data.  The third quartile (Q3) is the middle value of the upper half. UNGROUPED DATA
  • 8.
    5, 8, 9,9, 10, 10, 11, 12, 14, 14, 17 Q1 Q2 Q3 UNGROUPED DATA
  • 9.
    UNGROUPED DATA Mendenhall &Sincich Method Q1 = 𝟏 𝟒 𝒏 + 𝟏  if this falls between two integers, ROUND UP. Q3 = 𝟑 𝟒 𝒏 + 𝟏  if this falls between two integers, ROUND DOWN.
  • 10.
    UNGROUPED DATA 5, 8,9, 9, 10, 10, 11, 12, 14, 14, 17 n = 11 Q1 = 𝟏 𝟒 𝒏 + 𝟏 Q1 = 𝟏 𝟒 𝟏𝟏 + 𝟏 Q1 = 𝟏 𝟒 𝟏𝟐 Q1 = 3 3rd element
  • 11.
    UNGROUPED DATA 5, 8,9, 9, 10, 10, 11, 12, 14, 14, 17 n = 11 Q3 = 𝟑 𝟒 𝒏 + 𝟏 Q3 = 𝟑 𝟒 𝟏𝟏 + 𝟏 Q3 = 𝟑 𝟒 𝟏𝟐 Q3 = 9 9th element
  • 13.
    Formula: Qk=LB+ 𝒌𝑵 𝟒 −𝒄𝒇𝒃 𝒇𝑸𝒌 𝐢 GROUPED DATA Where: LB –lower boundary of the quartile class N – total number of scores cfb – cumulative frequency before the quartile class fQk – frequency of the quartile class i – size of the class interval k – 𝒏𝒕𝒉 quartile
  • 14.
    Example: GROUPED DATA Class Interval f 46-50 4 41-458 36-40 11 31-35 9 26-30 12 21-25 6 i = 5 n = 50 LB <cf 45.5 40.5 35.5 30.5 25.5 20.5 50 46 38 27 18 6
  • 15.
    GROUPED DATA Class Interval f LB<cf 46-50 4 45.5 50 41-45 8 40.5 46 36-40 11 35.5 38 31-35 9 30.5 27 26-30 12 25.5 18 21-25 6 20.5 6 i = 5 n = 50 Qk=LB+ 𝒌𝑵 𝟒 −𝒄𝒇𝒃 𝒇𝑸𝒌 𝐢 Q1=25.5+ 𝟏𝟐.𝟓−𝟔 𝟏𝟐 𝟓 Q1=28.21 𝒌𝑵 𝟒 = 𝟏 𝟓𝟎 𝟒 = 12.5
  • 16.
    GROUPED DATA Class Interval f LB<cf 46-50 4 45.5 50 41-45 8 40.5 46 36-40 11 35.5 38 31-35 9 30.5 27 26-30 12 25.5 18 21-25 6 20.5 6 i = 5 n = 50 Qk=LB+ 𝒌𝑵 𝟒 −𝒄𝒇𝒃 𝒇𝑸𝒌 𝐢 Q2=30.5+ 𝟐𝟓−𝟏𝟖 𝟗 𝟓 Q2=34.39 𝒌𝑵 𝟒 = 𝟐 𝟓𝟎 𝟒 = 𝟏𝟎𝟎 𝟒 =25
  • 17.
    GROUPED DATA Class Interval f LB<cf 46-50 4 45.5 50 41-45 8 40.5 46 36-40 11 35.5 38 31-35 9 30.5 27 26-30 12 25.5 18 21-25 6 20.5 6 i = 5 n = 50 Qk=LB+ 𝒌𝑵 𝟒 −𝒄𝒇𝒃 𝒇𝑸𝒌 𝐢 Q3=35.5+ 𝟑𝟕.𝟓−𝟐𝟕 𝟏𝟏 𝟓 Q3=40.27 𝒌𝑵 𝟒 = 𝟑 𝟓𝟎 𝟒 = 𝟏𝟓𝟎 𝟒 = 37.5