Download as PDF, PPTX
![Schedule: Your “Swiss Army
Knife”
Calendar
Deliverables
Tasks
Work Breakdown of scope
Project Logic
Resource plan
Margin of Risk [slack]
©Square Peg Consulting, 2010, all rights reserved](https://image.slidesharecdn.com/scheduleswissarmy07272010-100728204211-phpapp01/75/Adding-quantitative-risk-analysis-your-Swiss-Army-Knife-2-2048.jpg)

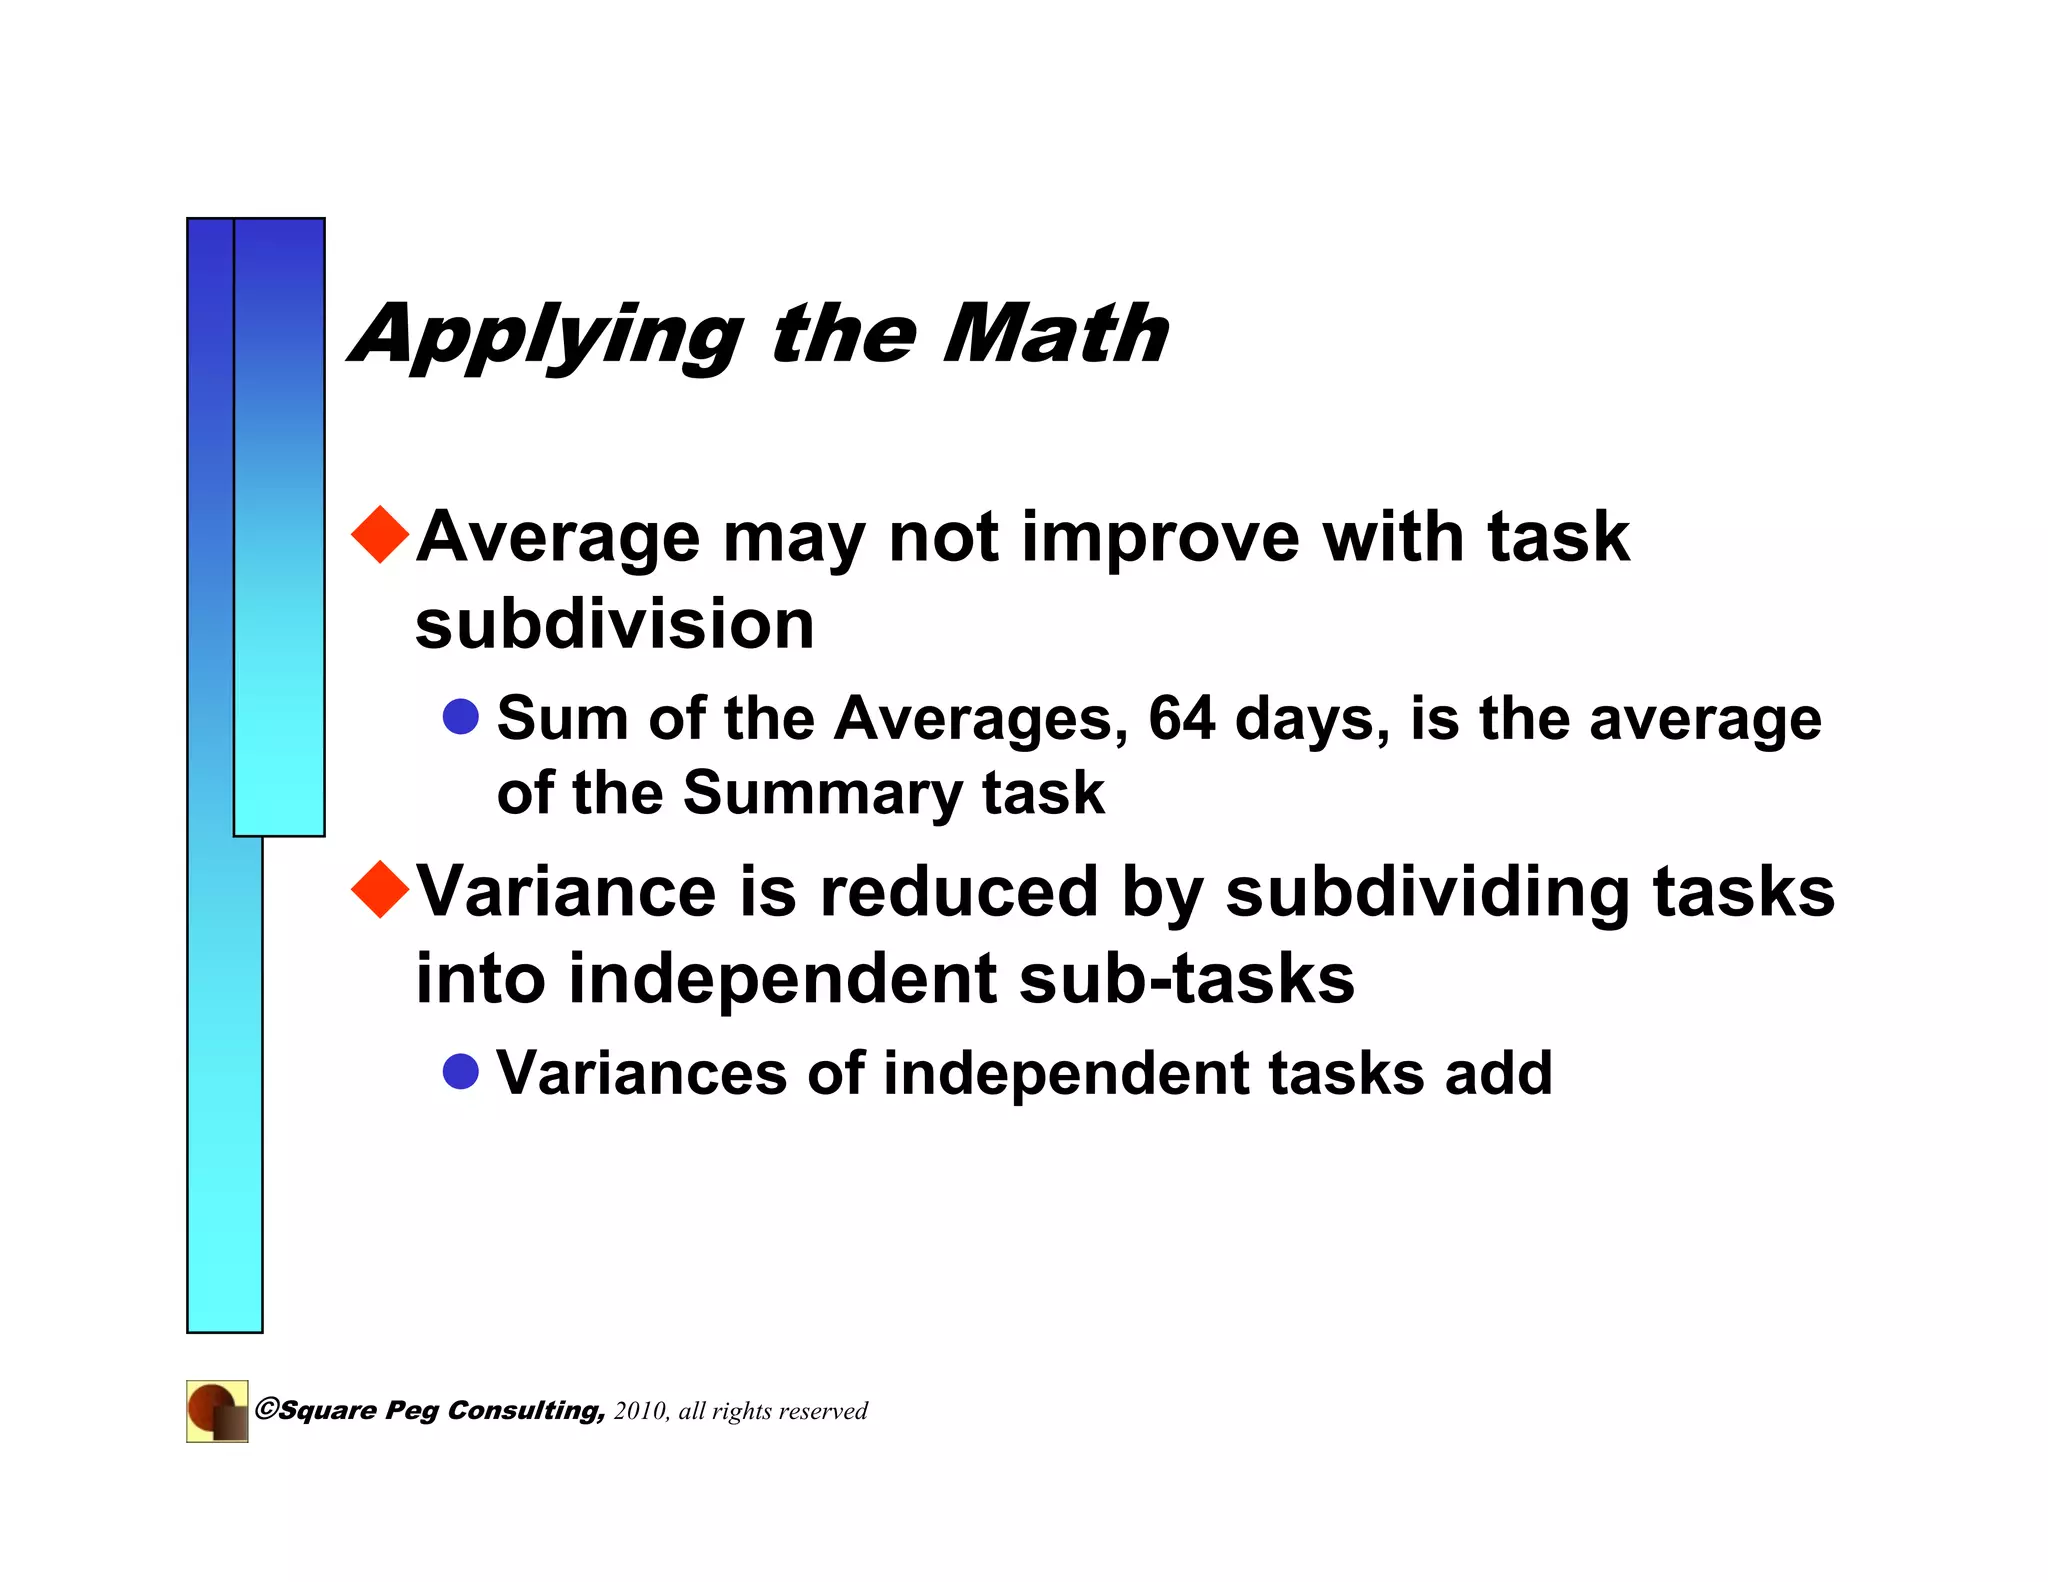
![Variance improved by 1/N
Managing D uration Risk
Work Breakdow n
Triangle Probability Distribution of Duration
Structure of Variance Standard
Scheduled Minimum Most Maximum (Days- Deviation
Activities in Days [-10% ] Likely [+30% ] Average squared) (D ays)
WBS Activity 1.0
(Baseline) 54 60 78 64.00 26.00 5.10
Baseline restructured into four subtasks and a summ ary task
WBS Activity 1.1 13.5 15 19.5 16.00 1.63 1.27
WBS Activity 1.2 13.5 15 19.5 16.00 1.63 1.27
WBS Activity 1.3 18 20 26 21.33 2.89 1.70
WBS Activity 1.4 9 10 13 10.67 0.72 0.85
WBS Activity 1.0
Summary (New Distribution Unknown
B aseline) 64.00 6.86 2.62
Average = [min + m ax + most likely]/3 No 74% 49%
Variance = [[max-m in][max-min] + change improved improved
[most likely - min][most likely - max]]/18 from from from
Standard Deviation = sq root [Variance] Baseline Baseline Baseline
©Square Peg Consulting, 2010, all rights reserved](https://image.slidesharecdn.com/scheduleswissarmy07272010-100728204211-phpapp01/75/Adding-quantitative-risk-analysis-your-Swiss-Army-Knife-15-2048.jpg)
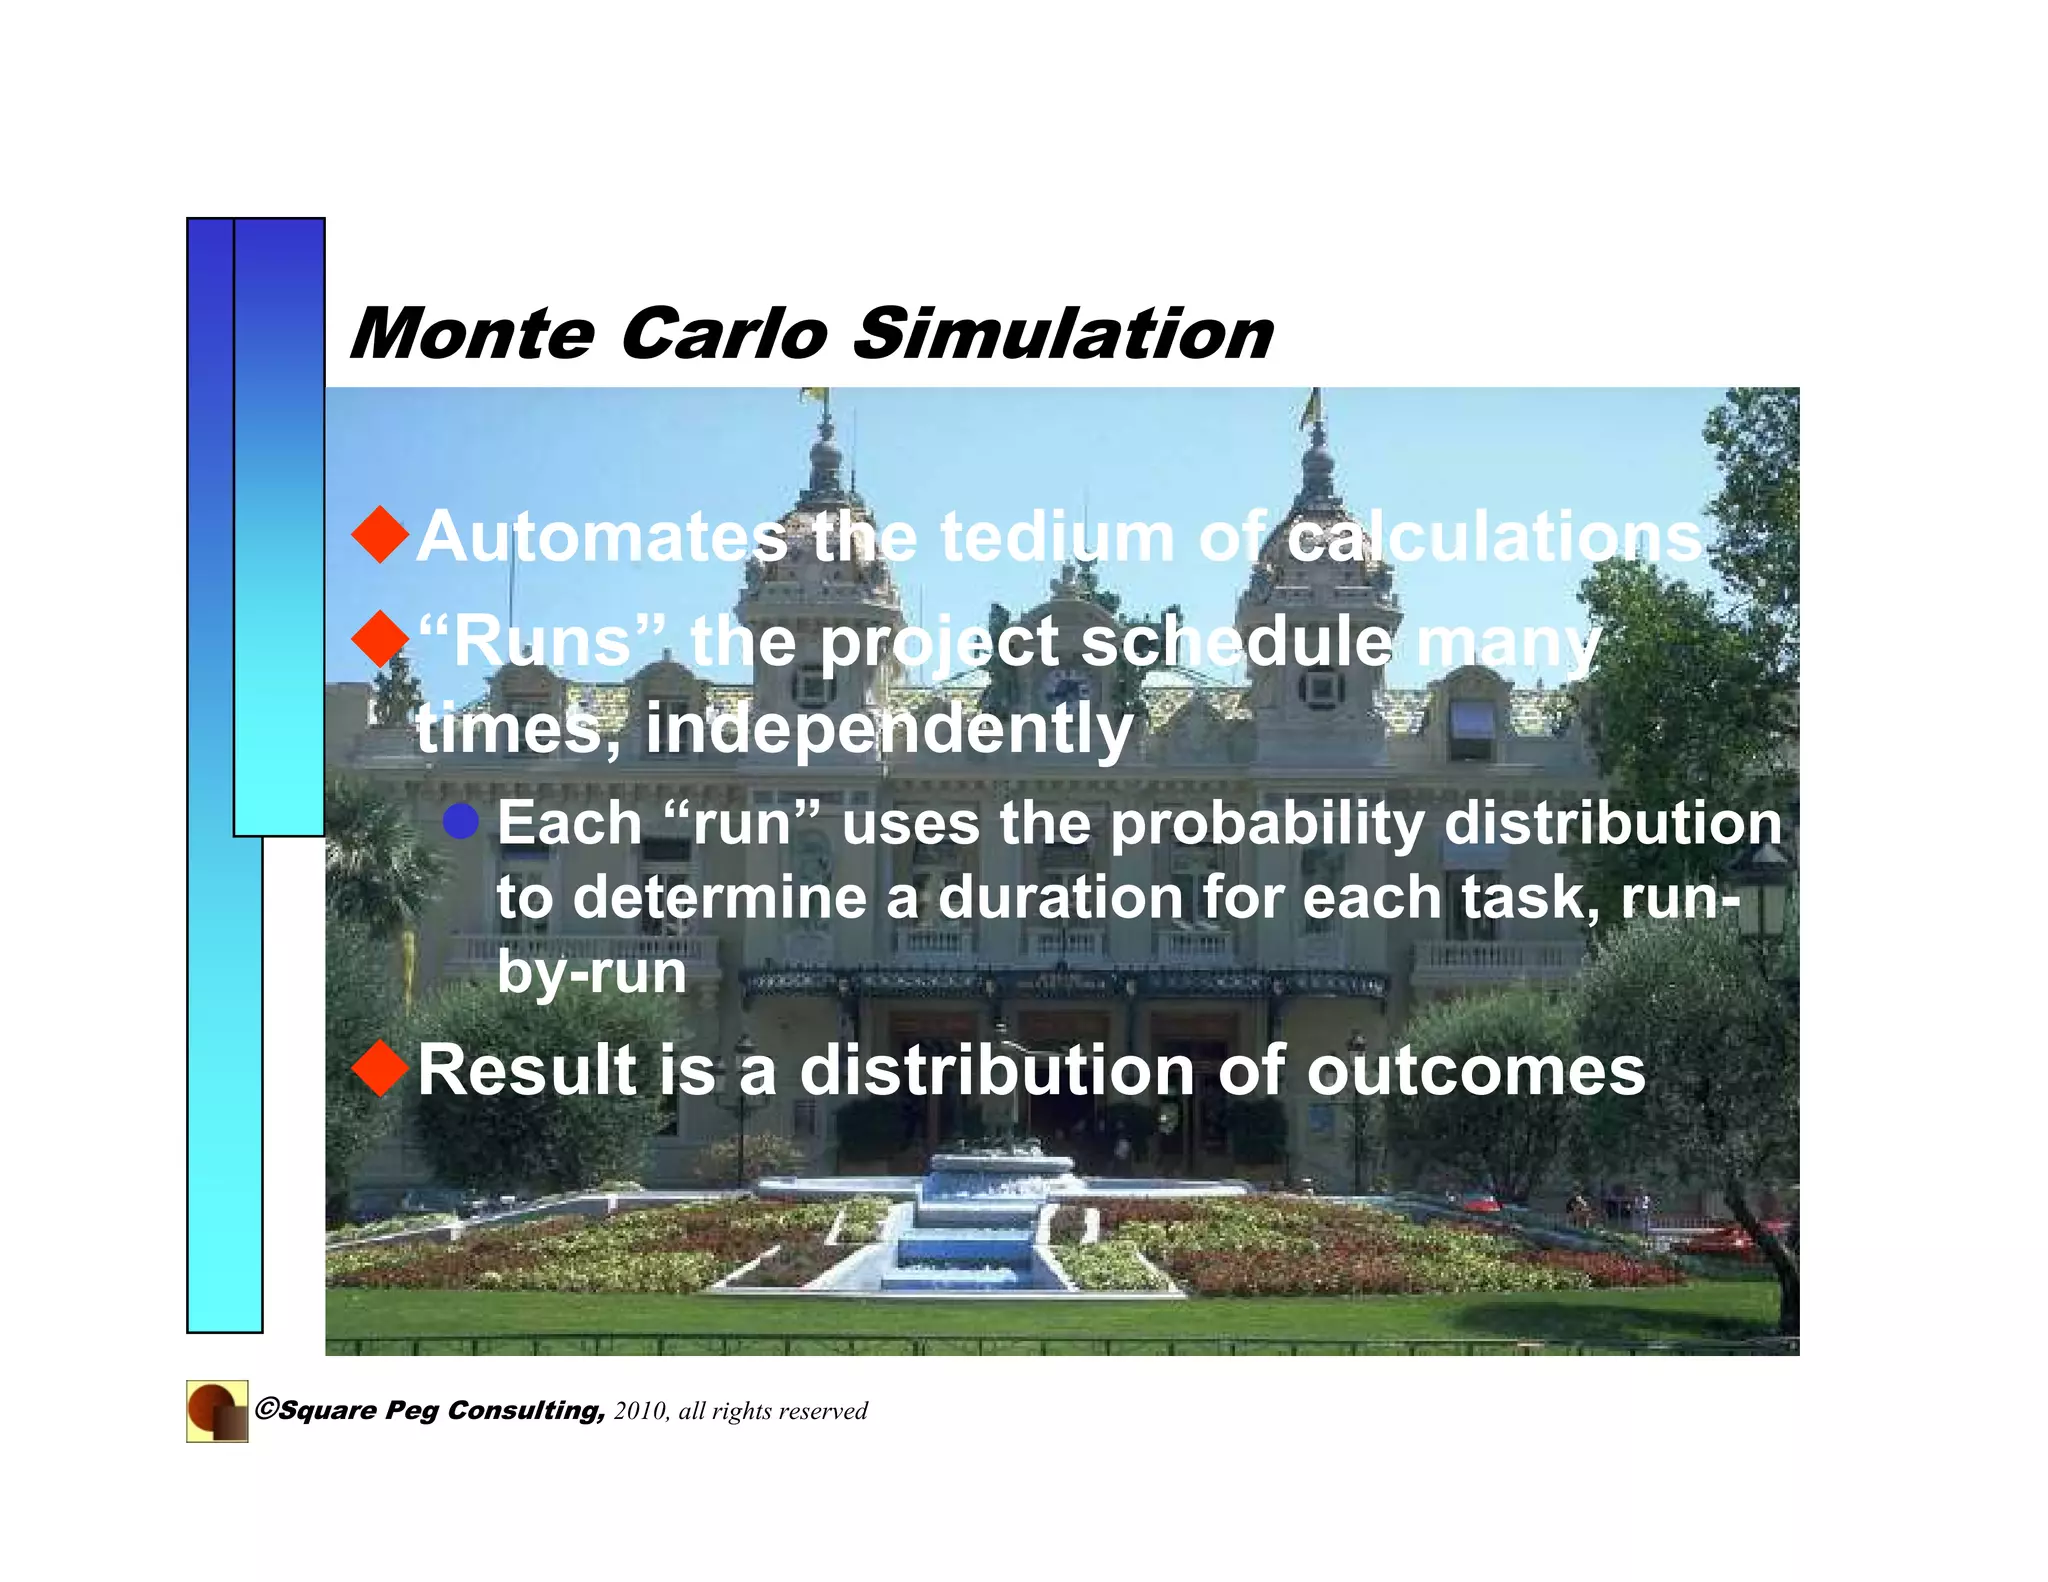
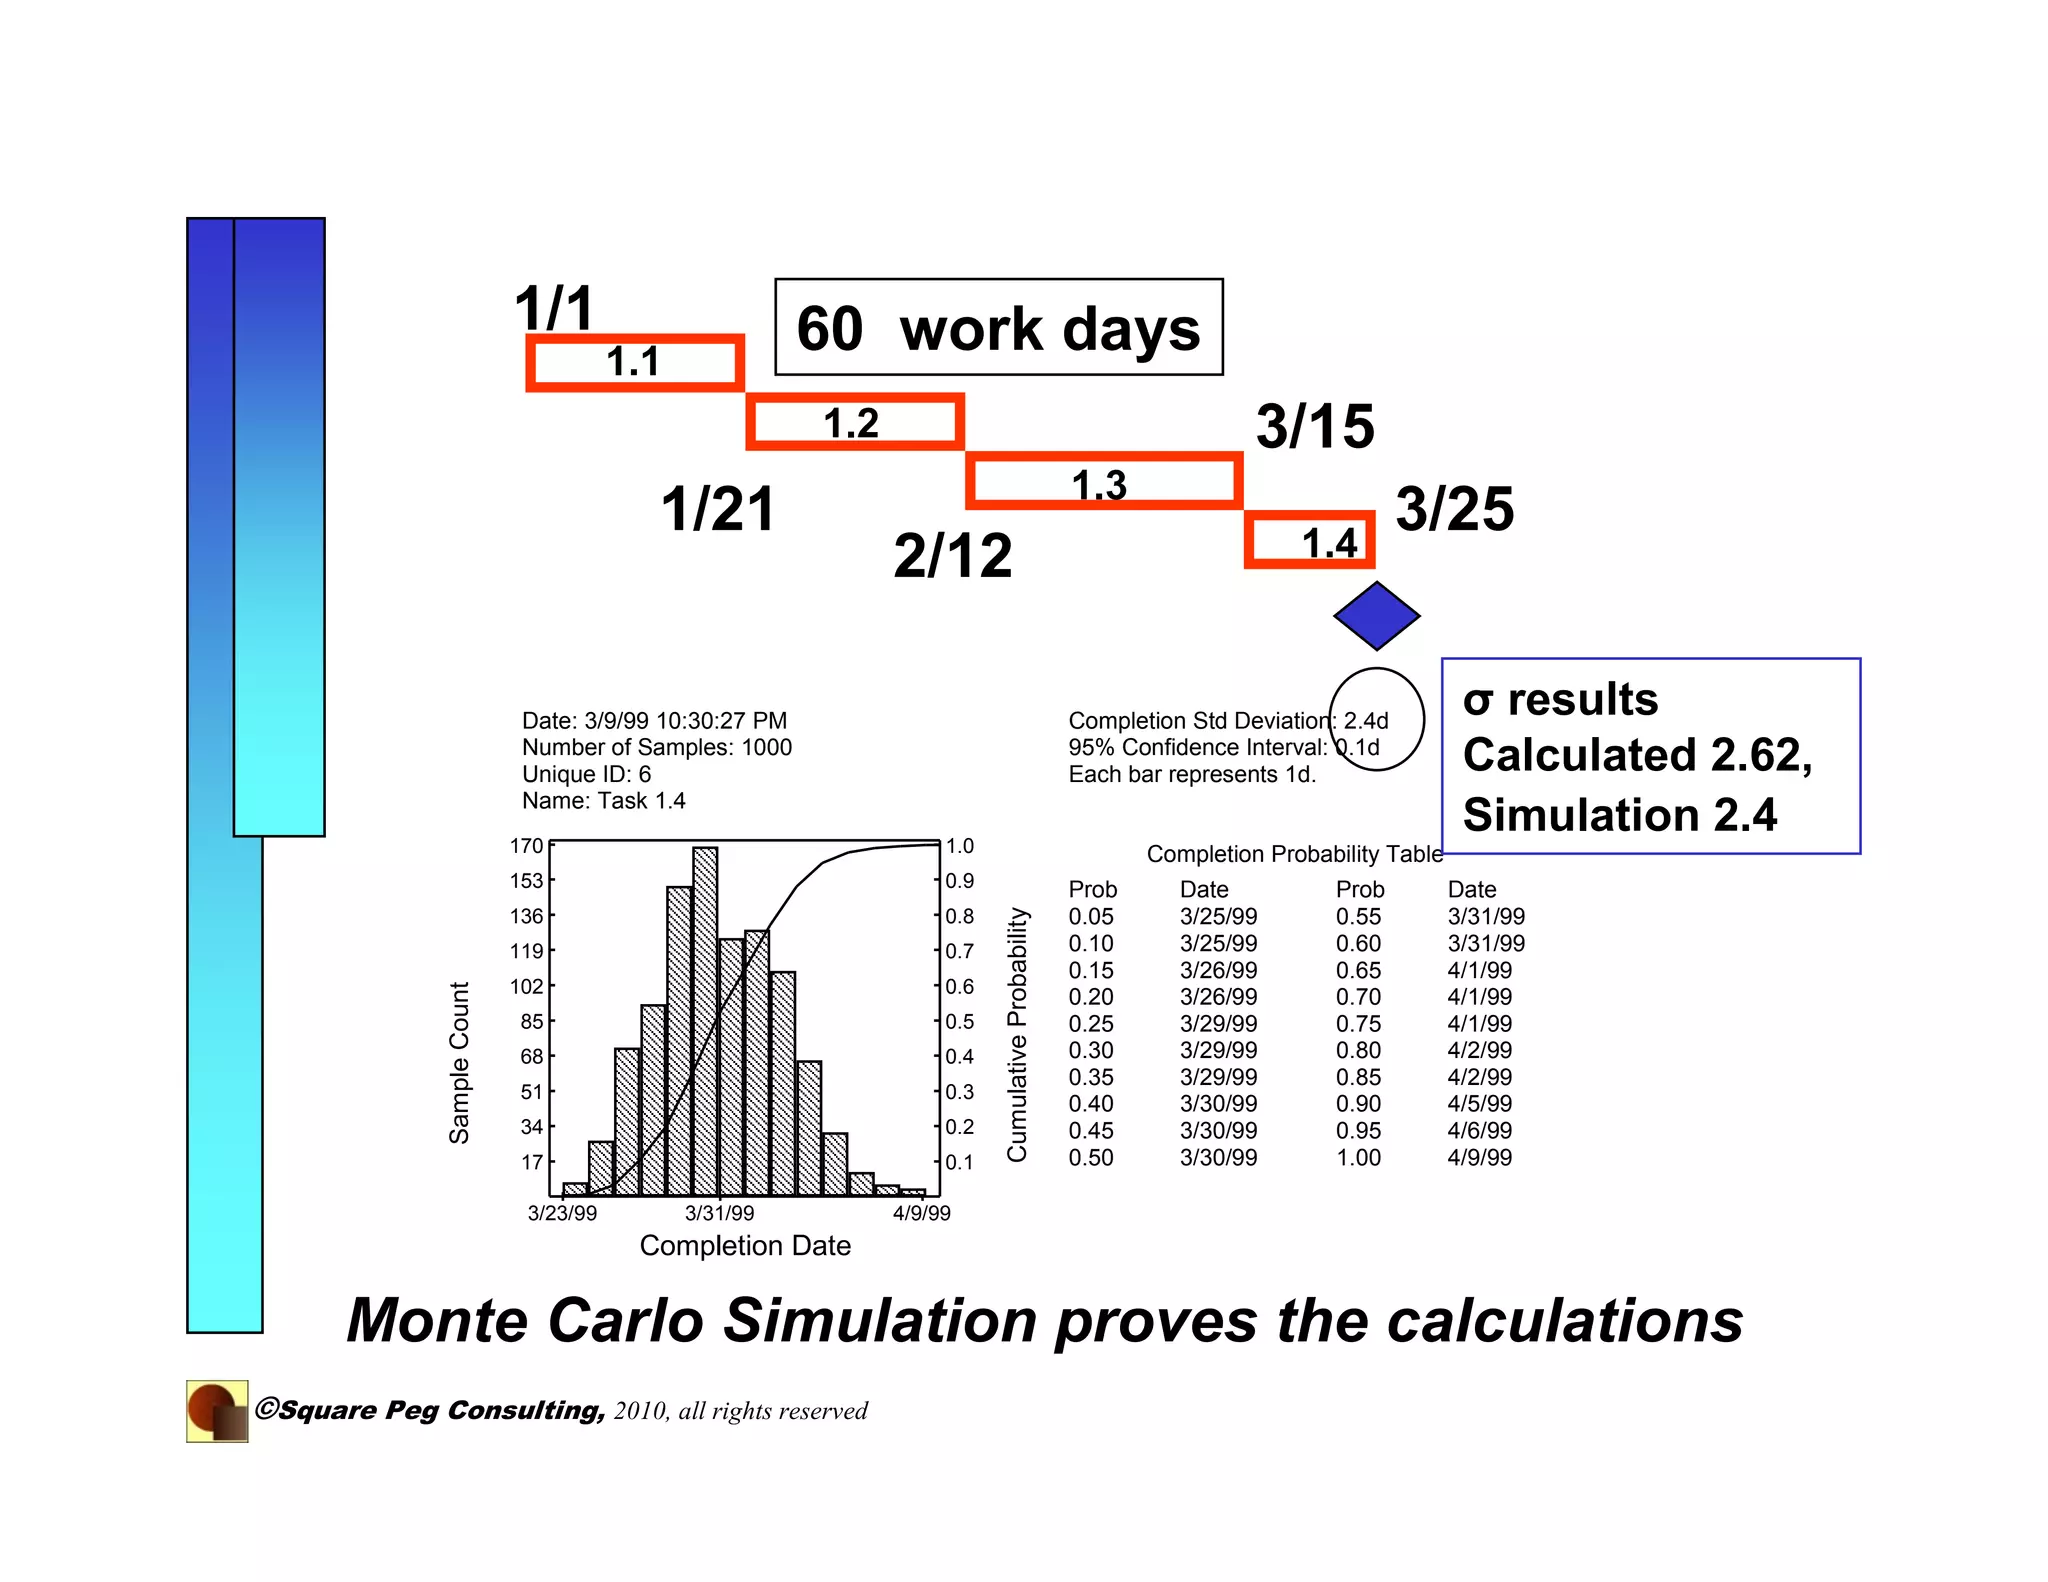
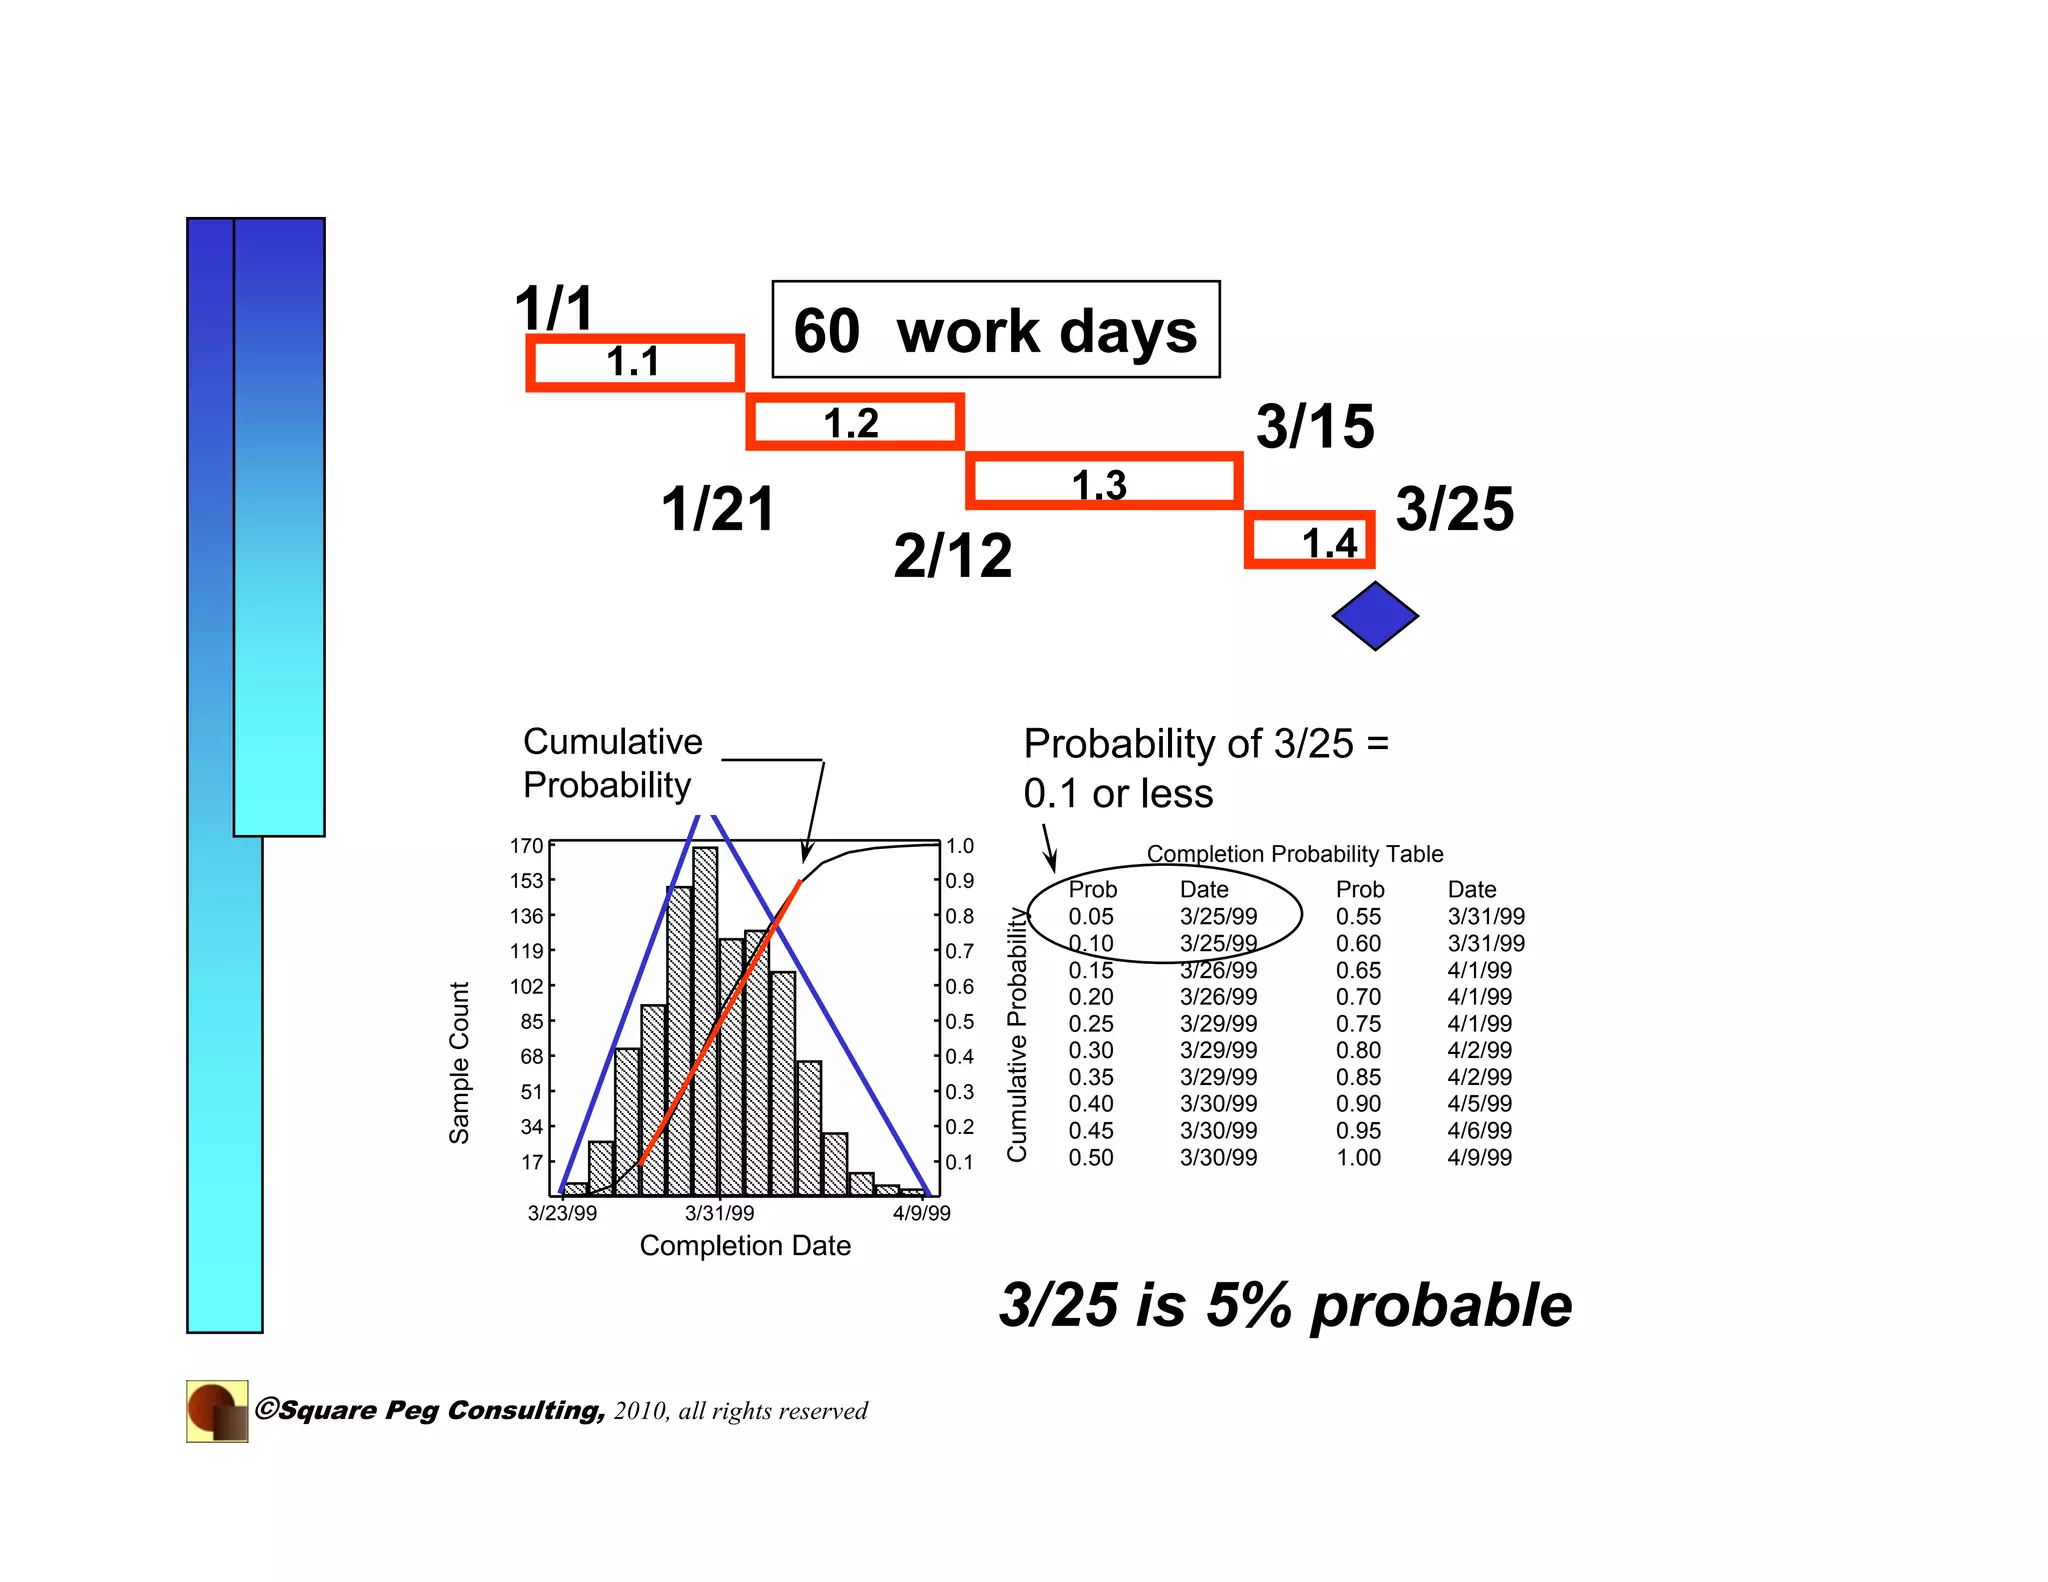


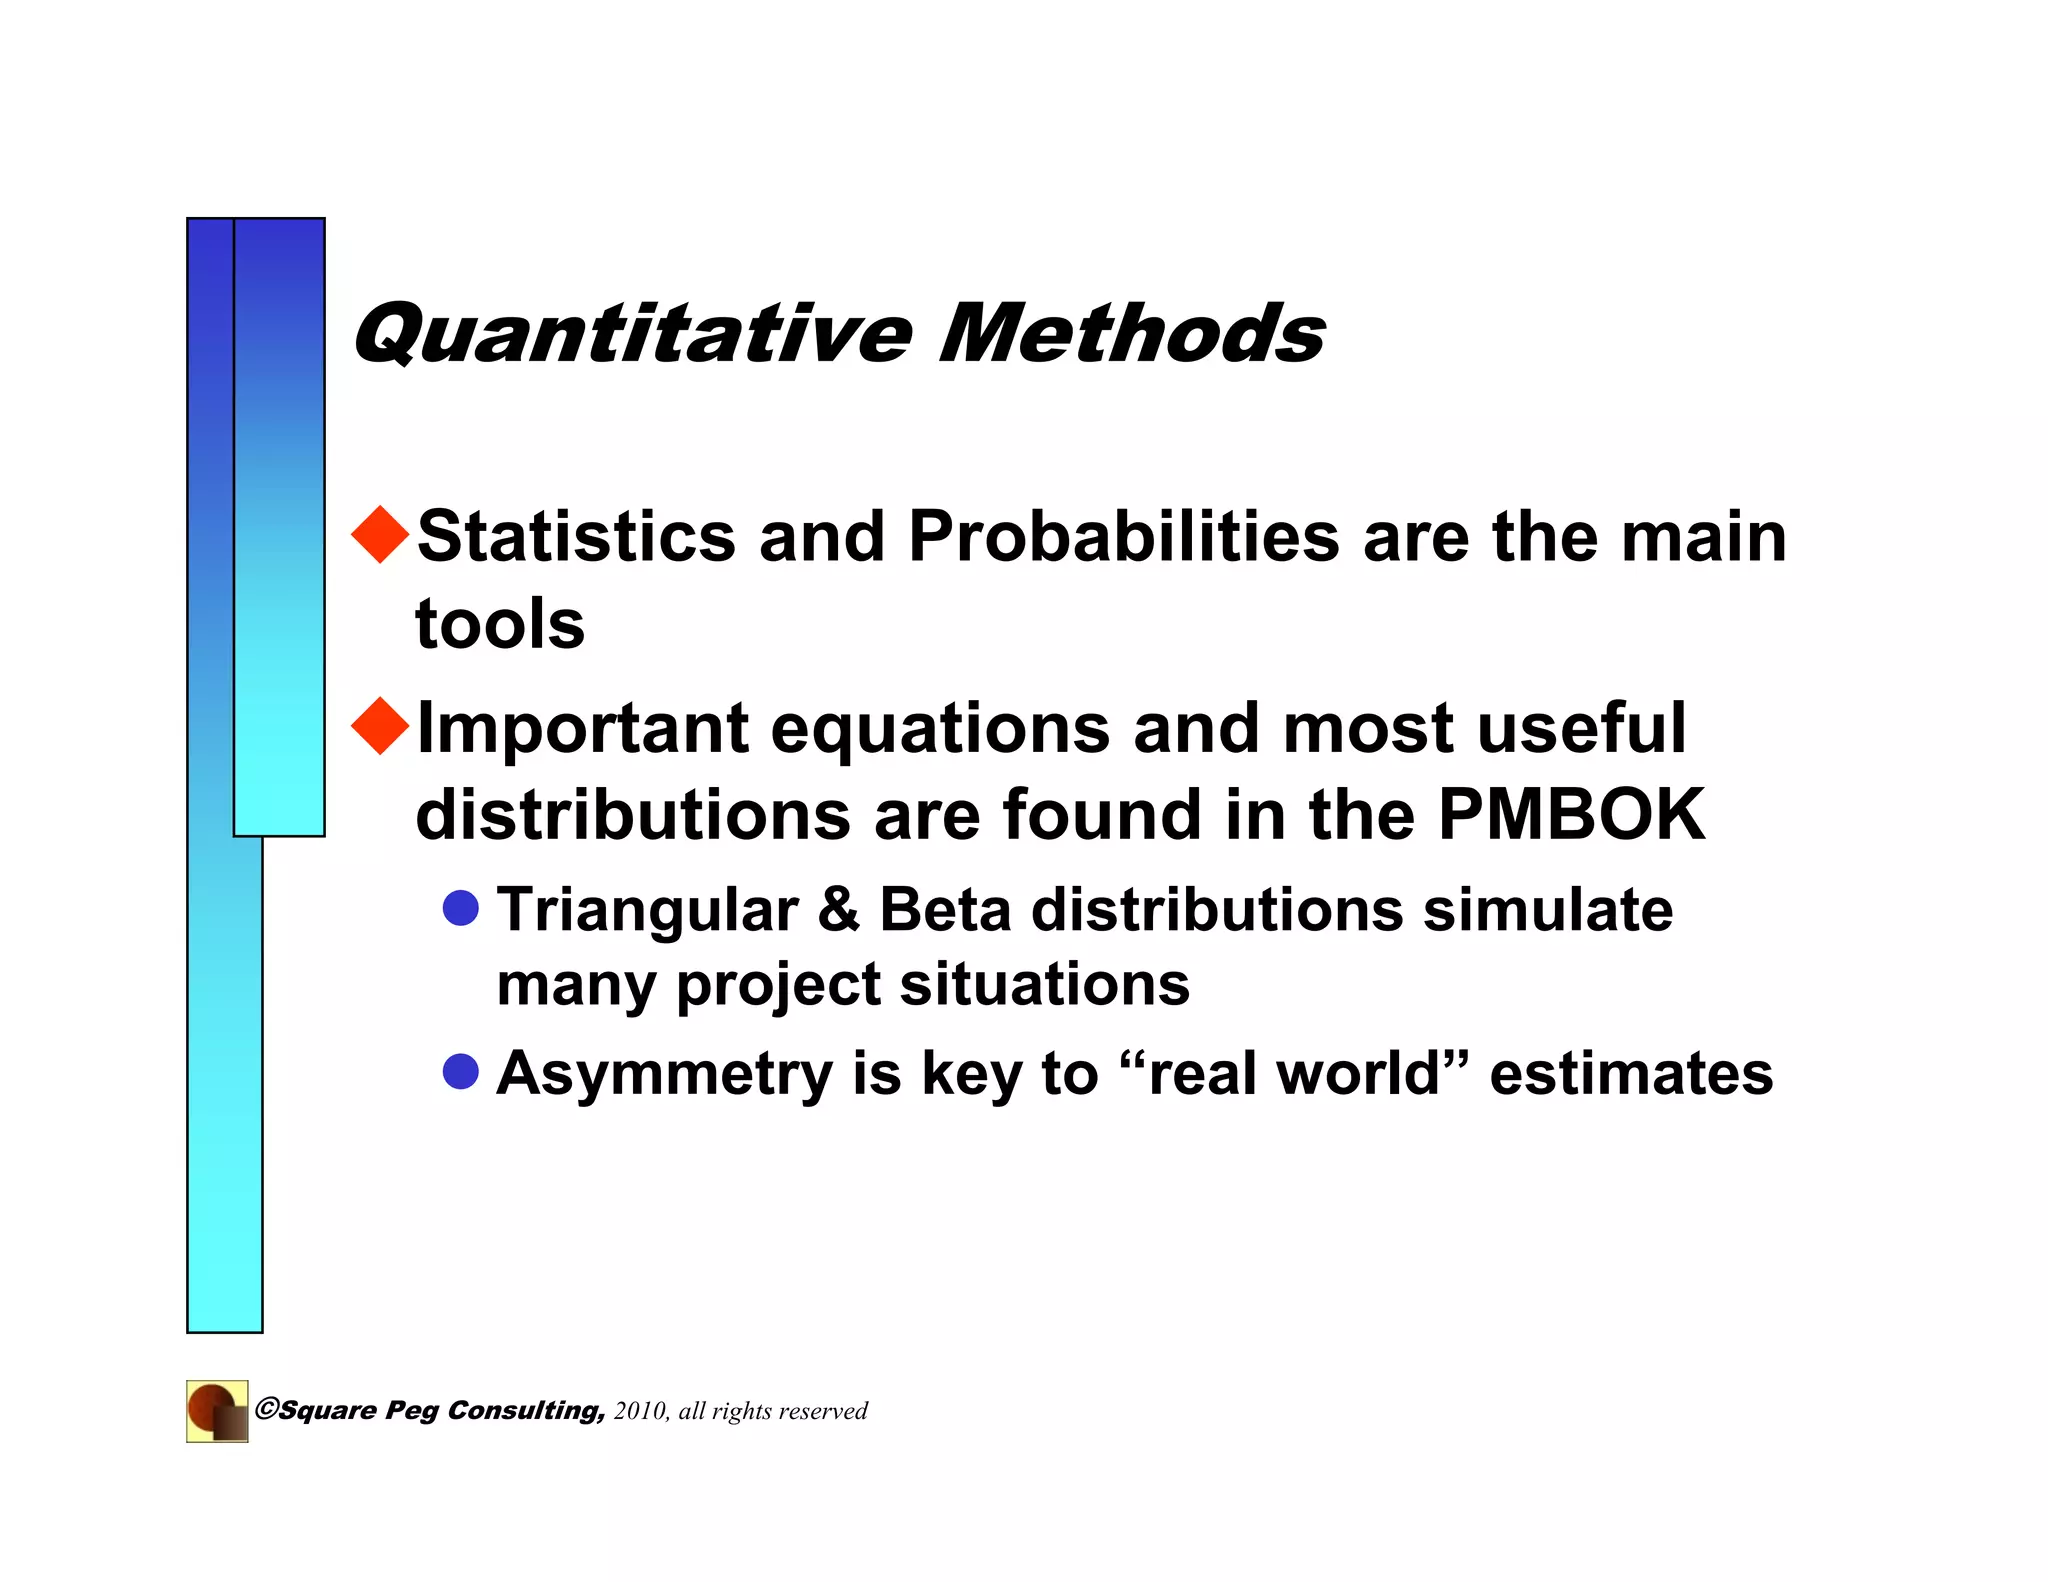
The document discusses adding quantitative risk analysis to project schedules. It recommends using statistical distributions and Monte Carlo simulation to model activity durations and understand project risks and outcomes. By breaking down long tasks and modeling their durations probabilistically, the variance of schedule estimates is reduced, providing a more accurate understanding of project risk.


