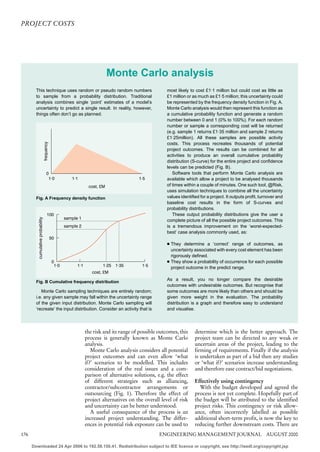
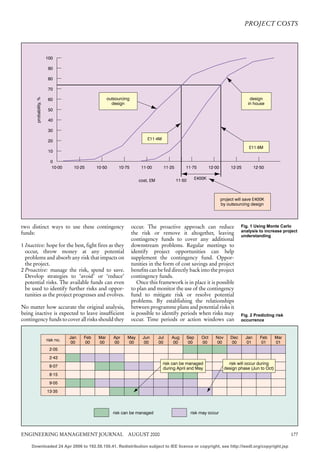
1. PROJECT COSTS
Preventing project
Project costs often increase beyond their original estimates.
This is considered inevitable and all too readily accepted as
the norm. However, by following a few considered steps
there are methods available to reduce cost escalation and
increase profit.
O
n average the UK defence industry defence industry. Many projects in the civil
needs an additional £200M a year to sector suffer similar problems (Figs. a-e).
cover unplanned problems and budget What causes this escalation? What can be
shortfalls due to escalating project costs or done to prevent it? These questions are over-
failure to meet the in-service date for equip- looked again and again. The causes generally
ment. This problem is not confined to the fall into five categories:
5 Changes to requirements: often arising
through misunderstandings or quality
changes by the end user or customer.
5 Technology costs: an eagerness to use the
latest technology or software can (should the
technology be unproven) expose the project
to technical difficulties and rework.
5 Changing quotations.
5 Organisational stability: particularly with
joint venture or alliance management, the
project team or work breakdown is often
reorganised at the first sign of trouble leading
to downstream problems.
5 Impact of risk: allowing for the unexpected is
never easy, but is key to the prevention of
excessive cost and schedule escalations.
Developing the project budget
The first, probably most crucial, step in
preventing escalation is developing the budget
or bid price. If it is poorly developed and
improperly substantiated then, no matter how
well the project goes, there is always the chance
by Karl Davey it will be insufficient. There are a number of
174 ENGINEERING MANAGEMENT JOURNAL AUGUST 2000
Downloaded 24 Apr 2006 to 192.58.150.41. Redistribution subject to IEE licence or copyright, see http://ieedl.org/copyright.jsp
2. PROJECT COSTS
cost escalation
steps that can be taken to increase the accuracy if not essential, to interview those involved in Fig. a London Millennium
of the budget: preparing line item estimates to identify any Bridge: £8M over (as of 28th
and 1 month late
budget
personal bias or hidden reasoning. Also identify June it has been closed for
5 Identify any dependent or critical assump- past trends or lessons learned from previous structural repairs, the
tions made during the development of the projects. This essential process of data works are expected to last
for several months, at an
budget. gathering will present an analysis that is based undisclosed cost)
5 Ensure accurate baseline estimates to confirm on reasoning rather than personal opinion,
that the requirements are fully understood. allowing the results to identify the causes rather
The project team’s perception may differ that just the effects of uncertainty.
from the customer’s. Finally include the effect of risk in the
5 Reflect uncertainty in the estimate. Use analysis of potential project costs. Risk should
multiple estimating techniques to generate be modelled outside the baseline estimate.
line item costs, e.g. compare parametric A more realistic and optimistic analysis is
techniques such as the PRICE parametric achieved by assigning likelihood of occurrence
cost model to that of a pure performance cost and modelling as a discrete event. Through
model and explore any difference. discussions with those involved in
5 Make allowance for risk. Use forward think- generating baseline estimates try to
ing to identify any opportunities or threats. identify if the estimate contains a level Cost exposure
Anticipate problems and evaluate their likely of inherent risk (our hidden reason-
outcome. ing). needs to be
All the information must be rationalised to Risk analysed in a way
develop accurate confidence levels for the It is easy to over-confuse risk. There that reflects the
budget. One of the most powerful methods are many derived equations and
to assess these is Monte Carlo analysis (page methods to establish a risk’s impact. A true nature of
176) using proven tools such as @Risk. popular misconception is that cost
The downside to this approach is an inherent exposure is the product of the risk’s the risk and its
scepticism in the results due, in part, to the probability and impact. For example,
attitude of consultants who place emphasis on for a project with a 50% likelihood of
range of possible
the charts and outputs rather than on the being exposed to an additional outcomes
underlying information or insights. Although a £1 000 000 the risk contingency
bell or ‘S’ curve may look good in a report, it required is thought to be 50% of
does not immediately identify the critical base- £1 000 000 (£500 000). This approach is
line estimates or potential causes of escalation. incorrect and leads to insufficient contingency
Causes of cost escalation can be identified by funds. It is important to remember that a risk’s
relating the analysis results to information impact is in fact just its impact, it does not
gathered during generation of the cost model. matter if it has a 5%, 50% or 90% likelihood of
Data gathering is the perfect opportunity to occurrence. Common sense, yes, but it is easily
identify hidden assumptions, knowledge gaps forgotten and often over-complicated during
and the logic used in estimate generation. analysis. Instead cost exposure needs to be
Before performing detailed analysis it is useful, analysed in a way that reflects the true nature of
ENGINEERING MANAGEMENT JOURNAL AUGUST 2000 175
Downloaded 24 Apr 2006 to 192.58.150.41. Redistribution subject to IEE licence or copyright, see http://ieedl.org/copyright.jsp
3. PROJECT COSTS
Monte Carlo analysis
This technique uses random or pseudo random numbers most likely to cost £1·1 million but could cost as little as
to sample from a probability distribution. Traditional £1 million or as much as £1·5 million; this uncertainty could
analysis combines single ‘point’ estimates of a model’s be represented by the frequency density function in Fig. A.
uncertainty to predict a single result. In reality, however, Monte Carlo analysis would then represent this function as
things often don’t go as planned. a cumulative probability function and generate a random
number between 0 and 1 (0% to 100%). For each random
number or sample a corresponding cost will be returned
(e.g. sample 1 returns £1·35 million and sample 2 returns
£1·25million). All these samples are possible activity
frequency
costs. This process recreates thousands of potential
project outcomes. The results can be combined for all
activities to produce an overall cumulative probability
distribution (S-curve) for the entire project and confidence
levels can be predicted (Fig. B).
0 Software tools that perform Monte Carlo analysis are
1·0 1·1 1·5 available which allow a project to be analysed thousands
cost, £M of times within a couple of minutes. One such tool, @Risk,
uses simulation techniques to combine all the uncertainty
Fig. A Frequency density function values identified for a project. It outputs profit, turnover and
baseline cost results in the form of S-curves and
probability distributions.
100 These output probability distributions give the user a
sample 1
cumulative probability
complete picture of all the possible project outcomes. This
sample 2 is a tremendous improvement on the ‘worst-expected-
best’ case analysis commonly used, as:
50
4 They determine a ‘correct’ range of outcomes, as
uncertainty associated with every cost element has been
rigorously defined.
0 4 They show a probability of occurrence for each possible
1·0 1·1 1·25 1·35 1·5
project outcome in the predict range.
cost, £M
As a result, you no longer compare the desirable
Fig. B Cumulative frequency distribution
outcomes with undesirable outcomes. But recognise that
Monte Carlo sampling techniques are entirely random; some outcomes are more likely than others and should be
i.e. any given sample may fall within the uncertainty range given more weight in the evaluation. The probability
of the given input distribution. Monte Carlo sampling will distribution is a graph and therefore easy to understand
‘recreate’ the input distribution. Consider an activity that is and visualise.
the risk and its range of possible outcomes, this determine which is the better approach. The
process is generally known as Monte Carlo project team can be directed to any weak or
analysis. uncertain areas of the project, leading to the
Monte Carlo analysis considers all potential firming of requirements. Finally if the analysis
project outcomes and can even allow ‘what is undertaken as part of a bid then any studies
if?’ scenarios to be modelled. This includes or ‘what if?’ scenarios increase understanding
consideration of the real issues and a com- and therefore ease contract/bid negotiations.
parison of alternative solutions, e.g. the effect
of different strategies such as alliancing, Effectively using contingency
contractor/subcontractor arrangements or With the budget developed and agreed the
outsourcing (Fig. 1). Therefore the effect of process is not yet complete. Hopefully part of
project alternatives on the overall level of risk the budget will be attributed to the identified
and uncertainty can be better understood. project risks. This contingency or risk allow-
A useful consequence of the process is an ance, often incorrectly labelled as possible
increased project understanding. The differ- additional short-term profit, is now the key to
ences in potential risk exposure can be used to reducing further downstream costs. There are
176 ENGINEERING MANAGEMENT JOURNAL AUGUST 2000
Downloaded 24 Apr 2006 to 192.58.150.41. Redistribution subject to IEE licence or copyright, see http://ieedl.org/copyright.jsp
4. PROJECT COSTS
100
90
80
70
probability, %
60 outsourcing design
design in house
50
40
30
20 £11·4M
£11·8M
10
0
10·00 10·25 10·50 10·75 11·00 11·25 11·75 12·00 12·25 12·50
11·50 £400K
cost, £M
project will save £400K
by outsourcing design
two distinct ways to use these contingency occur. The proactive approach can reduce Fig. 1 Using Monte Carlo
analysis to increase project
funds: the risk or remove it altogether, leaving understanding
contingency funds to cover any additional
1 Inactive: hope for the best, fight fires as they downstream problems. Regular meetings to
occur, throw money at any potential identify project opportunities can help
problems and absorb any risk that impacts on supplement the contingency fund. Oppor-
the project. tunities in the form of cost savings and project
2 Proactive: manage the risk, spend to save. benefits can be fed directly back into the project
Develop strategies to ‘avoid’ or ‘reduce’ contingency funds.
potential risks. The available funds can even Once this framework is in place it is possible
be used to identify further risks and oppor- to plan and monitor the use of the contingency
tunities as the project progresses and evolves. fund to mitigate risk or resolve potential
problems. By establishing the relationships
No matter how accurate the original analysis, between programme plans and potential risks it
being inactive is expected to leave insufficient is possible to identify periods when risks may Fig. 2 Predicting risk
contingency funds to cover all risks should they occur. Time periods or action windows can occurrence
Jan Feb Mar Apr May Jun Jul Aug Sep Oct Nov Dec Jan Feb Mar
risk no.
00 00 00 00 00 00 00 00 00 00 00 00 01 01 01
2·05
2·43
risk can be managed risk will occur during
8·07
during April and May design phase (Jun to Oct)
8·15
9·05
13·35
risk can be managed risk may occur
ENGINEERING MANAGEMENT JOURNAL AUGUST 2000 177
Downloaded 24 Apr 2006 to 192.58.150.41. Redistribution subject to IEE licence or copyright, see http://ieedl.org/copyright.jsp
5. PROJECT COSTS
Fig. b Eurofighter Typhoon:
£1500M over budget and 42
months late
be identified when risk mitigation can be actions several months into the project, all
effectively applied (Fig. 2). These plans can of which need funding. Aggressive, selfish
be reflected in a spend-profile and the effect on management of the contingency fund is
the remaining contingency fund derived. As the required. The risk manager must ensure that
project progresses the contingency spend can unspent funds remain within the contingency
be updated to reflect actual spend to date. When budget and are assigned to new or revised
displayed graphically contingency tracking management actions.
provides a valuable insight into the potential of This may be difficult, but by demonstrating
additional cost exposure (Fig. 3). the effect on the project budget and final profit
Should the associated contingency funds be of failing to manage new risks the need for
released as profit if risks do not occur? This reallocation of funds can be clearly seen. To
common approach is shortsighted as the levels create this visibility regular cost risk analysis,
of risk change during any project. New risks are and revised S-curves and contingency require-
Fig. 3 Monitoring and
planning contingency identified and others change in significance, ments are essential. This analysis should form
spend resulting in new priorities and management part of an overall risk analysis report that is
actual spend to date predicted spend
450 000 1600 000
400 000 1400 000
contingency remaining, £
350 000 1200 000
monthly costs 1000 000
300 000 contingency remaining
cost, £
800 000
250 000
600 000
200 000
400 000
150 000
200 000
100 000 0
50 000 –200 000
0 –400 000
Feb 00 Mar 00 Apr 00 May 00 Jun 00 Jul 00 Aug 00 Sep 00 Oct 00
period
contingency will
run out before
end of project
178 ENGINEERING MANAGEMENT JOURNAL AUGUST 2000
Downloaded 24 Apr 2006 to 192.58.150.41. Redistribution subject to IEE licence or copyright, see http://ieedl.org/copyright.jsp
6. PROJECT COSTS
passed up the management chain to demon-
strate how the final project profit may be at risk
should short-term objectives take priority. identify identify
The final key to prevention of cost escalation assumptions risks
is the timely execution of management actions,
developed to mitigate risks and to ensure
opportunities are realised. Ideally a co- key risk issues/themes
cost drivers
ordinated approach is required to track the risk impact timescale
management process, the action plans and hotspots and trends
contingency spend. The approach is labour
intensive but there are tools available, such as plan mitigation
REMIS (risk evaluation and management strategy
windows
information system), that support a proactive
approach to risk management and contingency identify opportunities
development and tracking (Fig. 4). database cost benefits
A central risk management tool directs timescale reductions
performance increases
attention to issues that significantly influence
the project. The effectiveness and progress of key risks
contingency requirements
the mitigation actions can be monitored. Trends action plans
and hot spots can be quickly assessed. Using a contingency tracking
database approach allows an audit trail of the
risk management process to be stored such that
the complete history for each risk is created.
The origin of a risk can then be recorded and all
subsequent lifecycle changes noted. The risk management process had to become Fig. 4 Sample risk
It must always be the process which drives an integral part of project culture, not a management approach
the tool and not vice versa. If low-quality standalone science burdening the project team
information is entered then no matter how and its resources. It had to be continuous and
thorough the analysis something will always be proactive.
missed. In summary the tool is there to support The first step was a high-level risk assessment
the process and aid the burden of the project of the potential risks faced by the project. This
team, help communication and ensure that initiated a review of the infrastructure and
Fig. c Spearfish: £186M
management actions are pursued. support facilities and an assessment of the over budget and 75 months
construction risk for the future build and late
Example
The bid price for a major UK capital works
project was reviewed to ensure it considered all
uncertainty while remaining competitive. The
project would not be risk-free, a fact that was
appreciated by all parties including the ultimate
customer. Therefore the potential bidder had to
undertake detailed risk assessment and describe
their framework for addressing the risk issues
and means to prevent cost escalation. It was
determined that the following risk management
activities would be required to support the bid
and project:
5 a risk analysis on the scope of work and
customer requirements
5 a cost assessment of the baseline cost estimate
and inherent uncertainty
5 cost and timescale risk analysis
5 generation of a contingency fund
5 development of mitigation strategies and risk
responses.
ENGINEERING MANAGEMENT JOURNAL AUGUST 2000 179
Downloaded 24 Apr 2006 to 192.58.150.41. Redistribution subject to IEE licence or copyright, see http://ieedl.org/copyright.jsp
7. PROJECT COSTS
100
90 post management
cost exposure
80 recommended contingency requirement
project risks
and uncertainty
70 ≈£50 million
confidence, %
60
estimated bid price
50
40
30
bid cost no risk
(uncertainty)
20
pre management
exposure
10
0
425 450 475 500 525 550 575 600 625 650 675
cost exposure, £M
Fig. 5 Project S-curves refurbishment activities. included both the uncertainty estimates for
These risks were then validated and assessed each line item in the baseline cost breakdown
against consistent assessment criteria ensuring and the identified risks, mapped as discrete
each risk was based on reasoning, not personal elements. Monte Carlo analysis on this cost
bias. The risks were formally agreed with all model provided a number of interesting results.
parties and subcontractor/partner risks incor- The current bid price had a 50% chance of
porated. This formed the basis of the formal being sufficient. Above the 50% point the cost
project risk register. Detailed costs for the exposure could be significant. In fact from the
potential impact of each risk were estimated results, in an extreme case the additional cost of
and any estimating uncertainty in the bid price the potential unmanaged risks could be in the
identified. region of £190M. Sensitivity analysis showed
Fig. d Merlin (EH101):
£815M over budget and 62 A cost model was produced based on this was due to a number of low probability,
months late the project work breakdown structure and high cost risks. In this case it would be neces-
sary to ensure that robust mitigation strategies
were identified, costed and ownership agreed.
A revised cost model was produced (Fig. 6)
which reflected the post mitigation status of the
project. The cost model now included the
mitigation costs based on the risk management
strategies and the cost of any risk residues
remaining. Based on this and the previous
analysis it was deemed that a risk contingency
fund in the region of £50M would be required
to cover the identified risk and uncertainty.
The cost was justified to the customer, since
it would allow the product to be built to the
required specification within timescale and
budget. To this end the customer undertook an
audit of the bid price and an assessment of the
risk contingency requirement.
During this audit and negotiation period the
180 ENGINEERING MANAGEMENT JOURNAL AUGUST 2000
Downloaded 24 Apr 2006 to 192.58.150.41. Redistribution subject to IEE licence or copyright, see http://ieedl.org/copyright.jsp