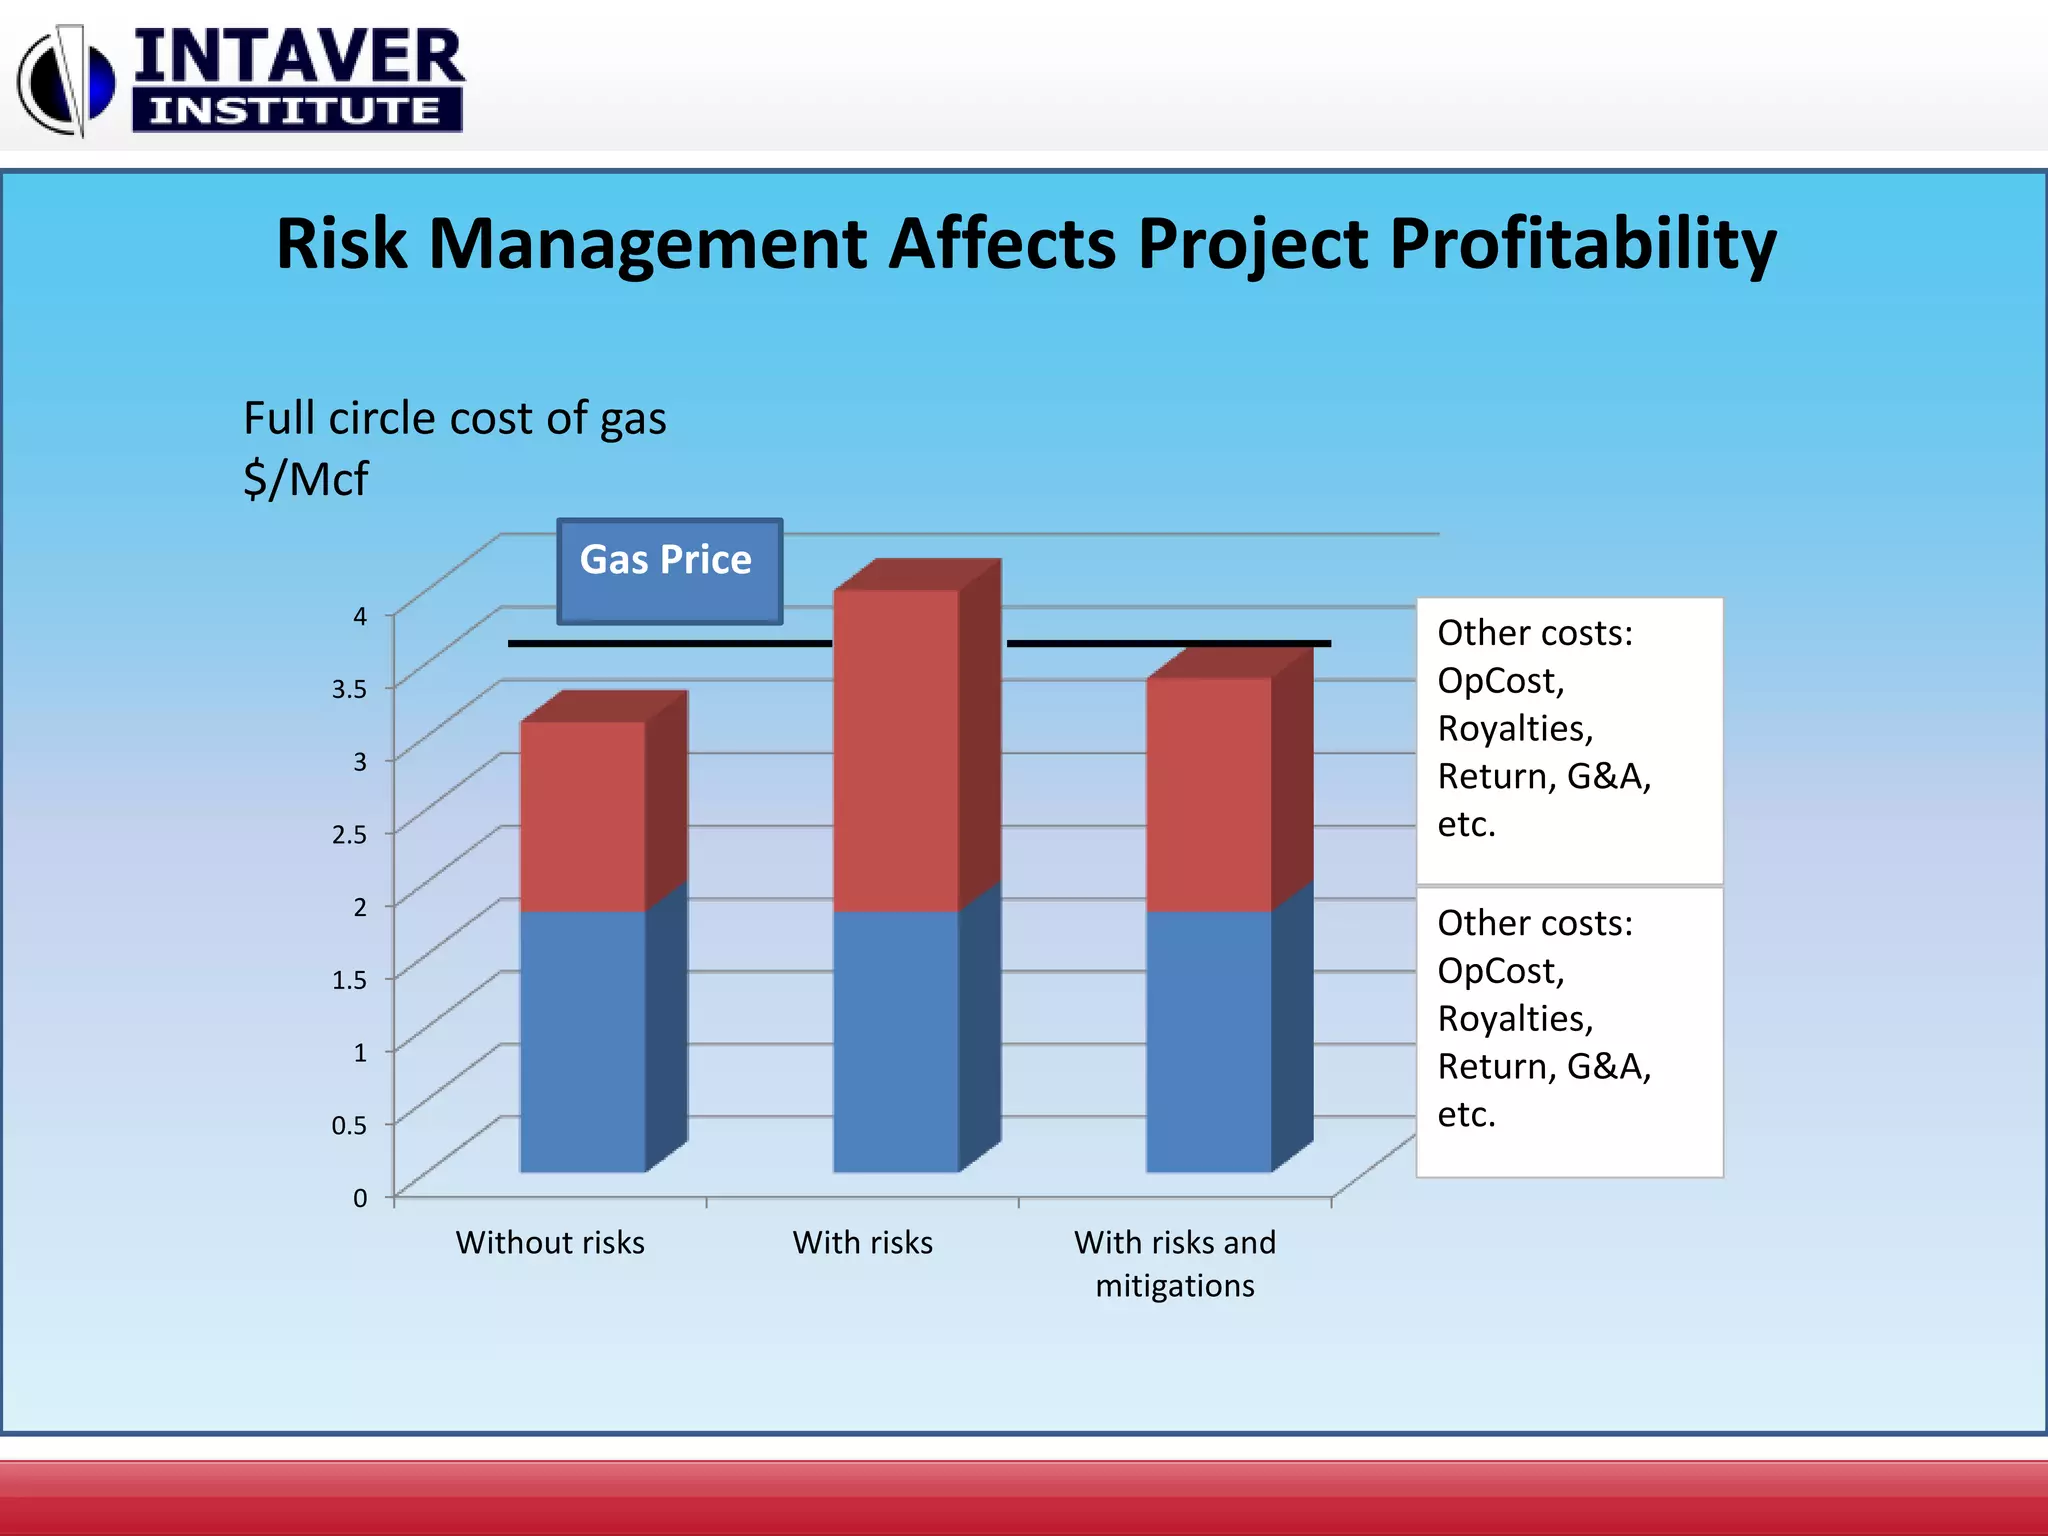
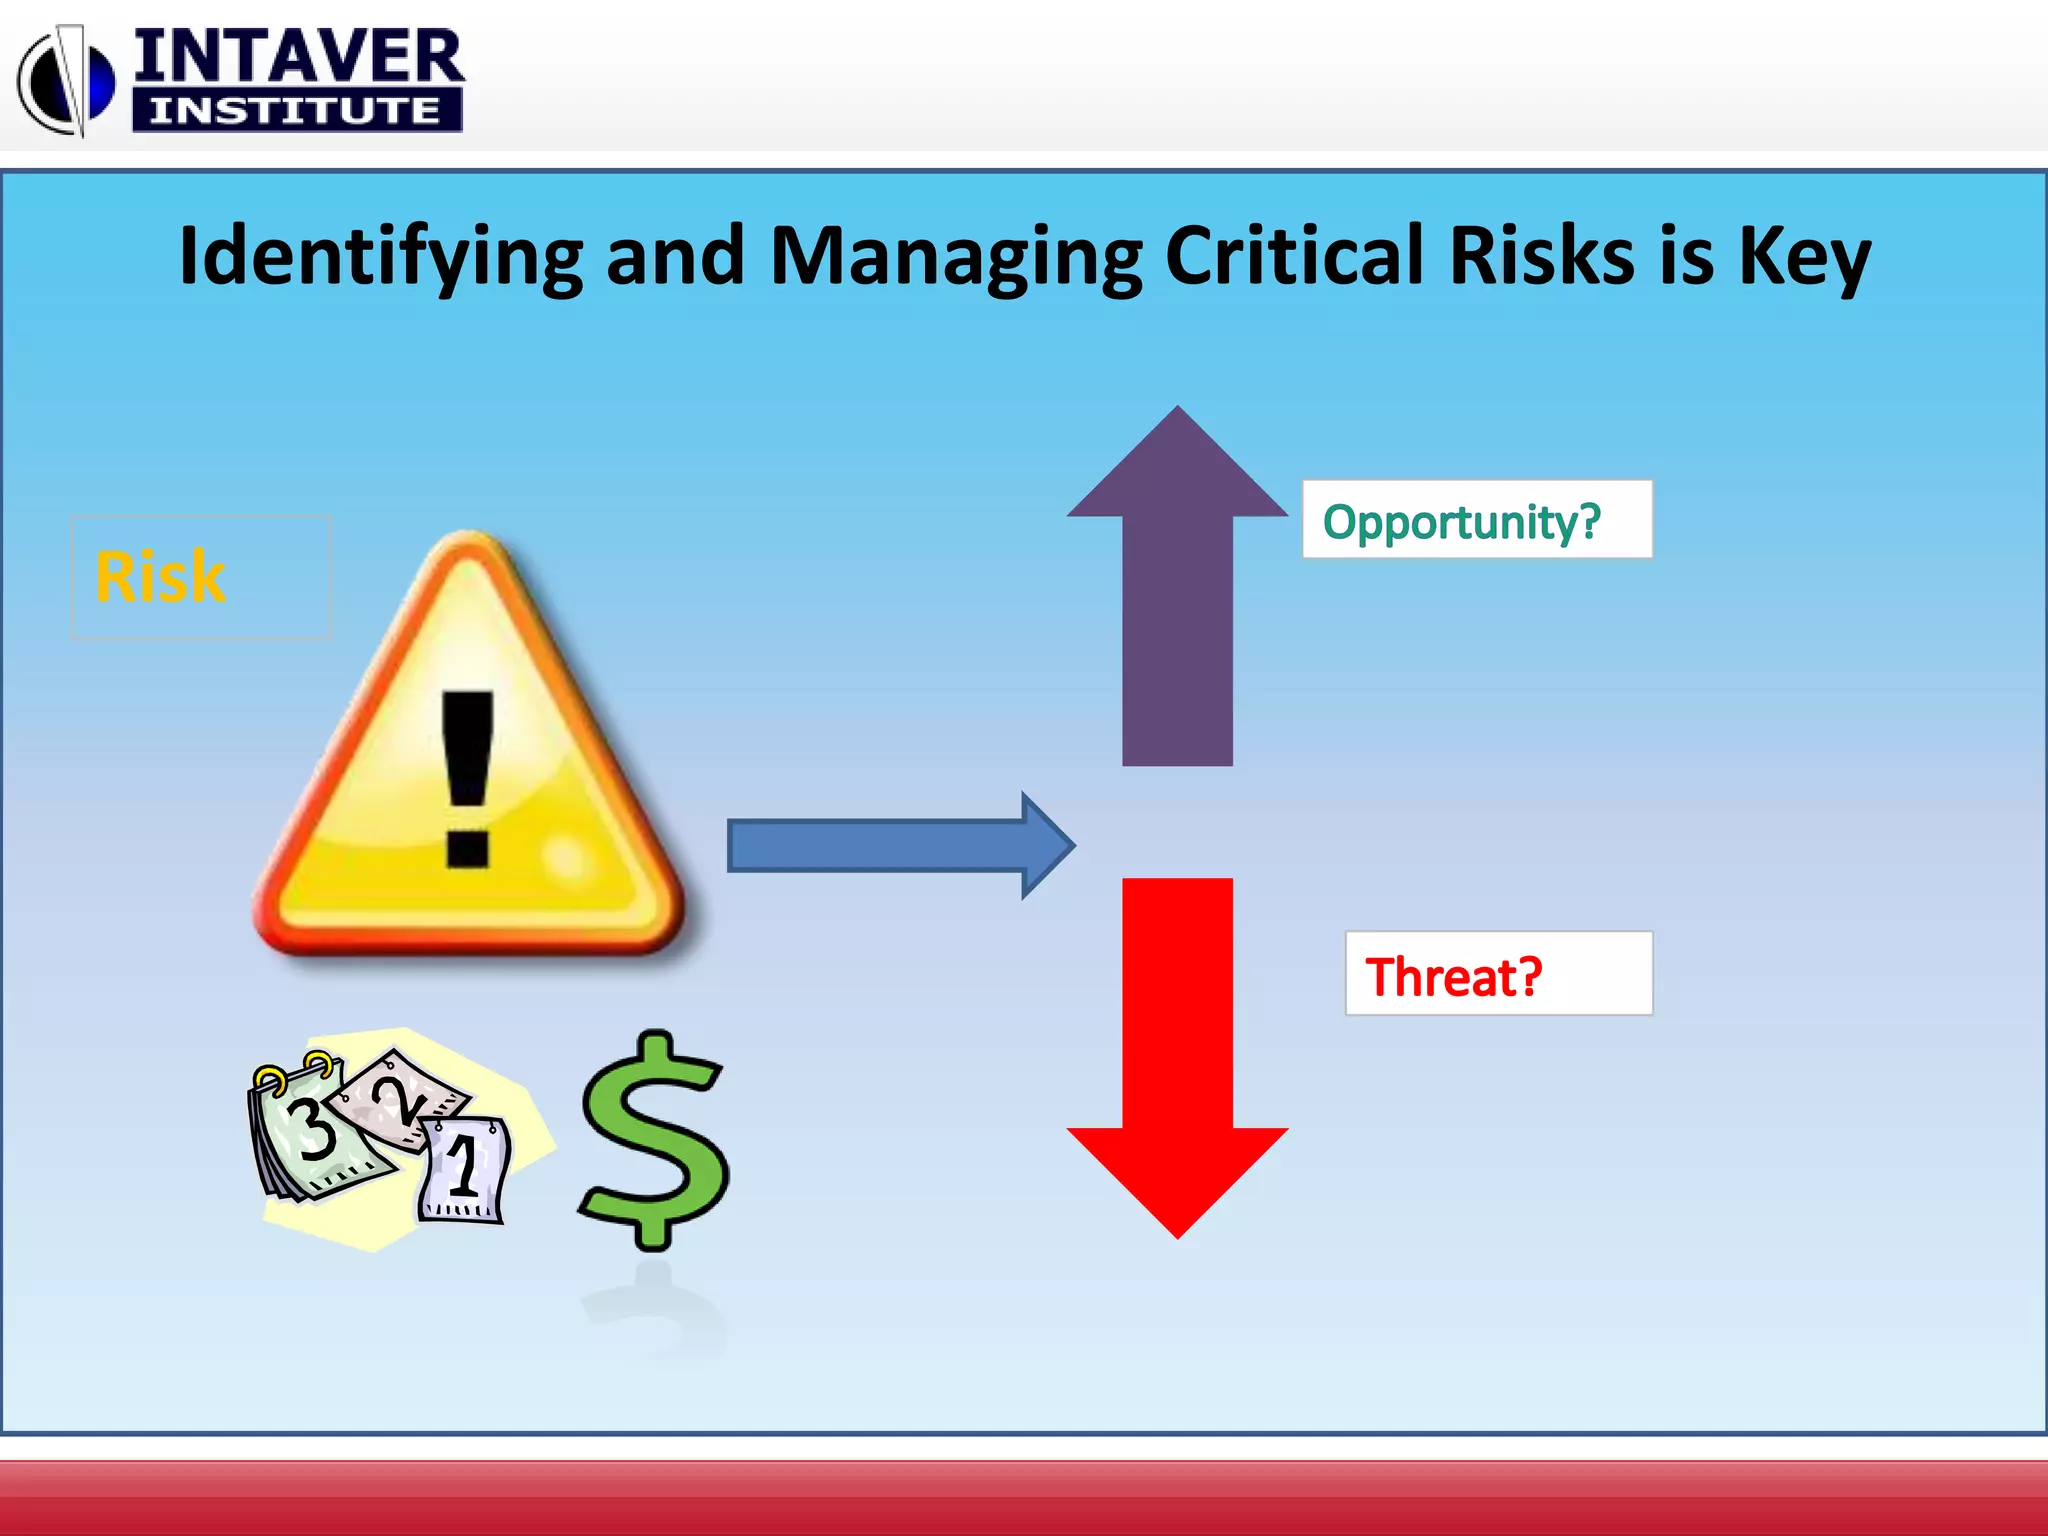
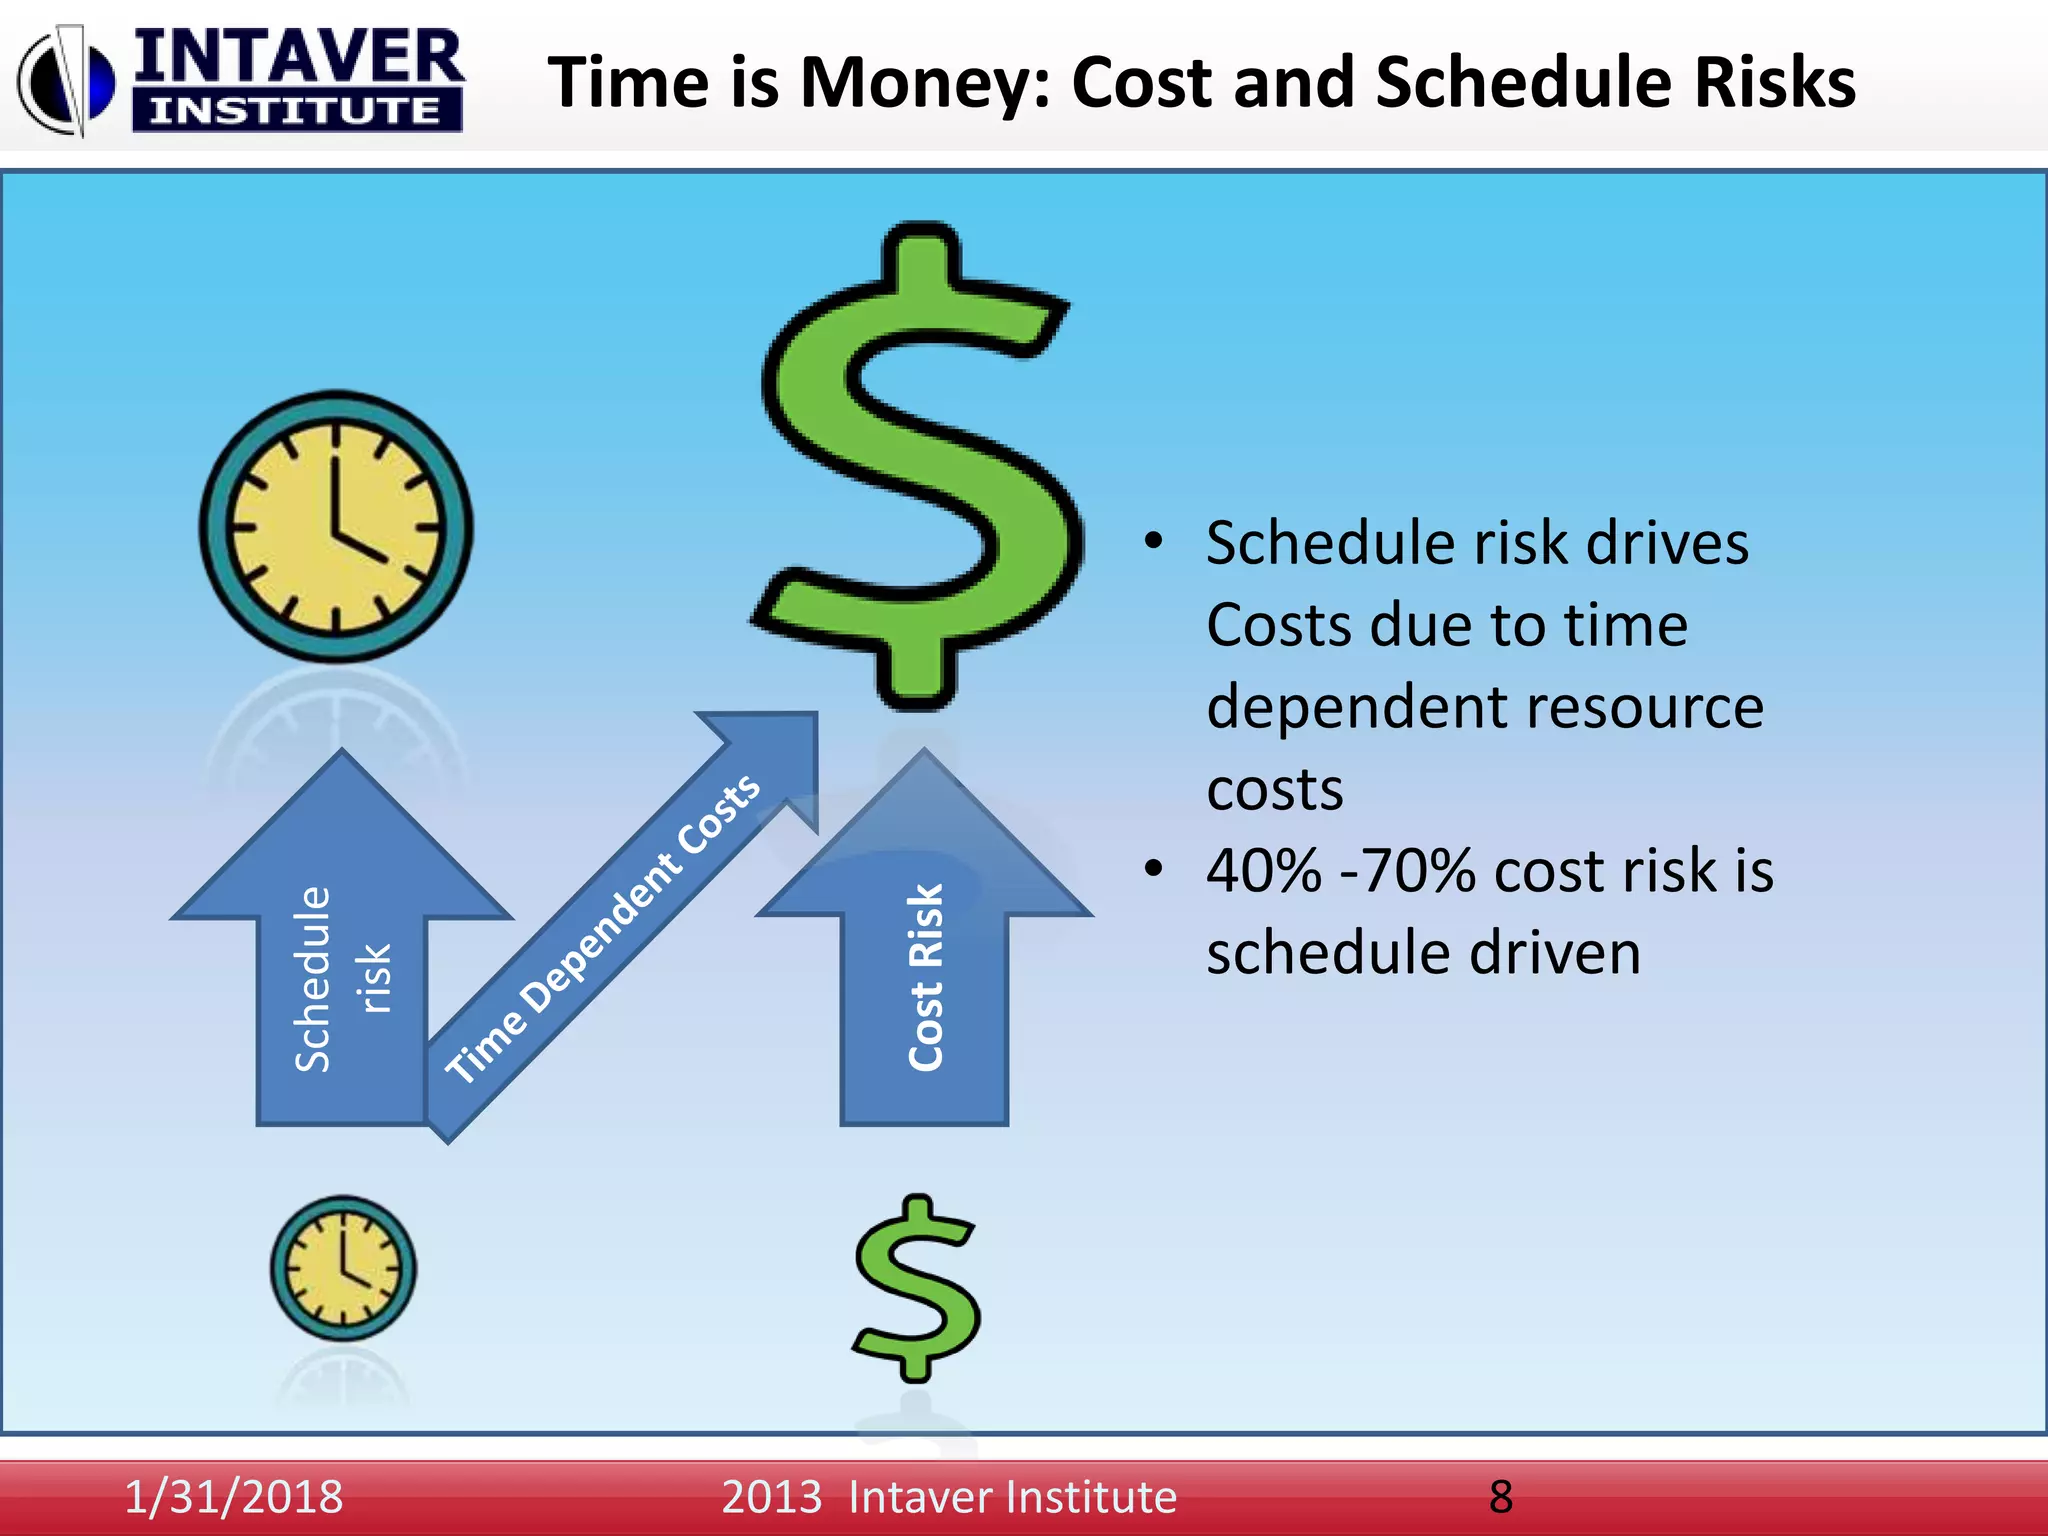
Webinar: Risk
Management for Oil and
Gas Projects
Intaver Institute Inc.
303, 6707, Elbow Drive S.W, Calgary, AB, Canada
Tel: +1(403)692-2252
Fax: +1(403)459-4533
www.intaver.com
Introduction
• Intaver Institute Timeline
– 2002: Established
– 2004: V.1 RiskyProject
– 2009: v 3 Integrated Risk Register
– 2012: v 5
• RiskyProject
– Full Project Risk Management Lifecycle
– Integrated Risk Register
– Risk Matrix, Risk Planning
+
– Quantitative Monte Carlo Cost and
Schedule Risk Analysis
Clients
0
5
10
15
20
25
30
35
40
45
50
2003 2007 March, 2009 September,
2009
September,
2011, First
Phase
Gorgon Natural Gas Project
Project Cost Estimate in Billions A$
Date of cost estimate
A three-train liquefied natural gas (LNG) facility on Barrow Island
(Australia) that will produce 15.6 million metric tons of LNG per year.
Project Risk Analysis in Portfolio Management
Process
Project Cost and
Schedule risks and
uncertainties
Geological and other
Uncertainties affecting
production
Price Uncertainties
Other Risks and
Uncertainties:
- Political risks
- Uncertainties in
Royalties regimes
- ….
Economic
Analysis of the
Projects
Corporate
Portfolio
Management
Strategic
Decision
Risk Management Affects Project Profitability
0
0.5
1
1.5
2
2.5
3
3.5
4
Without risks With risks With risks and
mitigations
Other costs:
OpCost,
Royalties,
Return, G&A,
etc.
Other costs:
OpCost,
Royalties,
Return, G&A,
etc.
Gas Price
Full circle cost of gas
$/Mcf
Identifying and Managing Critical Risks is Key
Risk
Which risks are critical?
Risk 3
Risk 4
Risk 1
Risk 5
Risk 2
Risk 1
Risk 2
Risk 3
Risk 4
Risk 5
Schedule
risk
CostRisk
SafetyRisk
LegalRisk
Quality
Risk
……………..
Risk
Enviromen
talRisk
CostRisk
Time is Money: Cost and Schedule Risks
1/31/2018 2013 Intaver Institute 8
• Schedule risk drives
Costs due to time
dependent resource
costs
• 40% -70% cost risk is
schedule driven
Schedule
risk
Input 1: Project Schedule
Input 2: List of Risks (Risk Register)
Assign Risks to Project Tasks and
Resources
Perform
Analysis
Risk Events Approach
Schedule
Costs
Resources
Risk Register
Risk Assignment
Task R1 R2 R3 R4 R5 R6
Installing Microsoft Seismic
monitoring
x x
Deliver frac fleet and install
equipment
x
Deliver rig and equipment x
Well 1,2,3 (share common risks) x
Rig Mobilization x
Drilling x x x x
Installing Service Rig x
Completion (8 stages fracing) x x
Risk Assignment Interface
30 % chance that risk causes a
delay and increase in cost of
drilling
Risk Assigned to task ‘Drilling’
Run Monte Carlo Simulation
Results of Analysis
Risk Adjusted Project Schedule
Schedule with risks
Schedule without risks
Arrows show risk
assignments
Project Cost
Schedule with risks
Schedule without
risks
Risk Planning – Mitigation Plan
Pre and Post Mitigation
Pre-
mitigation
Post-
mitigation
Risk Planning
Risk: Mechanical Problem with instrument
Post Mitigation $16, 734, 906Pre-Mitigation Cost 17, 178, 397
RiskyProject Enterprise
Enterprise Risk
Database:
Schedules,
Risks,
Mitigation Plans
RiskyProject Professional
RiskyProject Lite
RiskyProject Web
Future Reading
24
Project Think:
Why Good
Managers Make
Poor Project
Choices
Project Decisions: The
Art and Science
Introduction to
Project Risk
Management and
Decision Analysis
Project Risk Analysis
Made Ridiculously
Simple
Future Reading
• P. Leach. 2005. Late and Over Budget: Why Projects Always Seem to Take Longer and
Cost More Than Planned. Projects & Profits, Vol. V Issue - XI, November 2005
• http://www.project decisions.org
• http://www.intaver.com/index-whitepapers.html
• http://www.risk-doctor.com/
• http://www.projectrisk.com
Contact
Michael Trumper
mtrumper@intaver.com
403.692.2252
Intaver Institute Inc.
www.intaver.com

Oil and Gas Risk Analysis

  • 1.
    Webinar: Risk Management forOil and Gas Projects Intaver Institute Inc. 303, 6707, Elbow Drive S.W, Calgary, AB, Canada Tel: +1(403)692-2252 Fax: +1(403)459-4533 www.intaver.com
  • 2.
    Introduction • Intaver InstituteTimeline – 2002: Established – 2004: V.1 RiskyProject – 2009: v 3 Integrated Risk Register – 2012: v 5 • RiskyProject – Full Project Risk Management Lifecycle – Integrated Risk Register – Risk Matrix, Risk Planning + – Quantitative Monte Carlo Cost and Schedule Risk Analysis Clients
  • 3.
    0 5 10 15 20 25 30 35 40 45 50 2003 2007 March,2009 September, 2009 September, 2011, First Phase Gorgon Natural Gas Project Project Cost Estimate in Billions A$ Date of cost estimate A three-train liquefied natural gas (LNG) facility on Barrow Island (Australia) that will produce 15.6 million metric tons of LNG per year.
  • 4.
    Project Risk Analysisin Portfolio Management Process Project Cost and Schedule risks and uncertainties Geological and other Uncertainties affecting production Price Uncertainties Other Risks and Uncertainties: - Political risks - Uncertainties in Royalties regimes - …. Economic Analysis of the Projects Corporate Portfolio Management Strategic Decision
  • 5.
    Risk Management AffectsProject Profitability 0 0.5 1 1.5 2 2.5 3 3.5 4 Without risks With risks With risks and mitigations Other costs: OpCost, Royalties, Return, G&A, etc. Other costs: OpCost, Royalties, Return, G&A, etc. Gas Price Full circle cost of gas $/Mcf
  • 6.
    Identifying and ManagingCritical Risks is Key Risk
  • 7.
    Which risks arecritical? Risk 3 Risk 4 Risk 1 Risk 5 Risk 2 Risk 1 Risk 2 Risk 3 Risk 4 Risk 5 Schedule risk CostRisk SafetyRisk LegalRisk Quality Risk …………….. Risk Enviromen talRisk
  • 8.
    CostRisk Time is Money:Cost and Schedule Risks 1/31/2018 2013 Intaver Institute 8 • Schedule risk drives Costs due to time dependent resource costs • 40% -70% cost risk is schedule driven Schedule risk
  • 9.
    Input 1: ProjectSchedule Input 2: List of Risks (Risk Register) Assign Risks to Project Tasks and Resources Perform Analysis Risk Events Approach
  • 10.
  • 11.
  • 12.
  • 13.
  • 14.
    Risk Assignment Task R1R2 R3 R4 R5 R6 Installing Microsoft Seismic monitoring x x Deliver frac fleet and install equipment x Deliver rig and equipment x Well 1,2,3 (share common risks) x Rig Mobilization x Drilling x x x x Installing Service Rig x Completion (8 stages fracing) x x
  • 15.
    Risk Assignment Interface 30% chance that risk causes a delay and increase in cost of drilling Risk Assigned to task ‘Drilling’
  • 16.
    Run Monte CarloSimulation
  • 17.
  • 18.
    Risk Adjusted ProjectSchedule Schedule with risks Schedule without risks Arrows show risk assignments
  • 19.
    Project Cost Schedule withrisks Schedule without risks
  • 20.
    Risk Planning –Mitigation Plan
  • 21.
    Pre and PostMitigation Pre- mitigation Post- mitigation
  • 22.
    Risk Planning Risk: MechanicalProblem with instrument Post Mitigation $16, 734, 906Pre-Mitigation Cost 17, 178, 397
  • 23.
    RiskyProject Enterprise Enterprise Risk Database: Schedules, Risks, MitigationPlans RiskyProject Professional RiskyProject Lite RiskyProject Web
  • 24.
    Future Reading 24 Project Think: WhyGood Managers Make Poor Project Choices Project Decisions: The Art and Science Introduction to Project Risk Management and Decision Analysis Project Risk Analysis Made Ridiculously Simple
  • 25.
    Future Reading • P.Leach. 2005. Late and Over Budget: Why Projects Always Seem to Take Longer and Cost More Than Planned. Projects & Profits, Vol. V Issue - XI, November 2005 • http://www.project decisions.org • http://www.intaver.com/index-whitepapers.html • http://www.risk-doctor.com/ • http://www.projectrisk.com Contact Michael Trumper mtrumper@intaver.com 403.692.2252 Intaver Institute Inc. www.intaver.com

Editor's Notes

  • #13 To model schedule driven cost, we have included high level resources that have been assigned to specific tasks.