Download to read offline

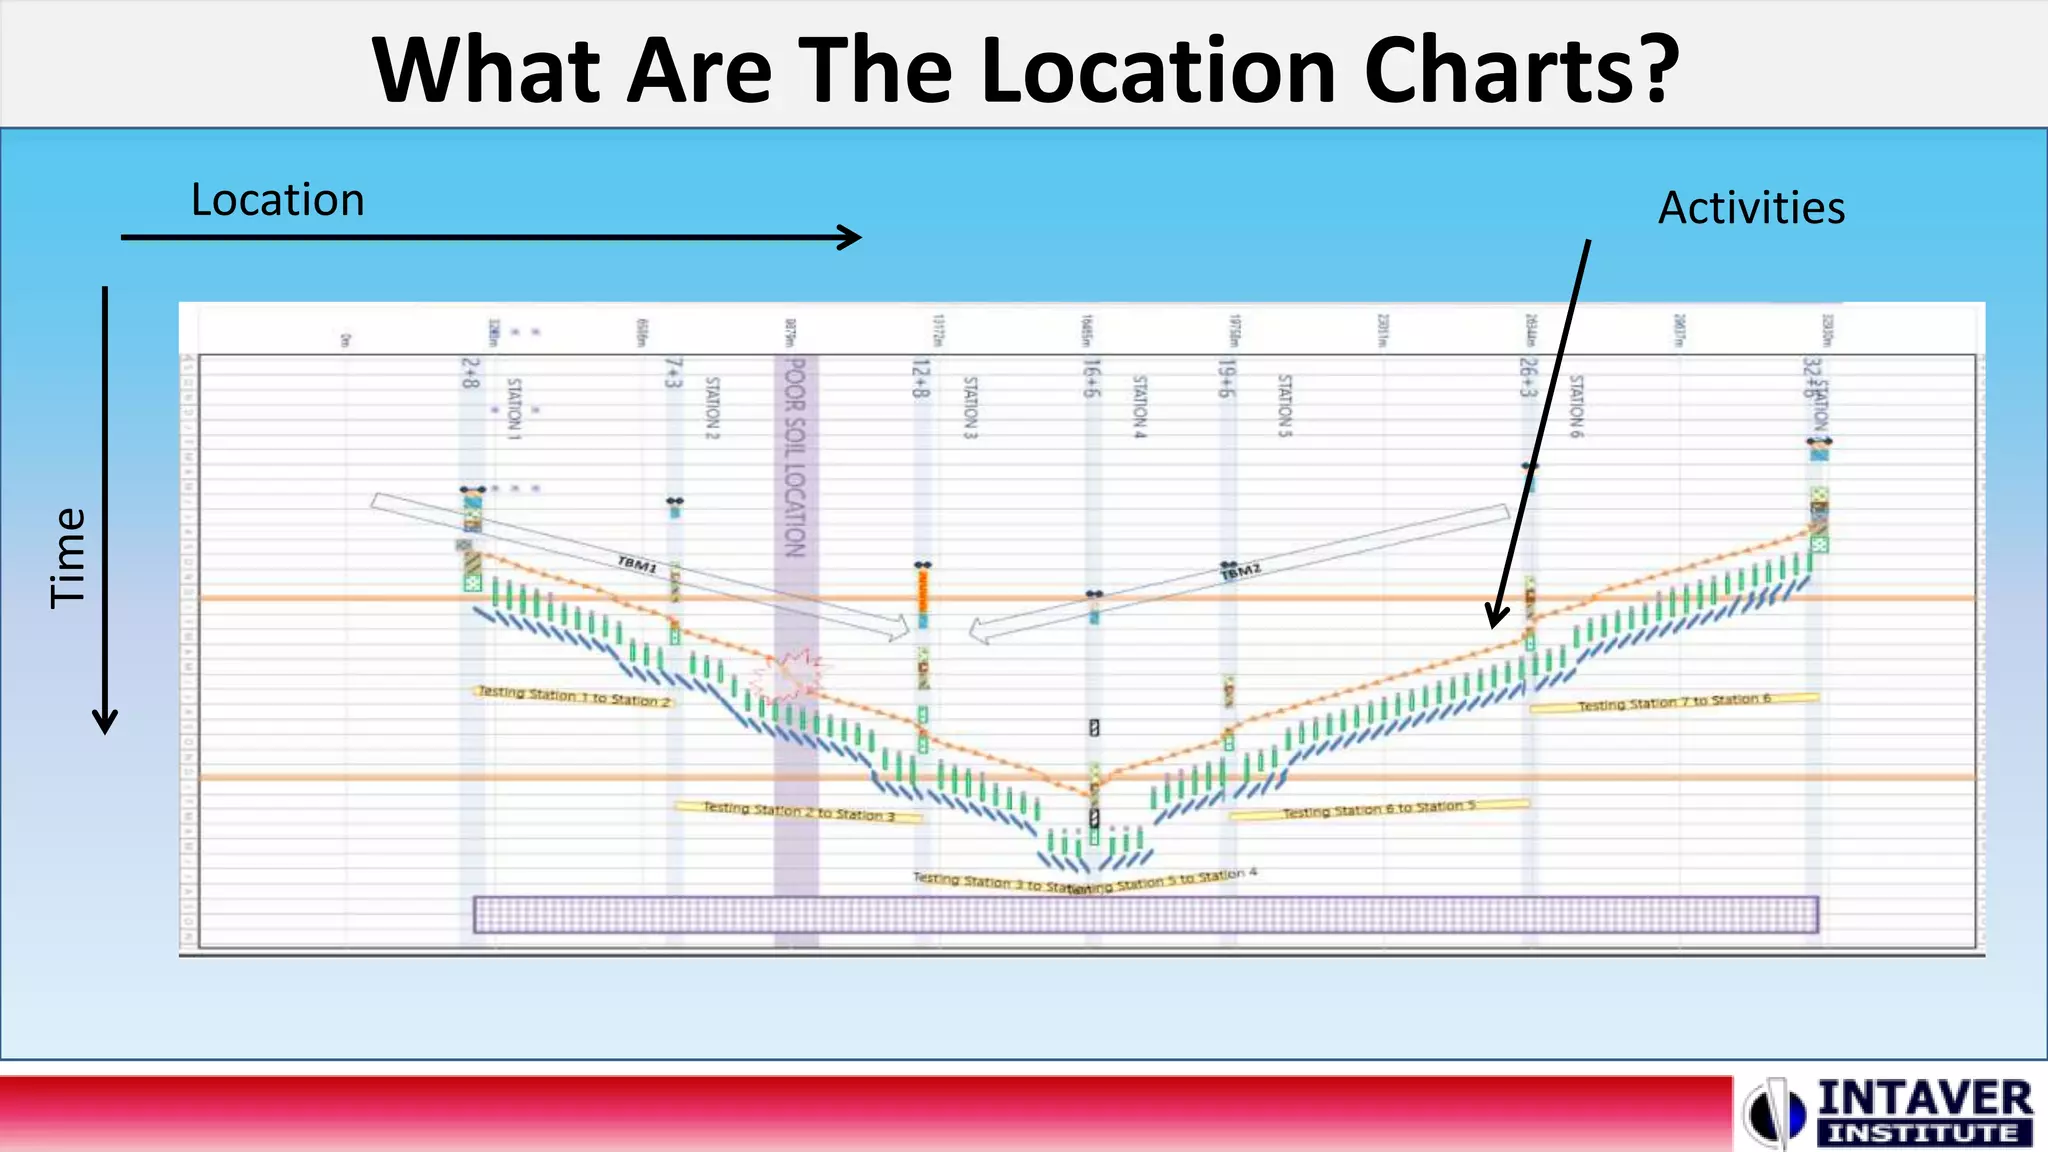
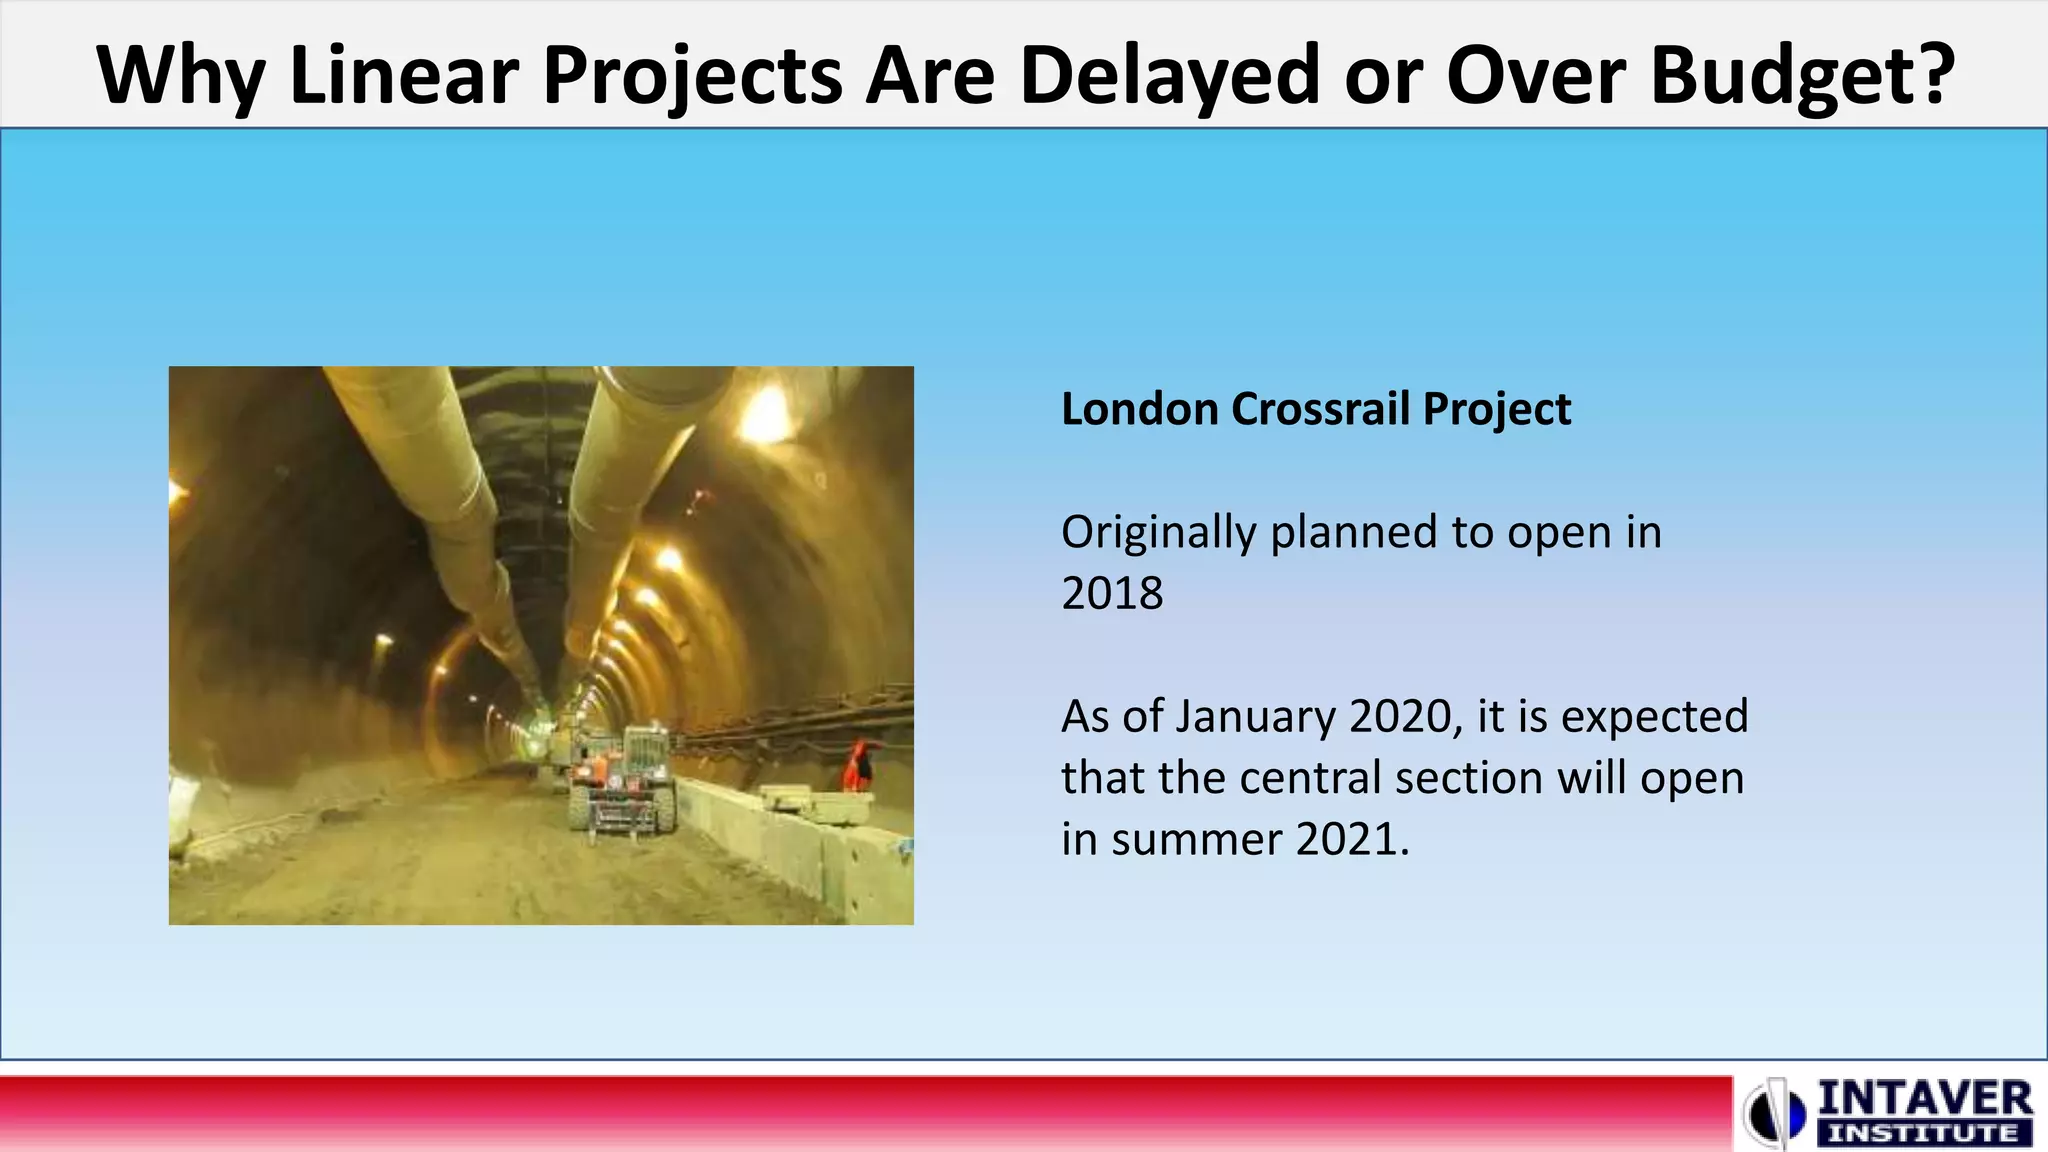
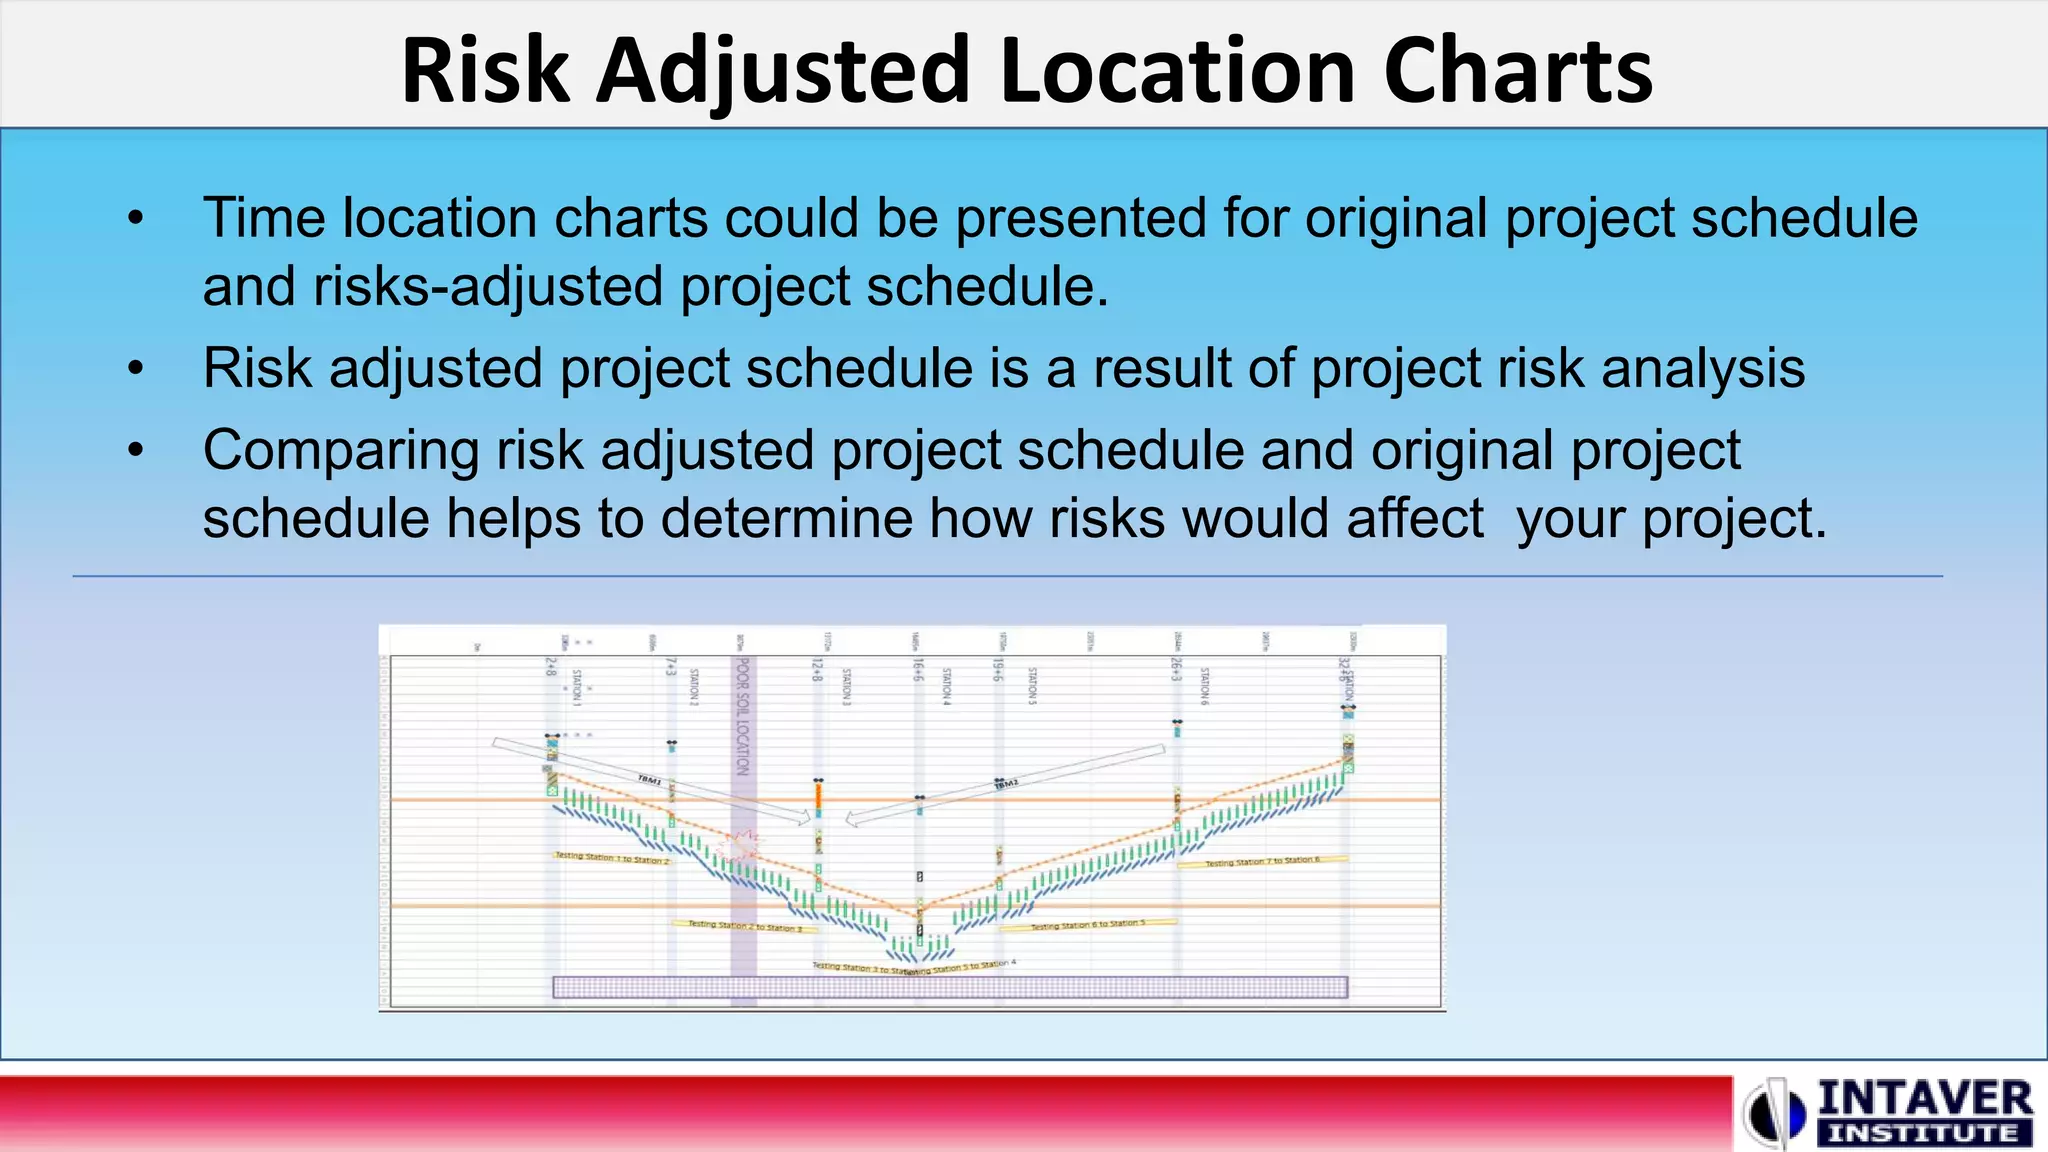
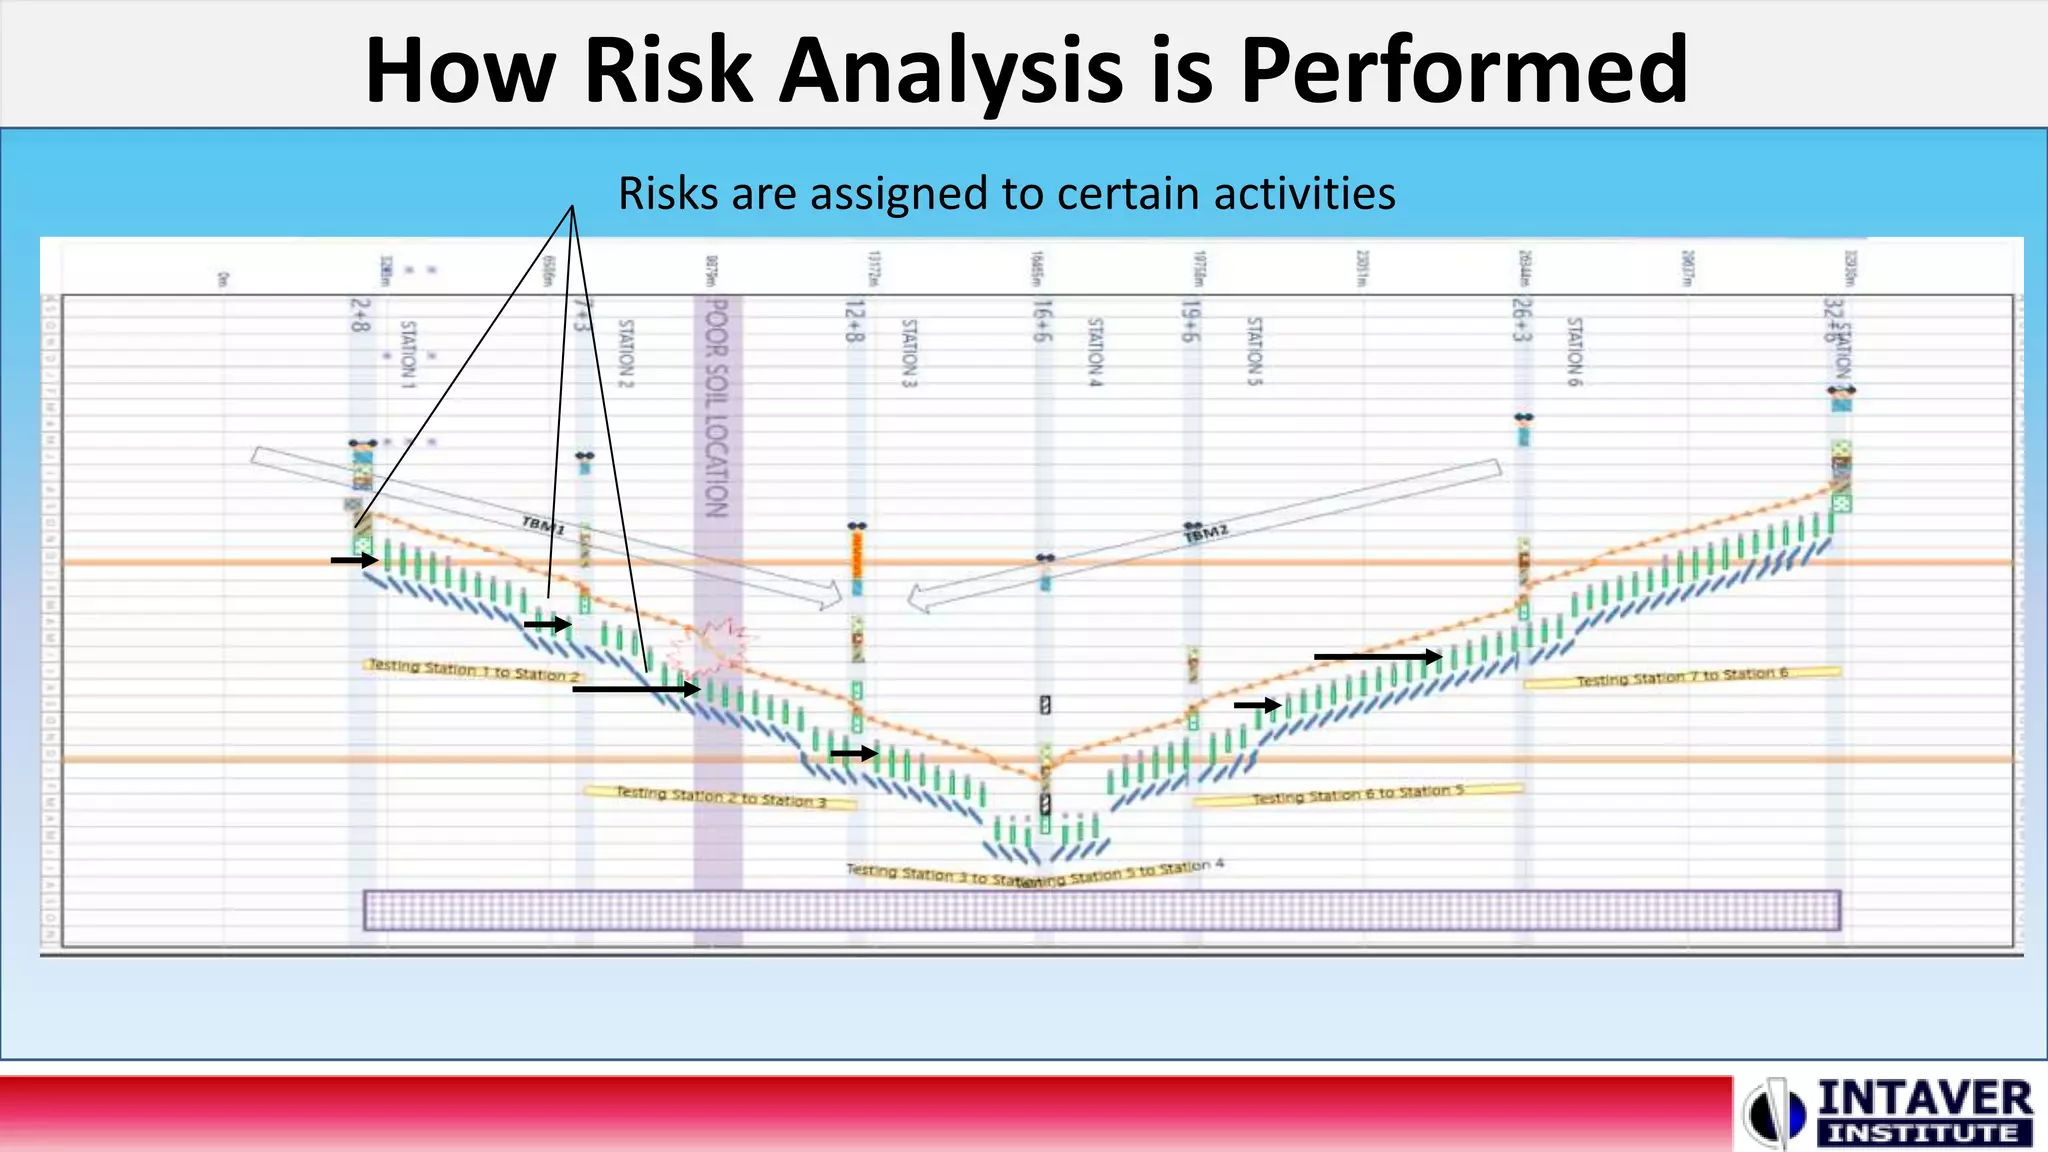

The document discusses risk analysis in linear projects, which are construction projects linked to specific locations, such as tunnels and pipelines. It highlights the importance of risk-adjusted location charts to analyze potential delays and budget overruns, using examples like the London Crossrail project. Risk analysis is facilitated by specialized software tools, including RiskyProject and Turbo-Chart.


