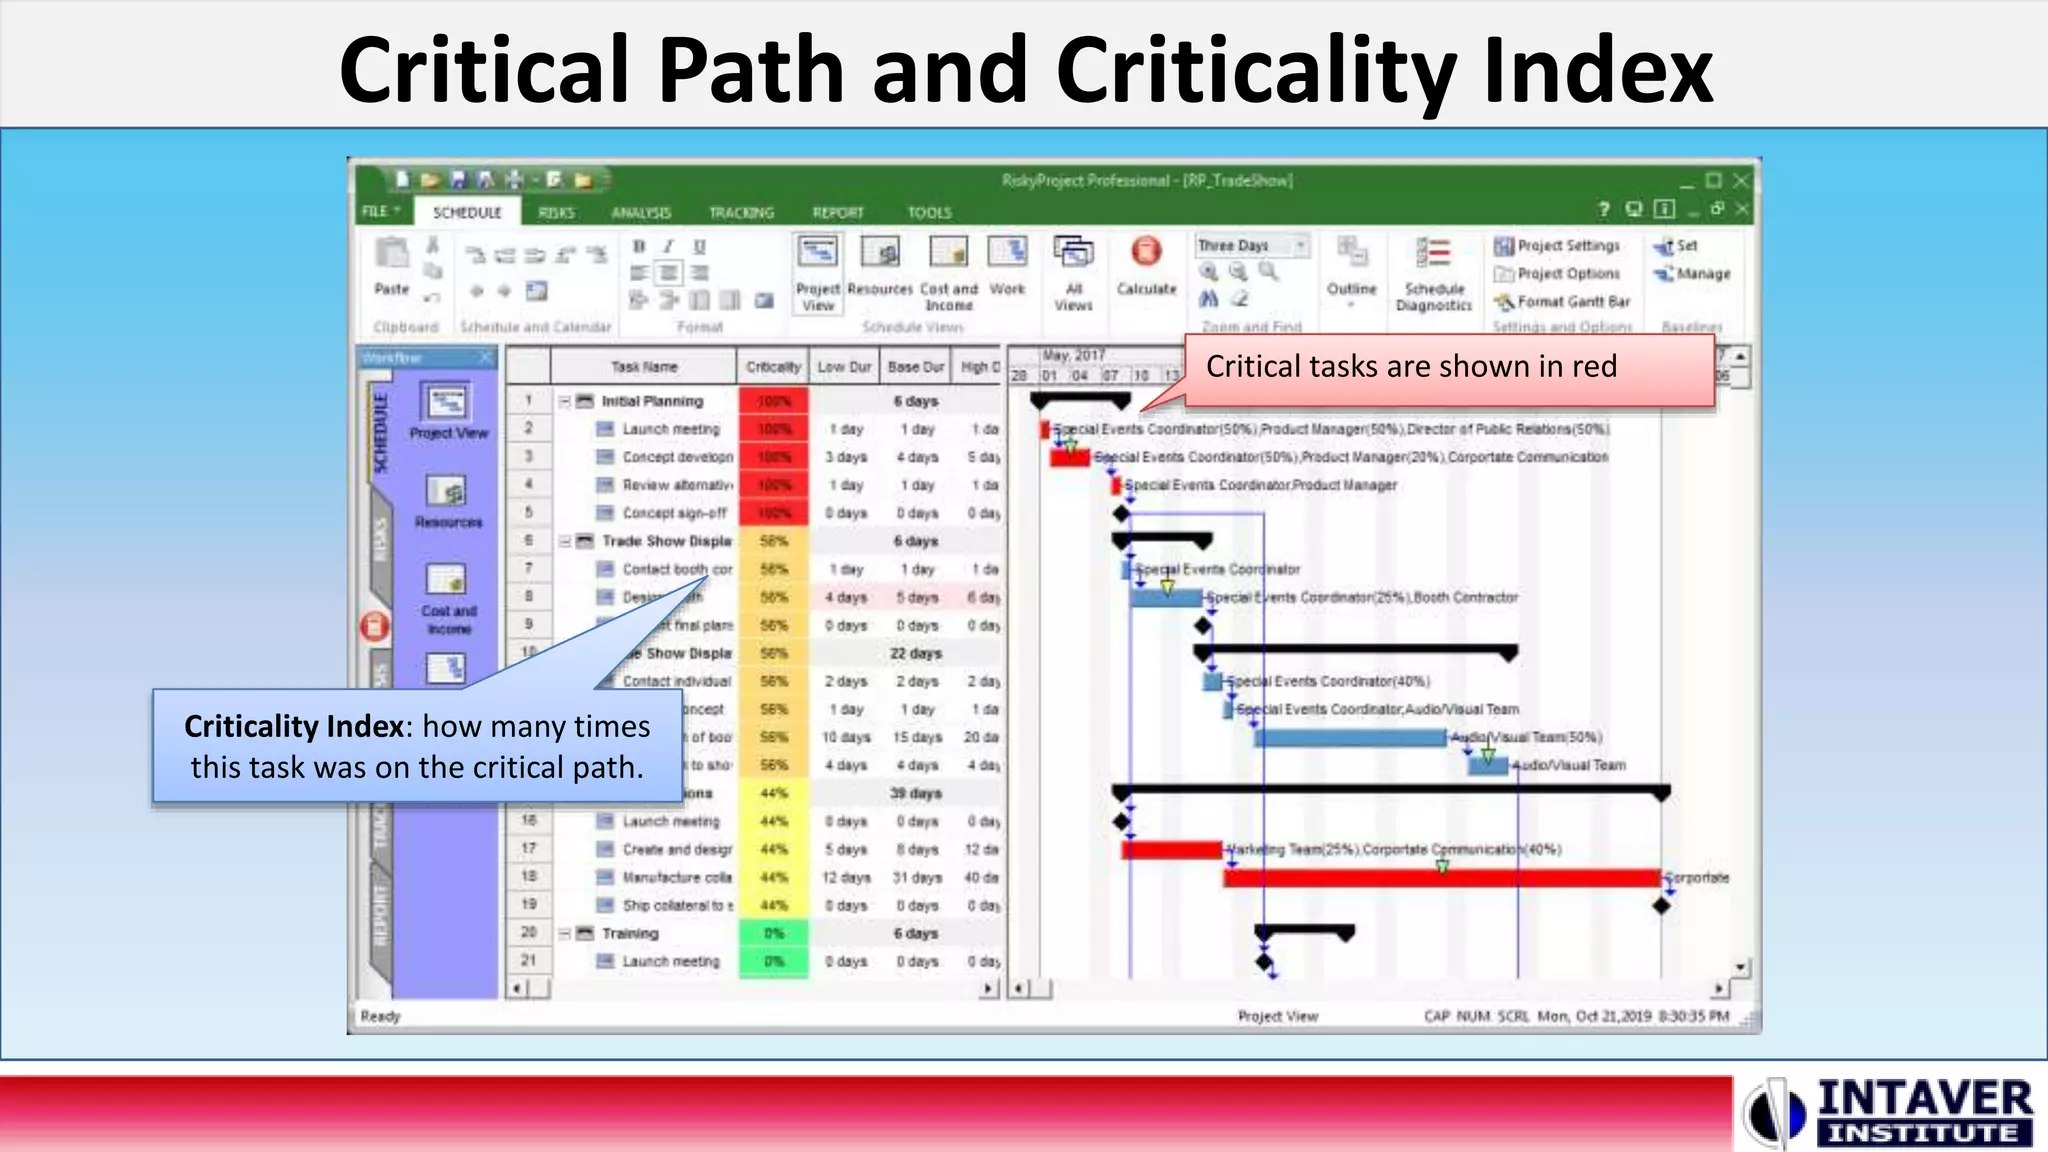
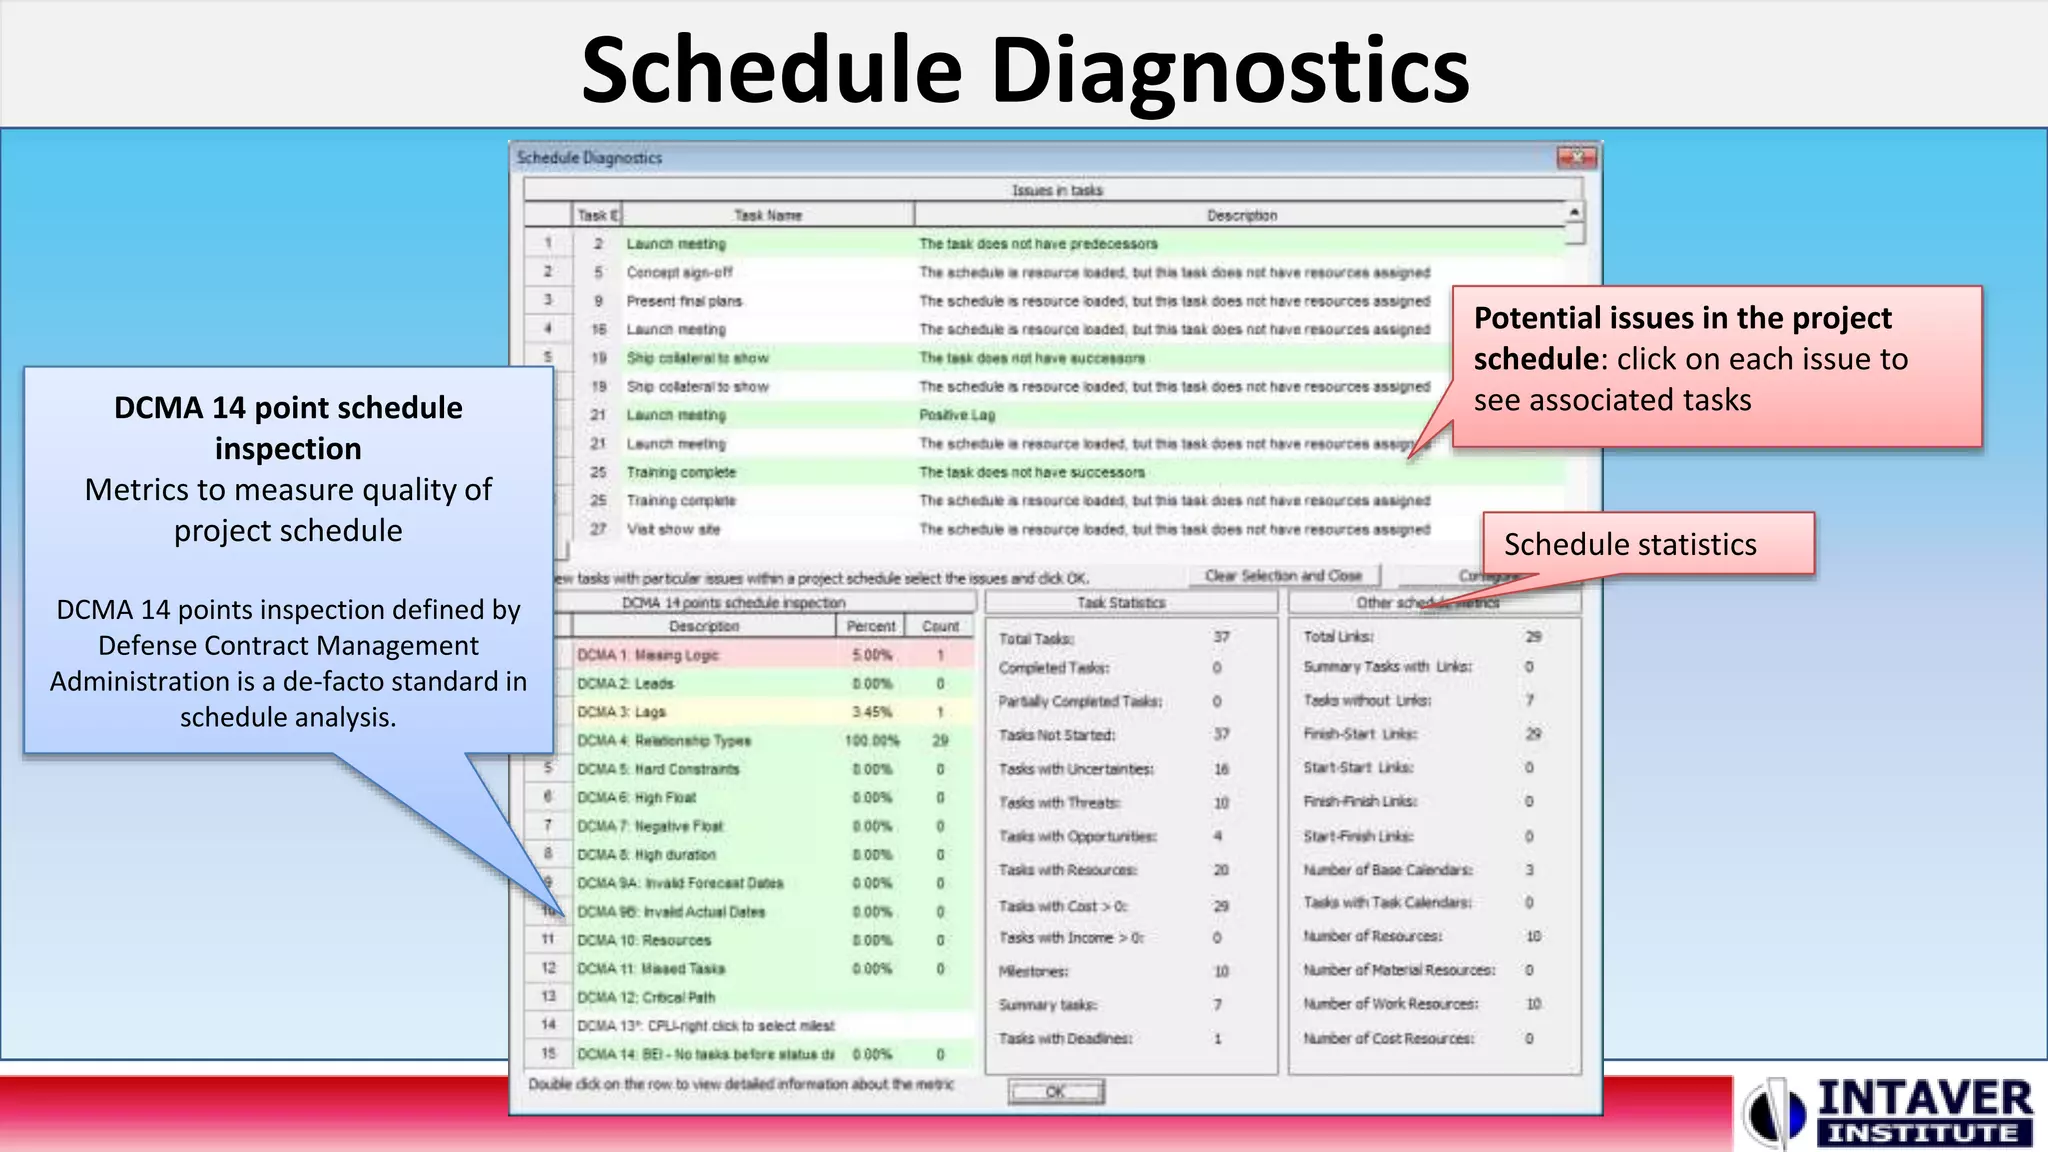
Intaver Institute Inc. released new version of its Project Risk Analysis and Risk Management Software RiskyProject v7.1. This presentation shows new features of the software
2. Critical Path and Criticality Index
Critical tasks are shown in red
Criticality Index: how many times
this task was on the critical path.
3. Schedule Diagnostics
DCMA 14 point schedule
inspection
Metrics to measure quality of
project schedule
DCMA 14 points inspection defined by
Defense Contract Management
Administration is a de-facto standard in
schedule analysis.
Potential issues in the project
schedule: click on each issue to
see associated tasks
Schedule statistics
4. Improved Filtering and Sorting of the Risk Register
Multiple Tabs: multiple views of
the Risk Register with different
sets of columns and filters
Excel-like sorting and filtering of
Risk Register
10. Scenario Analysis using Multiple Cumulative Probability Plots
Curves are
associated with
results of analysis
for different
baselinesEnabled cumulative
probability curve for
this baseline
11. Risk Assignment View
List of assignment
of all risks to
different tasks and
resources
Easy way to view risk
all assignments
12. Incident Management
New Incident Tab
in RiskyProject
Enterprise
List of Incidents with
their properties
View Incident
statistics
Define Incident classification
and customize properties
13. Other New Features
• Automatic Calculation
of the Cost of Risk
• Actual Work Input
• User Interface
Improvements
RiskyProject now can automatically calculate the
Expected Loss of each risk based on results of
Monte Carlo simulations
14. Questions?
Please contact us
Intaver Institute Inc.
400, 7015 Macleod Trail S.W, Calgary, AB, Canada
Tel: +1(403)692-2252
www.intaver.com
Intaver Institute Inc. US Office
4280 East Tamiami Trail, 302-M, Naples Florida, 34112, USA
Tel: +1(510) 984 3527
Editor's Notes
This video will cover the main new features in the latest release of RiskyProject. RiskyProject 7.1 is a significant update and includes many new features and improvements that have been developed since our last major release in June of 2017.
RiskyProject can now calculate critical path, determine critical tasks, and calculate critical path metrics, such as the Criticality index as part of both deterministic calculations and Monte Carlo simulations. Criticality index shows how many times a task was on the critical path during Monte Carlo simulations.
The new schedule diagnostics performs detailed analysis of project schedule integrity, including DCMA 14 point schedule assessment. The DCMA 14 point inspection defined by Defense Contract Management Administration is a widely accepted standard in schedule diagnostics.Diagnostic includes customizable set of 21 tests, which checks schedules for logical errors, ensures that it is aligned with scheduling best practices, and optimized for Monte Carlo simulations.
RiskyProject now includes Excel-style filtering and sorting of the Risk Register based on content of each column. In addition, can now create different views of the same risk register with a different set of columns filtered and sorted in different orders. These views are presented as different bottom tabs in the Risk Register.
Schedule Consolidation generates an equivalent project schedule with the same duration and cost by consolidating sequential tasks, removing redundant summary tasks, and other optimizations. Schedule consolidation is useful to increase performance of Monte Carlo simulations of very large schedules.
Uncertainty bands are predefined ranges of coefficients used to automatically calculate values for low and high durations and fixed costs for the selected tasks. Tasks that have similar relative ranges of uncertainty are assigned different shading for quick identification on Project views. Uncertainty bands include an interface that allows users to easily assign bands to selected tasks.
You can now export any data tables directly to Microsoft Excel and automatically launch Excel. This includes an option to format the Excel report.
You can now import from Oracle Primavera schedules saved in XER format. Previous versions of RiskyProject were limited to opening P6 schedules that were in Microsoft Project XML format also supported by Oracle Primavera.
The Risk report now includes risk reviews and formatting of risk report has also been improved.
Scenario analysis can now be performed using multiple baselines plotted as S-curves associated with results of Monte Carlo simulations of different baselines at both the project or task level. By viewing multiple cumulative probability plots, you can compare uncertainties in different project scenarios.
The Risk Assignment View is the list of all risk assignments to tasks and resources. The view allows you to re-assign risks to different tasks and resources, define correlations, and create a report of risk assignments. It includes both global and local risks.
The Incident management module is available with the Enterprise version. Incident management has a similar workflow to our risk management, but uses different views and has separate reports based on incident properties.
RiskyProject usability has undergone multiple improvements, including introduction of Microsoft Office 2016 and later UI conventions. In addition, the Risk Register usability has been improved by introducing advanced customization of column headers.