Download as PDF, PPTX


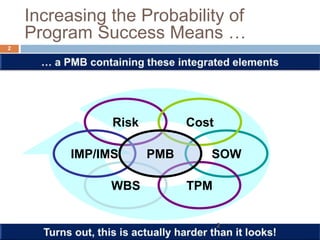
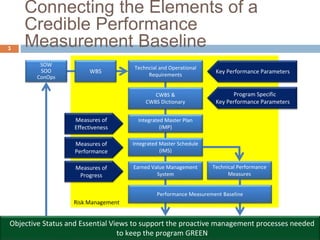
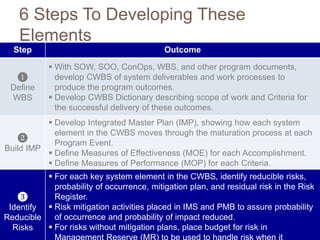
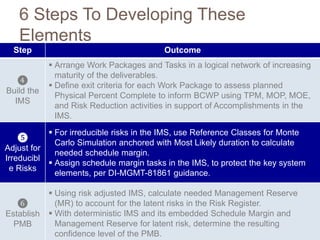
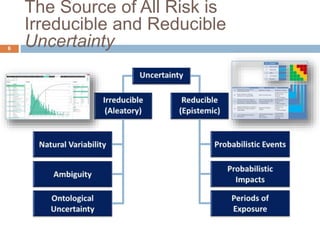

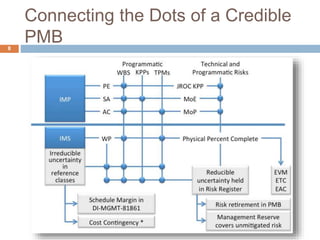
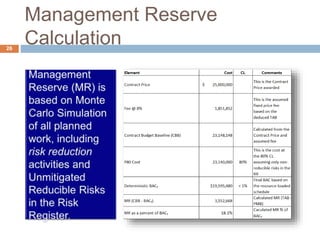
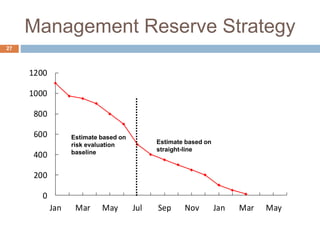
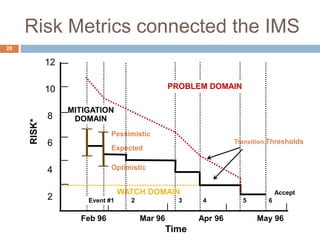
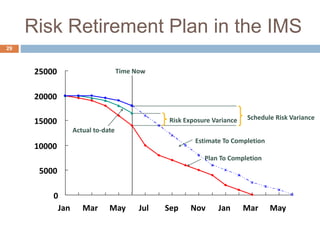
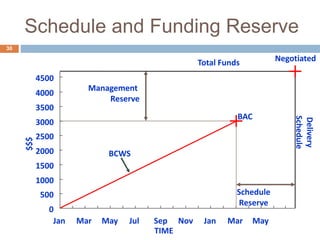

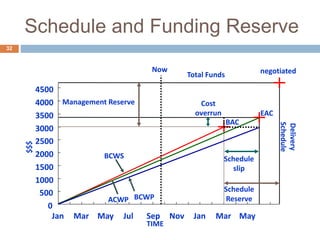
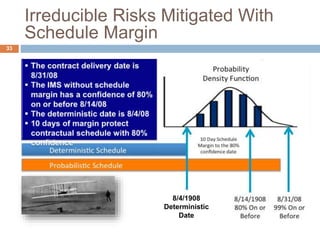
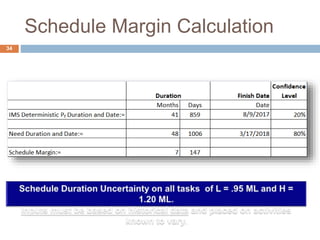
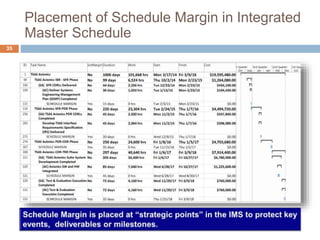
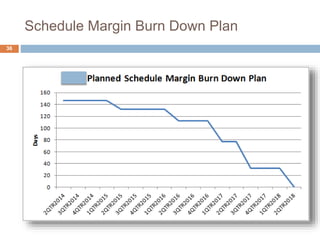
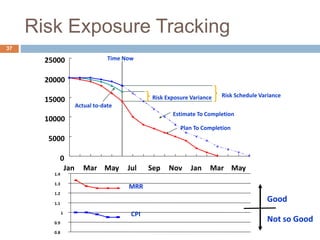


This document provides a 6-step process for building a risk-tolerant integrated master schedule (IMS) that increases the probability of program success. The steps include: 1) defining a work breakdown structure, 2) building an integrated master plan, 3) identifying reducible risks, 4) building the IMS, 5) adjusting for irreducible risks through schedule margin, and 6) establishing a performance measurement baseline including management reserve for latent risks. Key aspects include identifying reducible and irreducible risks, using techniques like Monte Carlo simulation to determine schedule margin for irreducible risks, and ensuring the IMS, performance measurement baseline, and risk registers are integrated.