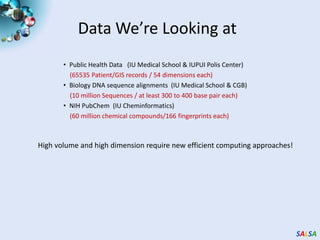
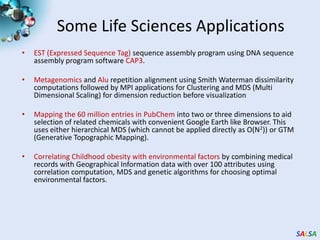
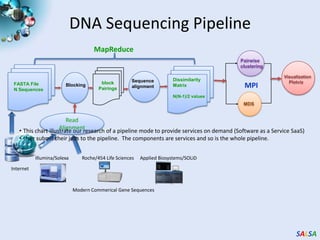
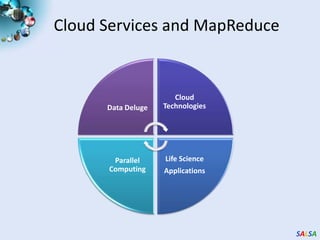
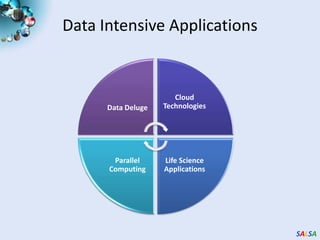
Cloud Technologies and Their ApplicationsThe Bioinformatics Open Source Conference (BOSC 2010) Boston, MassachusettsJudy Qiuhttp://salsahpc.indiana.edu  Assistant Director, Pervasive Technology InstituteAssistant Professor, School of Informatics and ComputingIndiana University
Data Explosion and ChallengesData DelugeCloud TechnologiesWhy ?How ?Life Science ApplicationsParallel ComputingWhat ?
Data We’re Looking atPublic Health Data   (IU Medical School & IUPUI Polis Center)(65535 Patient/GIS records / 54 dimensions each)Biology DNA sequence alignments  (IU Medical School & CGB)    (10 million Sequences / at least 300 to 400 base pair each)NIH PubChem  (IU Cheminformatics)    (60 million chemical compounds/166 fingerprints each)High volume and high dimension require new efficient computing approaches!
Some Life Sciences ApplicationsEST (Expressed Sequence Tag)sequence assembly program using DNA sequence assembly program software CAP3.Metagenomics and Alu repetition alignment using Smith Waterman dissimilarity computations followed by MPI applications for Clustering and MDS (Multi Dimensional Scaling) for dimension reduction before visualizationMapping the 60 million entries in PubCheminto two or three dimensions to aid selection of related chemicals with convenient Google Earth like Browser. This uses either hierarchical MDS (which cannot be applied directly as O(N2)) or GTM (Generative Topographic Mapping).Correlating Childhood obesity with environmental factorsby combining medical records with Geographical Information data with over 100 attributes using correlation computation, MDS and genetic algorithms for choosing optimal environmental factors.
DNA Sequencing PipelineMapReduceIllumina/Solexa           Roche/454 Life Sciences     Applied Biosystems/SOLiDPairwiseclusteringBlocking MDSMPIModern Commerical Gene SequencesVisualizationPlotvizSequencealignmentDissimilarityMatrixN(N-1)/2 valuesblockPairingsFASTA FileN SequencesRead AlignmentThis chart illustrate our research of a pipeline mode to provide services on demand (Software as a Service SaaS)
User submit their jobs to the pipeline.  The components are services and so is the whole pipeline.Internet
Cloud Services and MapReduceCloud TechnologiesData DelugeLife ScienceApplicationsParallel Computing
Clouds as Cost Effective Data Centers7Builds giant data centers with 100,000’s of computers; ~ 200-1000 to a shipping container with Internet access    “Microsoft will cram between 150 and 220 shipping containers filled with data center gear into a new 500,000 square foot Chicago facility. This move marks the most significant, public use of the shipping container systems popularized by the likes of Sun Microsystems and Rackable Systems to date.”―News Release from Web
Clouds hide Complexity8CyberinfrastructureIs “Research as a Service”SaaS: Software as a Service(e.g. Clustering is a service)PaaS: Platform as a ServiceIaaS plus core software capabilities on which you build  SaaS(e.g. Azure is a PaaS; MapReduce is a Platform)IaaS(HaaS): Infrasturcture as a Service (get computer time with a credit card and with a Web interface like EC2)
Commercial CloudSoftware
MapReduceMap(Key, Value)  Reduce(Key, List<Value>)  A parallel Runtime coming from Information RetrievalData PartitionsA hash function maps the results of the map tasks to r  reduce tasksReduce OutputsImplementations support:Splitting of dataPassing the output of map functions to reduce functionsSorting the inputs to the reduce function based on the intermediate keysQuality of services
Edge : communication pathVertex :execution task  Hadoop & DryadLINQApache HadoopMicrosoft DryadLINQStandard LINQ operationsData/Compute NodesMaster NodeDryadLINQ operationsJobTrackerMMMMRRRRHDFSNameNodeDatablocks12DryadLINQ Compiler2334Directed Acyclic Graph (DAG) based execution flowsDryad process the DAG executing vertices on compute clustersLINQ provides a query interface for structured dataProvide Hash, Range, and Round-Robin partition patterns Apache Implementation of Google’s MapReduceHadoop Distributed File System (HDFS) manage dataMap/Reduce tasks are scheduled based on data locality in HDFS (replicated data blocks)Dryad Execution EngineJob creation; Resource management; Fault tolerance& re-execution of failed taskes/vertices
Applications using Dryad & DryadLINQInput files (FASTA)CAP3 - Expressed Sequence Tag assembly  to re-construct full-length mRNACAP3CAP3CAP3DryadLINQOutput filesPerform using DryadLINQ and Apache Hadoop implementationsSingle “Select” operation in DryadLINQ“Map only” operation in Hadoop X. Huang, A. Madan, “CAP3: A DNA Sequence Assembly Program,” Genome Research, vol. 9, no. 9, pp. 868-877, 1999.
Classic Cloud ArchitectureAmazon EC2 and Microsoft AzureMapReduce ArchitectureApache Hadoop and Microsoft DryadLINQHDFSInput Data SetData FileMap()Map()ExecutableOptionalReducePhaseReduceResultsHDFS
Usability and Performance of Different Cloud ApproachesCap3 PerformanceCap3 EfficiencyEfficiency = absolute sequential run time / (number of cores * parallel run time)
Hadoop, DryadLINQ  - 32 nodes (256 cores IDataPlex)
EC2 - 16 High CPU extra large instances (128 cores)
Azure- 128 small instances (128 cores)
Ease of Use – Dryad/Hadoop are easier than EC2/Azure as higher level models
Lines of code including  file copyAzure : ~300  Hadoop: ~400  Dyrad: ~450  EC2 : ~700
Table 1 : Selected EC2 Instance Types
4096 Cap3 data files :  1.06 GB / 1875968 reads (458 readsX4096)..Following is the cost to process 4096 CAP3 files..Amortized cost in Tempest  (24 core X 32 nodes, 48 GB per node)    = 9.43$(Assume 70% utilization, write off over 3 years, include support)
Data Intensive ApplicationsCloud TechnologiesData DelugeLife Science ApplicationsParallel Computing
Alu and Metagenomics Workflow“All pairs” problem                Data is a collection of N sequences. Need to calcuate N2dissimilarities (distances) between sequnces (all pairs).These cannot be thought of as vectors because there are missing characters
“Multiple Sequence Alignment” (creating vectors of characters) doesn’t seem to work if N larger than O(100), where 100’s of characters long.Step 1: Can calculate N2 dissimilarities (distances) between sequencesStep 2: Find families by clustering (using much better methods than Kmeans). As no vectors, use vector free O(N2) methodsStep 3: Map to 3D for visualization using Multidimensional Scaling (MDS) – also O(N2)Results:        N = 50,000 runs in 10 hours (the complete pipeline above) on 768 coresDiscussions:Need to address millions of sequences …..Currently using a mix of MapReduce and MPITwister will do all steps as MDS, Clustering just need MPI Broadcast/Reduce
All-Pairs Using DryadLINQ125 million distances4 hours & 46 minutesCalculate  Pairwise Distances (Smith Waterman Gotoh)Calculate pairwise distances for a collection of genes (used for clustering, MDS)Fine grained tasks in MPICoarse grained tasks in DryadLINQPerformed on 768 cores (Tempest Cluster)Moretti, C., Bui, H., Hollingsworth, K., Rich, B., Flynn, P., & Thain, D. (2009). All-Pairs: An Abstraction for Data Intensive Computing on Campus Grids. IEEE Transactions on Parallel and Distributed Systems, 21, 21-36.
Biology MDS and Clustering ResultsAlu FamiliesThis visualizes results of Alu repeats from Chimpanzee and Human Genomes. Young families (green, yellow) are seen as tight clusters. This is projection of MDS dimension reduction to 3D of 35399 repeats – each with about  400 base pairsMetagenomicsThis visualizes results of dimension reduction to 3D of 30000 gene sequences from an environmental sample. The many different genes are classified by clustering algorithm and visualized by MDS dimension reduction
Hadoop/Dryad ComparisonInhomogeneous Data IInhomogeneity of data does not have a significant effect when the sequence lengths are randomly distributedDryad with Windows HPCS compared to Hadoop with Linux RHEL on Idataplex (32 nodes)
Hadoop/Dryad ComparisonInhomogeneous Data IIThis shows the natural load balancing of Hadoop MR dynamic task assignment using a global pipe line in contrast to the  DryadLinq static assignmentDryad with Windows HPCS compared to Hadoop with Linux RHEL on Idataplex (32 nodes)
Hadoop VM Performance DegradationPerf. Degradation = (Tvm – Tbaremetal)/Tbaremetal15.3% Degradation at largest data set size
Parallel Computing and SoftwareCloud TechnologiesData DelugeLife Science ApplicationsParallel Computing
Twister(MapReduce++)Pub/Sub Broker NetworkMap WorkerStreaming based communication
Intermediate results are directly transferred from the map tasks to the reduce tasks – eliminates local files
Cacheablemap/reduce tasks
Static data remains in memory
Combine phase to combine reductions

Qiu bosc2010

  • 1.
    Cloud Technologies andTheir ApplicationsThe Bioinformatics Open Source Conference (BOSC 2010) Boston, MassachusettsJudy Qiuhttp://salsahpc.indiana.edu Assistant Director, Pervasive Technology InstituteAssistant Professor, School of Informatics and ComputingIndiana University
  • 2.
    Data Explosion andChallengesData DelugeCloud TechnologiesWhy ?How ?Life Science ApplicationsParallel ComputingWhat ?
  • 3.
    Data We’re LookingatPublic Health Data (IU Medical School & IUPUI Polis Center)(65535 Patient/GIS records / 54 dimensions each)Biology DNA sequence alignments (IU Medical School & CGB) (10 million Sequences / at least 300 to 400 base pair each)NIH PubChem (IU Cheminformatics) (60 million chemical compounds/166 fingerprints each)High volume and high dimension require new efficient computing approaches!
  • 4.
    Some Life SciencesApplicationsEST (Expressed Sequence Tag)sequence assembly program using DNA sequence assembly program software CAP3.Metagenomics and Alu repetition alignment using Smith Waterman dissimilarity computations followed by MPI applications for Clustering and MDS (Multi Dimensional Scaling) for dimension reduction before visualizationMapping the 60 million entries in PubCheminto two or three dimensions to aid selection of related chemicals with convenient Google Earth like Browser. This uses either hierarchical MDS (which cannot be applied directly as O(N2)) or GTM (Generative Topographic Mapping).Correlating Childhood obesity with environmental factorsby combining medical records with Geographical Information data with over 100 attributes using correlation computation, MDS and genetic algorithms for choosing optimal environmental factors.
  • 5.
    DNA Sequencing PipelineMapReduceIllumina/Solexa Roche/454 Life Sciences Applied Biosystems/SOLiDPairwiseclusteringBlocking MDSMPIModern Commerical Gene SequencesVisualizationPlotvizSequencealignmentDissimilarityMatrixN(N-1)/2 valuesblockPairingsFASTA FileN SequencesRead AlignmentThis chart illustrate our research of a pipeline mode to provide services on demand (Software as a Service SaaS)
  • 6.
    User submit theirjobs to the pipeline. The components are services and so is the whole pipeline.Internet
  • 7.
    Cloud Services andMapReduceCloud TechnologiesData DelugeLife ScienceApplicationsParallel Computing
  • 8.
    Clouds as CostEffective Data Centers7Builds giant data centers with 100,000’s of computers; ~ 200-1000 to a shipping container with Internet access “Microsoft will cram between 150 and 220 shipping containers filled with data center gear into a new 500,000 square foot Chicago facility. This move marks the most significant, public use of the shipping container systems popularized by the likes of Sun Microsystems and Rackable Systems to date.”―News Release from Web
  • 9.
    Clouds hide Complexity8CyberinfrastructureIs“Research as a Service”SaaS: Software as a Service(e.g. Clustering is a service)PaaS: Platform as a ServiceIaaS plus core software capabilities on which you build SaaS(e.g. Azure is a PaaS; MapReduce is a Platform)IaaS(HaaS): Infrasturcture as a Service (get computer time with a credit card and with a Web interface like EC2)
  • 10.
  • 11.
    MapReduceMap(Key, Value) Reduce(Key, List<Value>) A parallel Runtime coming from Information RetrievalData PartitionsA hash function maps the results of the map tasks to r reduce tasksReduce OutputsImplementations support:Splitting of dataPassing the output of map functions to reduce functionsSorting the inputs to the reduce function based on the intermediate keysQuality of services
  • 12.
    Edge : communicationpathVertex :execution task Hadoop & DryadLINQApache HadoopMicrosoft DryadLINQStandard LINQ operationsData/Compute NodesMaster NodeDryadLINQ operationsJobTrackerMMMMRRRRHDFSNameNodeDatablocks12DryadLINQ Compiler2334Directed Acyclic Graph (DAG) based execution flowsDryad process the DAG executing vertices on compute clustersLINQ provides a query interface for structured dataProvide Hash, Range, and Round-Robin partition patterns Apache Implementation of Google’s MapReduceHadoop Distributed File System (HDFS) manage dataMap/Reduce tasks are scheduled based on data locality in HDFS (replicated data blocks)Dryad Execution EngineJob creation; Resource management; Fault tolerance& re-execution of failed taskes/vertices
  • 13.
    Applications using Dryad& DryadLINQInput files (FASTA)CAP3 - Expressed Sequence Tag assembly to re-construct full-length mRNACAP3CAP3CAP3DryadLINQOutput filesPerform using DryadLINQ and Apache Hadoop implementationsSingle “Select” operation in DryadLINQ“Map only” operation in Hadoop X. Huang, A. Madan, “CAP3: A DNA Sequence Assembly Program,” Genome Research, vol. 9, no. 9, pp. 868-877, 1999.
  • 14.
    Classic Cloud ArchitectureAmazonEC2 and Microsoft AzureMapReduce ArchitectureApache Hadoop and Microsoft DryadLINQHDFSInput Data SetData FileMap()Map()ExecutableOptionalReducePhaseReduceResultsHDFS
  • 15.
    Usability and Performanceof Different Cloud ApproachesCap3 PerformanceCap3 EfficiencyEfficiency = absolute sequential run time / (number of cores * parallel run time)
  • 16.
    Hadoop, DryadLINQ - 32 nodes (256 cores IDataPlex)
  • 17.
    EC2 - 16High CPU extra large instances (128 cores)
  • 18.
    Azure- 128 smallinstances (128 cores)
  • 19.
    Ease of Use– Dryad/Hadoop are easier than EC2/Azure as higher level models
  • 20.
    Lines of codeincluding file copyAzure : ~300 Hadoop: ~400 Dyrad: ~450 EC2 : ~700
  • 21.
    Table 1 :Selected EC2 Instance Types
  • 22.
    4096 Cap3 datafiles : 1.06 GB / 1875968 reads (458 readsX4096)..Following is the cost to process 4096 CAP3 files..Amortized cost in Tempest (24 core X 32 nodes, 48 GB per node) = 9.43$(Assume 70% utilization, write off over 3 years, include support)
  • 23.
    Data Intensive ApplicationsCloudTechnologiesData DelugeLife Science ApplicationsParallel Computing
  • 24.
    Alu and MetagenomicsWorkflow“All pairs” problem Data is a collection of N sequences. Need to calcuate N2dissimilarities (distances) between sequnces (all pairs).These cannot be thought of as vectors because there are missing characters
  • 25.
    “Multiple Sequence Alignment”(creating vectors of characters) doesn’t seem to work if N larger than O(100), where 100’s of characters long.Step 1: Can calculate N2 dissimilarities (distances) between sequencesStep 2: Find families by clustering (using much better methods than Kmeans). As no vectors, use vector free O(N2) methodsStep 3: Map to 3D for visualization using Multidimensional Scaling (MDS) – also O(N2)Results: N = 50,000 runs in 10 hours (the complete pipeline above) on 768 coresDiscussions:Need to address millions of sequences …..Currently using a mix of MapReduce and MPITwister will do all steps as MDS, Clustering just need MPI Broadcast/Reduce
  • 26.
    All-Pairs Using DryadLINQ125million distances4 hours & 46 minutesCalculate Pairwise Distances (Smith Waterman Gotoh)Calculate pairwise distances for a collection of genes (used for clustering, MDS)Fine grained tasks in MPICoarse grained tasks in DryadLINQPerformed on 768 cores (Tempest Cluster)Moretti, C., Bui, H., Hollingsworth, K., Rich, B., Flynn, P., & Thain, D. (2009). All-Pairs: An Abstraction for Data Intensive Computing on Campus Grids. IEEE Transactions on Parallel and Distributed Systems, 21, 21-36.
  • 27.
    Biology MDS andClustering ResultsAlu FamiliesThis visualizes results of Alu repeats from Chimpanzee and Human Genomes. Young families (green, yellow) are seen as tight clusters. This is projection of MDS dimension reduction to 3D of 35399 repeats – each with about 400 base pairsMetagenomicsThis visualizes results of dimension reduction to 3D of 30000 gene sequences from an environmental sample. The many different genes are classified by clustering algorithm and visualized by MDS dimension reduction
  • 28.
    Hadoop/Dryad ComparisonInhomogeneous DataIInhomogeneity of data does not have a significant effect when the sequence lengths are randomly distributedDryad with Windows HPCS compared to Hadoop with Linux RHEL on Idataplex (32 nodes)
  • 29.
    Hadoop/Dryad ComparisonInhomogeneous DataIIThis shows the natural load balancing of Hadoop MR dynamic task assignment using a global pipe line in contrast to the DryadLinq static assignmentDryad with Windows HPCS compared to Hadoop with Linux RHEL on Idataplex (32 nodes)
  • 30.
    Hadoop VM PerformanceDegradationPerf. Degradation = (Tvm – Tbaremetal)/Tbaremetal15.3% Degradation at largest data set size
  • 31.
    Parallel Computing andSoftwareCloud TechnologiesData DelugeLife Science ApplicationsParallel Computing
  • 32.
    Twister(MapReduce++)Pub/Sub Broker NetworkMapWorkerStreaming based communication
  • 33.
    Intermediate results aredirectly transferred from the map tasks to the reduce tasks – eliminates local files
  • 34.
  • 35.
  • 36.
    Combine phase tocombine reductions

Editor's Notes

  • #15 Emerging technologies we cannot draw too much conclusion yet but all look promising at the momentEase of development. Dryad and Hadoop &gt;&gt; EC2 and AzureWhy Azure is worse than EC2 although less code lines?Simplest model
  • #16 #core x 1Ghz
  • #22 10k data size
  • #23 10k data size
  • #24 Overhead is independent of computation time. With the size of data go up, overall overhead is reduced.
  • #29 MDS implemented in C#; GTM in R and C/C++
  • #33 Support development of new applications and new middleware using Cloud, Grid and Parallel computing (Nimbus, Eucalyptus, Hadoop, Globus, Unicore, MPI, OpenMP. Linux, Windows …) looking at functionality, interoperability, performance Put the “science” back in the computer science of grid computing by enabling replicable experimentsOpen source software built around Moab/xCAT to support dynamic provisioning from Cloud to HPC environment, Linux to Windows ….. with monitoring, benchmarks and support of important existing middlewareJune 2010 Initial users; September 2010 All hardware (except IU shared memory system) accepted and major use starts; October 2011 FutureGrid allocatable via TeraGrid process