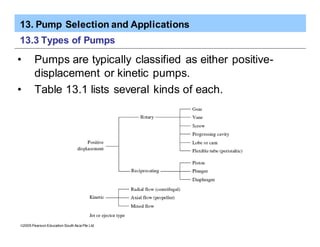
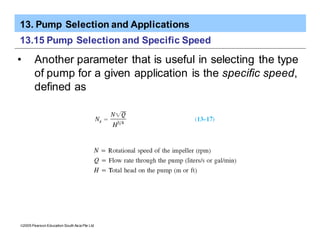
This document discusses pump selection and applications. It begins by outlining the chapter, which covers introductory concepts in pump selection, parameters to consider, types of pumps including positive displacement and kinetic pumps, and performance data for centrifugal pumps. The affinity laws relating speed, impeller diameter, capacity, head, and power for centrifugal pumps are also described. The chapter provides examples of pump performance curves and works through an example problem applying the affinity laws.
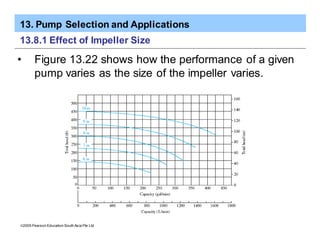
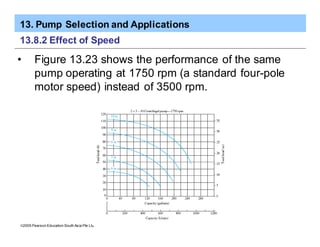
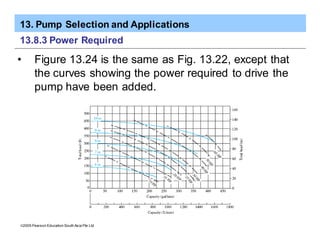
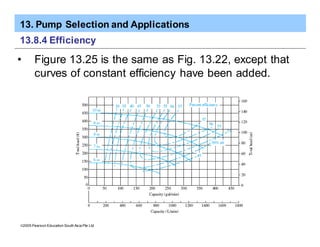
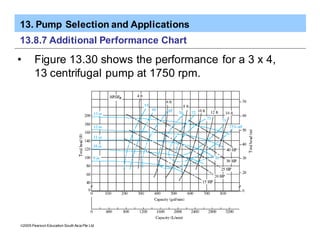
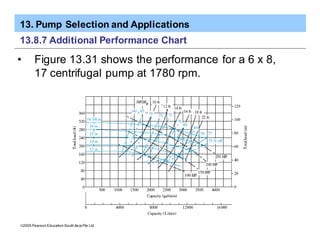
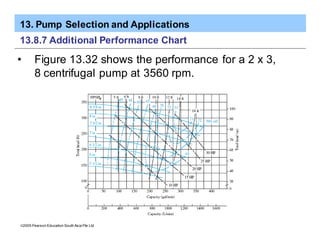
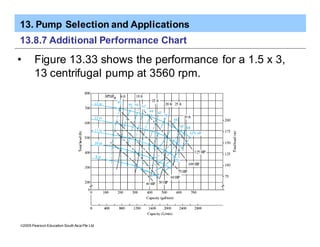
This Presentation is about working principle of Pumps.Basic Presentation regarding pumps , will definitely help beginners to learn pump types , their working , their parts etc.
Basics Fundamentals and working Principle of Centrifugal Pump.SHASHI BHUSHAN
Basics Fundamentals and working Principle of Centrifugal Pump. Centrifugal pumps are the rotodynamic machines that convert mechanical energy of shaft into kinetic and pressure energy of Fluid which may be used to raise the level of fluid. A centrifugal pump is named so, because the energy added by the impeller to the fluid is largely due to centrifugal effects.
in industries like iron and glass the fluid for hydraulic machines are delivered by multistage pumps. this is the basic introduction for clearing the concept of multi stage pumps.
Basics of centrifugal. Topics covered are operating principles, energy conversion, components in centrifugal pump, the concept of NPSH, pump rating calculation and affinity laws
the presentation includes basic ideas about water pumps, various terminology generally used for the pumps, classification of pumps and ideas about the types its construction and working
A REVIEW ON IMPROVEMENT OF EFFICIENCY OF CENTRIFUGAL PUMP THROUGH MODIFICATIO...ijiert bestjournal
The paper reviews the literature available on the i mprovement of efficiency of centrifugal pump through modification in suction manifolds. The paper discusses the available material of performance improvement through various paramete rs and mainly focuses on the research related to manifold modifications.
A community development project is kicking off at Rungbua sub district in Ratchaburi , a small community almost the same size of Singapore, the model is similar to this presentation.
Sachpazis:Terzaghi Bearing Capacity Estimation in simple terms with Calculati...Dr.Costas Sachpazis
Terzaghi's soil bearing capacity theory, developed by Karl Terzaghi, is a fundamental principle in geotechnical engineering used to determine the bearing capacity of shallow foundations. This theory provides a method to calculate the ultimate bearing capacity of soil, which is the maximum load per unit area that the soil can support without undergoing shear failure. The Calculation HTML Code included.
Saudi Arabia stands as a titan in the global energy landscape, renowned for its abundant oil and gas resources. It's the largest exporter of petroleum and holds some of the world's most significant reserves. Let's delve into the top 10 oil and gas projects shaping Saudi Arabia's energy future in 2024.
Welcome to WIPAC Monthly the magazine brought to you by the LinkedIn Group Water Industry Process Automation & Control.
In this month's edition, along with this month's industry news to celebrate the 13 years since the group was created we have articles including
A case study of the used of Advanced Process Control at the Wastewater Treatment works at Lleida in Spain
A look back on an article on smart wastewater networks in order to see how the industry has measured up in the interim around the adoption of Digital Transformation in the Water Industry.
Hybrid optimization of pumped hydro system and solar- Engr. Abdul-Azeez.pdffxintegritypublishin
Advancements in technology unveil a myriad of electrical and electronic breakthroughs geared towards efficiently harnessing limited resources to meet human energy demands. The optimization of hybrid solar PV panels and pumped hydro energy supply systems plays a pivotal role in utilizing natural resources effectively. This initiative not only benefits humanity but also fosters environmental sustainability. The study investigated the design optimization of these hybrid systems, focusing on understanding solar radiation patterns, identifying geographical influences on solar radiation, formulating a mathematical model for system optimization, and determining the optimal configuration of PV panels and pumped hydro storage. Through a comparative analysis approach and eight weeks of data collection, the study addressed key research questions related to solar radiation patterns and optimal system design. The findings highlighted regions with heightened solar radiation levels, showcasing substantial potential for power generation and emphasizing the system's efficiency. Optimizing system design significantly boosted power generation, promoted renewable energy utilization, and enhanced energy storage capacity. The study underscored the benefits of optimizing hybrid solar PV panels and pumped hydro energy supply systems for sustainable energy usage. Optimizing the design of solar PV panels and pumped hydro energy supply systems as examined across diverse climatic conditions in a developing country, not only enhances power generation but also improves the integration of renewable energy sources and boosts energy storage capacities, particularly beneficial for less economically prosperous regions. Additionally, the study provides valuable insights for advancing energy research in economically viable areas. Recommendations included conducting site-specific assessments, utilizing advanced modeling tools, implementing regular maintenance protocols, and enhancing communication among system components.
Hierarchical Digital Twin of a Naval Power SystemKerry Sado
A hierarchical digital twin of a Naval DC power system has been developed and experimentally verified. Similar to other state-of-the-art digital twins, this technology creates a digital replica of the physical system executed in real-time or faster, which can modify hardware controls. However, its advantage stems from distributing computational efforts by utilizing a hierarchical structure composed of lower-level digital twin blocks and a higher-level system digital twin. Each digital twin block is associated with a physical subsystem of the hardware and communicates with a singular system digital twin, which creates a system-level response. By extracting information from each level of the hierarchy, power system controls of the hardware were reconfigured autonomously. This hierarchical digital twin development offers several advantages over other digital twins, particularly in the field of naval power systems. The hierarchical structure allows for greater computational efficiency and scalability while the ability to autonomously reconfigure hardware controls offers increased flexibility and responsiveness. The hierarchical decomposition and models utilized were well aligned with the physical twin, as indicated by the maximum deviations between the developed digital twin hierarchy and the hardware.
1. ã2005 Pearson Education South Asia Pte Ltd
Applied Fluid Mechanics
1. The Nature of Fluid and the
Study of Fluid Mechanics
2. Viscosity of Fluid
3. Pressure Measurement
4. Forces Due to Static Fluid
5. Buoyancy and Stability
6. Flow of Fluid and Bernoulli’s Equation
7. General Energy Equation
8. Reynolds Number, Laminar Flow, Turbulent
Flow and Energy Losses Due to Friction
2. ã2005 Pearson Education South Asia Pte Ltd
Applied Fluid Mechanics
9. Velocity Profiles for Circular
Sections and Flow in
Noncircular Sections
10.Minor Losses
11.Series Pipeline Systems
12.Parallel Pipeline Systems
13.Pump Selection and Application
14.Open-Channel Flow
15.Flow Measurement
16.Forces Due to Fluids in Motion
3. ã2005 Pearson Education South Asia Pte Ltd
Applied Fluid Mechanics
17.Drag and Lift
18.Fans, Blowers, Compressors
and the Flow of Gases
19.Flow of Air in Ducts
4. 13. Pump Selection and Applications
ã2005 Pearson Education South Asia Pte Ltd
Chapter Objectives
• List the parameters involved in pump selection.
• List the types of information that must be specified
for a given pump.
• Describe the basic pump classifications.
• List four types of rotary positive-displacement
pumps.
• List three types of reciprocating positive-
displacement pumps.
• List three types of kinetic pumps.
• Describe the main features of centrifugal pumps.
• Describe deep-well jet pumps and shallow-well jet
pumps.
5. 13. Pump Selection and Applications
ã2005 Pearson Education South Asia Pte Ltd
Chapter Objectives
• Describe the typical performance curve for rotary
positive-displacement pumps.
• Describe the typical performance curve for centrifugal
pumps.
• State the affinity laws for centrifugal pumps as they
relate to the relationships among speed, impeller
diameter, capacity, total head capability, and power
required to drive the pump.
• Describe how the operating point of a pump is related to
the system resistancecurve.
• Define the net positive suction head (NPSH) for a pump
and discuss its significancein pump performance.
6. 13. Pump Selection and Applications
ã2005 Pearson Education South Asia Pte Ltd
Chapter Objectives
• Describe the importance of the vapor pressure of the
fluid in relation to the NPSH.
• Compute the NPSH available for a given suction line
design and a given fluid.
• Define the specific speed for a centrifugal pump and
discuss its relationship to pump selection.
• Describe the effect of increased viscosity on the
performance of centrifugal pumps.
• Describe the performance of parallel pumps and
pumps connected in series.
• Describe the features of a desirable suction line
design.
7. 13. Pump Selection and Applications
ã2005 Pearson Education South Asia Pte Ltd
Chapter Objectives
• Describe the features of a desirable discharge line
design.
• Describe the concept of life cycle cost applied to
pump selection and operation of the fluid flow
system.
8. 13. Pump Selection and Applications
ã2005 Pearson Education South Asia Pte Ltd
Chapter Outline
1. Introductory Concepts
2. Parameters Involved In Pump Selection
3. Types of Pumps
4. Positive-Displacement Pumps
5. Kinetic Pumps
6. Performance Data For Centrifugal Pumps
7. Affinity Laws For Centrifugal Pumps
8. Manufacturers' Data For Centrifugal Pumps
9. The Operating Point of a Pump and Pump
Selection
9. 13. Pump Selection and Applications
ã2005 Pearson Education South Asia Pte Ltd
Chapter Outline
10. Net Positive Suction Head
11. Suction Line Details
12. Discharge Line Details
13. Piping System Design and Pump Selection
Procedure
14. Alternate System Operating Modes
15. Pump Selection and Specific Speed
16. Life Cycle Costs for Pumped Fluid Systems
17. Software for Piping System Design and Pump
Selection
10. 13. Pump Selection and Applications
ã2005 Pearson Education South Asia Pte Ltd
13.1 Introductory Concepts
• In Chapter 7, when the general energy equation was
introduced you learned how to determine the energy
added by a pump to the fluid as follow,
• We will call ha the total head on the pump.
• Some pump manufacturers refer to this as the total
dynamic head (TDH).
11. 13. Pump Selection and Applications
ã2005 Pearson Education South Asia Pte Ltd
13.1 Introductory Concepts
• You also learned how to compute the power delivered
to the fluid by the pump,
• You also learned in Chapter 7 to use the efficiency of
the pump to determine the power input to the pump:
12. 13. Pump Selection and Applications
ã2005 Pearson Education South Asia Pte Ltd
13.2 Parameters Involved In Pump selection
• When selecting a pump for a particular application,
the following factors must be considered:
1. The nature of the liquid to be pumped
2. The required capacity (volume flow rate)
3. The conditions on the suction (inlet) side of the
pump
4. The conditions on the discharge (outlet) side of the
pump
5. The total head on the pump (the term from the
energy equation)
13. 13. Pump Selection and Applications
ã2005 Pearson Education South Asia Pte Ltd
13.2 Parameters Involved In Pump selection
6. The type of system to which the pump is delivering
the fluid
7. The type of power source (electric motor, diesel
engine, steam turbine, etc.)
8. Space, weight, and position limitations
9. Environmental conditions
10.Cost of pump purchase and installation
11.Cost of pump operation
12.Governing codes and standards
14. 13. Pump Selection and Applications
ã2005 Pearson Education South Asia Pte Ltd
13.2 Parameters Involved In Pump selection
• After pump selection, the following items must be
specified:
1. Type of pump and manufacturer
2. Size of pump
3. Size of suction connection and type (flanged,
screwed, etc.)
4. Size and type of discharge connection
5. Speed of operation
15. 13. Pump Selection and Applications
ã2005 Pearson Education South Asia Pte Ltd
13.2 Parameters Involved In Pump selection
6. Specifications for driver (for example: for an electric
motor—power required,speed, voltage, phase,
frequency, frame size, enclosure type)
7. Coupling type, manufacturer, and model number
8. Mounting details
9. Special materials and accessories required, if any
10.Shaft seal design and seal materials
16. 13. Pump Selection and Applications
ã2005 Pearson Education South Asia Pte Ltd
13.3 Types of Pumps
• Pumps are typically classified as either positive-
displacement or kinetic pumps.
• Table 13.1 lists several kinds of each.
17. 13. Pump Selection and Applications
ã2005 Pearson Education South Asia Pte Ltd
13.4 Positive-Displacement Pumps
• Positive-displacement pumps ideally deliver a fixed
quantity of fluid with each revolution of the pump
rotor or drive shaft.
• Most positive-displacement pumps can handle
liquids over a wide range of viscosities.
• Some of the examples are gear, piston, vane, screw,
progressive cavity, lobe, piston, diaphragm and
peristaltic pumps.
18. 13. Pump Selection and Applications
ã2005 Pearson Education South Asia Pte Ltd
13.4 Positive-Displacement Pumps
• Fig 13.1 shows a vane pump.
19. 13. Pump Selection and Applications
ã2005 Pearson Education South Asia Pte Ltd
13.4 Positive-Displacement Pumps
• Fig 13.2 shows a screw pump.
20. 13. Pump Selection and Applications
ã2005 Pearson Education South Asia Pte Ltd
13.4 Positive-Displacement Pumps
• Fig 13.3 shows a progressing cavity pump.
21. 13. Pump Selection and Applications
ã2005 Pearson Education South Asia Pte Ltd
13.4 Positive-Displacement Pumps
• Fig 13.4 shows a progressing lobe pump.
22. 13. Pump Selection and Applications
ã2005 Pearson Education South Asia Pte Ltd
13.4 Positive-Displacement Pumps
• Fig 13.5 shows a piston pumps for fluid transfer.
23. 13. Pump Selection and Applications
ã2005 Pearson Education South Asia Pte Ltd
13.4 Positive-Displacement Pumps
• Fig 13.6 shows a peristaltic pump.
24. 13. Pump Selection and Applications
ã2005 Pearson Education South Asia Pte Ltd
13.4.1 Performance Data for Positive-Displacement Pumps
• The operating characteristics of positive-
displacement pumps make them useful for handling
such fluids as water, hydraulic oils in fluid power
systems.
• Some disadvantages of some designs include
pulsating output, susceptibility to damage by solids
and abrasives, and need for a relief valve.
25. 13. Pump Selection and Applications
ã2005 Pearson Education South Asia Pte Ltd
13.4.2 Reciprocating Pump Performance
• In its simplest form, the reciprocating pump (Fig.
13.5) employs a piston that draws fluid into a
cylinder through an intake valve as the piston draws
away from the valve.
• Then, as the piston moves forward, the intake valve
closes and the fluid is pushed out through the
discharge valve.
• Such a pump is called simplex, and its curve of
discharge versus time looks like that shown in Fig.
13.8(a).
26. 13. Pump Selection and Applications
ã2005 Pearson Education South Asia Pte Ltd
13.4.2 Reciprocating Pump Performance
27. 13. Pump Selection and Applications
ã2005 Pearson Education South Asia Pte Ltd
13.4.3 Rotary Pump Performance
• Figure 13.9 shows a typical set of performance
curves for rotary pumps such as gear, vane, screw,
and lobe pumps.
• It is a plot of capacity, efficiency, and power versus
discharge pressure.
• As pressure is increased, a slight decrease in
capacity occurs due to internal leakage from the
high-pressure side to the low-pressure side.
• Volumetric efficiency is a measure of the ratio of the
volume flow rate delivered by the pump to the
theoretical delivery, based on the displacement per
revolution of the pump, times the speed of rotation.
28. 13. Pump Selection and Applications
ã2005 Pearson Education South Asia Pte Ltd
13.4.3 Rotary Pump Performance
29. 13. Pump Selection and Applications
ã2005 Pearson Education South Asia Pte Ltd
13.5 Kinetic Pump
• Kinetic pumps add energy to the fluid by
accelerating it through the action of a rotating
impeller.
• Figure 13.10 shows the basic configuration of a
radial flow centrifugal pump, the most common type
of kinetic pump.
• Figure 13.11 shows the basic design of radial, axial,
and mixed-flow impellers.
• The propeller type of pump (axial flow) depends on
the hydrodynamic action of the propeller blades to lift
and accelerate the fluid axially, along a path parallel
to the axis of the propeller.
30. 13. Pump Selection and Applications
ã2005 Pearson Education South Asia Pte Ltd
13.5 Kinetic Pump
31. 13. Pump Selection and Applications
ã2005 Pearson Education South Asia Pte Ltd
13.5 Kinetic Pump
32. 13. Pump Selection and Applications
ã2005 Pearson Education South Asia Pte Ltd
13.5 Kinetic Pump
• Examples of kinetic pumps are:
1. Jet Pumps
2. Submersible Pumps
3. Small Centrifugal Pumps
4. Self-priming Pumps
5. Vertical Turbine Pumps
6. Centrifugal Grinder Pumps
33. 13. Pump Selection and Applications
ã2005 Pearson Education South Asia Pte Ltd
13.5 Kinetic Pump
• Fig 13.12 shows the deep-well jet pump.
34. 13. Pump Selection and Applications
ã2005 Pearson Education South Asia Pte Ltd
13.5 Kinetic Pump
• Fig 13.13 shows the shallow-well jet pump.
35. 13. Pump Selection and Applications
ã2005 Pearson Education South Asia Pte Ltd
13.5 Kinetic Pump
• Fig 13.13 shows the shallow-well jet pump.
36. 13. Pump Selection and Applications
ã2005 Pearson Education South Asia Pte Ltd
13.5 Kinetic Pump
• Fig 13.14 shows the portable submersible pump.
37. 13. Pump Selection and Applications
ã2005 Pearson Education South Asia Pte Ltd
13.5 Kinetic Pump
• Fig 13.15 shows the small centrifugal pump with
integral motor.
38. 13. Pump Selection and Applications
ã2005 Pearson Education South Asia Pte Ltd
13.5 Kinetic Pump
• Fig 13.16 shows the self-priming pump. (1) Suction
inlet casing, (2) impeller, (3) mechanical shaft seal,
(4) shaft.
39. 13. Pump Selection and Applications
ã2005 Pearson Education South Asia Pte Ltd
13.5 Kinetic Pump
• Fig 13.17 shows the vertical turbine pump.
40. 13. Pump Selection and Applications
ã2005 Pearson Education South Asia Pte Ltd
13.5 Kinetic Pump
• Fig 13.18 shows the centrifugal grinder pump.
41. 13. Pump Selection and Applications
ã2005 Pearson Education South Asia Pte Ltd
13.6 Performance Data for Centrifugal Pumps
• Because centrifugal pumps are not positive-
displacement types, there is a strong dependency
between capacity and the pressure that must be
developed by the pump.
• This makes their performance ratings somewhat
more complex.
• The typical rating curve plots the total head on the
pump versus the capacity or discharge Q, as shown
in Fig. 13.19.
42. 13. Pump Selection and Applications
ã2005 Pearson Education South Asia Pte Ltd
13.6 Performance Data for Centrifugal Pumps
43. 13. Pump Selection and Applications
ã2005 Pearson Education South Asia Pte Ltd
13.6 Performance Data for Centrifugal Pumps
• Efficiency and power required are also important to
the successful operation of a pump.
• Figure 13.20 shows a more complete performance
rating of a pump, superimposing head, efficiency,
and power curves and plotting all three versus
capacity.
44. 13. Pump Selection and Applications
ã2005 Pearson Education South Asia Pte Ltd
13.6 Performance Data for Centrifugal Pumps
45. 13. Pump Selection and Applications
ã2005 Pearson Education South Asia Pte Ltd
13.7 Affinity Laws for Centrifugal Pumps
• It is important to understand the manner in which
capacity, head, and power vary when either speed
or impeller diameter is varied.
• These relationships, called affinity laws, are listed
here.
• The symbol N refers to the rotational speed of the
impeller, usually in revolutions per minute (r/min, or
rpm).
46. 13. Pump Selection and Applications
ã2005 Pearson Education South Asia Pte Ltd
13.7 Affinity Laws for Centrifugal Pumps
• When speed varies:
1. Capacity varies directly with speed:
2. The total head capability varies with the square of
the speed:
47. 13. Pump Selection and Applications
ã2005 Pearson Education South Asia Pte Ltd
13.7 Affinity Laws for Centrifugal Pumps
3. The power required by the pump varies with the
cube of the speed:
48. 13. Pump Selection and Applications
ã2005 Pearson Education South Asia Pte Ltd
13.7 Affinity Laws for Centrifugal Pumps
• When impeller varies:
1. Capacity varies directly with impeller diameter:
2. The total head varies with the square of the impeller
diameter:
49. 13. Pump Selection and Applications
ã2005 Pearson Education South Asia Pte Ltd
13.7 Affinity Laws for Centrifugal Pumps
3. The power required by the pump varies with the
cube of the impeller diameter:
• Efficiency remains nearly constant for speed
changes and for small changes in impeller diameter.
50. 13. Pump Selection and Applications
ã2005 Pearson Education South Asia Pte Ltd
Example 13.1
Assume that the pump for which the performance data
are plotted in Fig. 13.20 was operating at a rotational
speed of 1750 rpm and that the impeller diameter was
330 mm. First determine the head that would result in a
capacity of 5670 L/min (1500 gal/min) and the power
required to drive the pump. Then, compute the
performance at a speed of 1250 rpm.
From Fig. 13.20, projecting upward from Q1=5670 L/min
(1500 gal/min) gives
51. 13. Pump Selection and Applications
ã2005 Pearson Education South Asia Pte Ltd
Example 13.1
When the speed is changed to 1250 rpm, the new
performance can be computed by using the affinity laws:
Note the significant decrease in the power required to
run the pump. If the capacity and the available head are
adequate, large savings in energy costs can be obtained
by varying the speed of operation of a pump.
52. 13. Pump Selection and Applications
ã2005 Pearson Education South Asia Pte Ltd
13.8 Manufacturers’ Data for Centrifugal Pumps
• Figure 13.21 shows a composite rating chart for one
line of pumps, which allows the quick determination
of the pump size.
53. 13. Pump Selection and Applications
ã2005 Pearson Education South Asia Pte Ltd
13.8.1 Effect of Impeller Size
• Figure 13.22 shows how the performance of a given
pump varies as the size of the impeller varies.
54. 13. Pump Selection and Applications
ã2005 Pearson Education South Asia Pte Ltd
13.8.2 Effect of Speed
• Figure 13.23 shows the performance of the same
pump operating at 1750 rpm (a standard four-pole
motor speed) instead of 3500 rpm.
55. 13. Pump Selection and Applications
ã2005 Pearson Education South Asia Pte Ltd
13.8.3 Power Required
• Figure 13.24 is the same as Fig. 13.22, except that
the curves showing the power required to drive the
pump have been added.
56. 13. Pump Selection and Applications
ã2005 Pearson Education South Asia Pte Ltd
13.8.4 Efficiency
• Figure 13.25 is the same as Fig. 13.22, except that
curves of constant efficiency have been added.
57. 13. Pump Selection and Applications
ã2005 Pearson Education South Asia Pte Ltd
13.8.5 Net Positive Suction Head Required
• Net positive suction head required (NPSHR) is an
important factor to consider in applying a pump.
• NPSHR is related to the pressure at the inlet to the
pump.
• Fig 13.26 shows the illustration of pump
performance for different impeller diameters with net
positive suction head required.
58. 13. Pump Selection and Applications
ã2005 Pearson Education South Asia Pte Ltd
13.8.5 Net Positive Suction Head Required
59. 13. Pump Selection and Applications
ã2005 Pearson Education South Asia Pte Ltd
13.8.6 Composite Performance Chart
• Figure 13.27 puts all these data together on one
chart so the user can see all important parameters at
the same time.
60. 13. Pump Selection and Applications
ã2005 Pearson Education South Asia Pte Ltd
Example 13.2
A centrifugal pump must deliver at least 945 L/min of
water at a total head of 91 m (300 ft) of water. Specify a
suitable pump. List its performance characteristics.
61. 13. Pump Selection and Applications
ã2005 Pearson Education South Asia Pte Ltd
Example 13.2
One possible solution can be found from Fig. 13.27. The
pump with a 0.23 m (9-in) impeller will deliver
approximately 1040 L/min (275 gal/min) at 91 m (300 ft)
of head. At this operating point, the efficiency would be
57 percent, near the maximum for this type of pump.
Approximately 28 kW (37 hp) would be required. The
NPSHR at the suction inlet to the pump is approximately
2.8 m (9.2 ft) of water.
62. 13. Pump Selection and Applications
ã2005 Pearson Education South Asia Pte Ltd
13.8.7 Additional Performance Chart
• Figures 13.28–13.33 show the composite
performance charts for six other medium-sized
centrifugal pumps.
• Figures 13.34 and 13.35 show two additional
performance curves for smaller centrifugal pumps.
• Because these pumps are generally offered with
only one impeller size, the manner of displaying the
performance parameters is somewhat different.
63. 13. Pump Selection and Applications
ã2005 Pearson Education South Asia Pte Ltd
13.8.7 Additional Performance Chart
• Figure 13.28 shows the performance for a 1.5 x 3,
6 centrifugal pump at 1750 rpm.
64. 13. Pump Selection and Applications
ã2005 Pearson Education South Asia Pte Ltd
13.8.7 Additional Performance Chart
• Figure 13.29 shows the performance for a 3 x 4,
10 centrifugal pump at 1750 rpm.
65. 13. Pump Selection and Applications
ã2005 Pearson Education South Asia Pte Ltd
13.8.7 Additional Performance Chart
• Figure 13.30 shows the performance for a 3 x 4,
13 centrifugal pump at 1750 rpm.
66. 13. Pump Selection and Applications
ã2005 Pearson Education South Asia Pte Ltd
13.8.7 Additional Performance Chart
• Figure 13.31 shows the performance for a 6 x 8,
17 centrifugal pump at 1780 rpm.
67. 13. Pump Selection and Applications
ã2005 Pearson Education South Asia Pte Ltd
13.8.7 Additional Performance Chart
• Figure 13.32 shows the performance for a 2 x 3,
8 centrifugal pump at 3560 rpm.
68. 13. Pump Selection and Applications
ã2005 Pearson Education South Asia Pte Ltd
13.8.7 Additional Performance Chart
• Figure 13.33 shows the performance for a 1.5 x 3,
13 centrifugal pump at 3560 rpm.
69. 13. Pump Selection and Applications
ã2005 Pearson Education South Asia Pte Ltd
13.8.7 Additional Performance Chart
• Figure 13.34 shows the Model TE-5.5 centrifugal
pump.
70. 13. Pump Selection and Applications
ã2005 Pearson Education South Asia Pte Ltd
13.9 The Operating Point of a Pump and Pump Selection
• The operating point of a pump is defined as the
volume flow rate it will deliver when installed in a
given system.
• The total head developed by the pump is determined
by the system resistance corresponding to the same
volume flow rate.
• Figure 13.36 illustrates the concept.
71. 13. Pump Selection and Applications
ã2005 Pearson Education South Asia Pte Ltd
13.9 The Operating Point of a Pump and Pump Selection
72. 13. Pump Selection and Applications
ã2005 Pearson Education South Asia Pte Ltd
13.9 The Operating Point of a Pump and Pump Selection
• The pump is holding the fluid at the elevation of the
destination point in the system and maintaining the
fluid pressure at that point.
• This point is called the total static head , where
• This equation, derived from the energy equation,
says that the pump must develop a head equal to
the pressure head difference between the two
reference points plus the elevation head difference
before any flow is delivered.
73. 13. Pump Selection and Applications
ã2005 Pearson Education South Asia Pte Ltd
13.9 The Operating Point of a Pump and Pump Selection
• As the flow increases with its corresponding
increase in total head, the system curve eventually
intersects the pump rating curve.
• Where the system curve and the pump rating
curve intersect is the true operating point of the
pump in this system.
74. 13. Pump Selection and Applications
ã2005 Pearson Education South Asia Pte Ltd
13.10 Net Positive Suction Head
• An important part of the pump selection process is to
ensure that the condition of the fluid entering the
pump is suitable to maintain full liquid flow.
• The primary factor is the fluid pressure at the pump
inlet, typically called the suction port.
• The design of the suction piping system must
provide a sufficiently high pressure that will avoid the
development of vapor bubbles within the flowing
fluid, a condition called cavitation.
75. 13. Pump Selection and Applications
ã2005 Pearson Education South Asia Pte Ltd
13.10.1 Cavitations
• At the suction inlet of a pump, if the pump must pull
fluid from below or if there are excessive energy
losses in the suction line, the pressure at the pump
may be sufficiently low to cause vapor bubbles to
form in the fluid.
• When cavitation occurs, the performance of the
pump is severely degraded as the volume flow rate
delivered drops.
• The pump becomes noisy, giving off a loud, rattling
sound as if gravel was flowing with the fluid. If this
was allowed to continue, the pump would be
destroyed in a short time.
76. 13. Pump Selection and Applications
ã2005 Pearson Education South Asia Pte Ltd
13.10.2 Vapor Pressure
• The fluid property that determines the conditions
under which vapor bubbles form in a fluid is its vapor
pressure pvp typically reported as an absolute
pressure in the units of kPa absolute or psia.
• The pressure of the liquid at this condition is called
the vapor pressure.
• A liquid is called volatile if it has a relatively high
vapor pressure and vaporizes rapidly at ambient
conditions.
• Table 13.2 shows the vapor pressure and vapor
pressure head of water.
77. 13. Pump Selection and Applications
ã2005 Pearson Education South Asia Pte Ltd
13.10.2 Vapor Pressure
78. 13. Pump Selection and Applications
ã2005 Pearson Education South Asia Pte Ltd
13.10.3 NPSH
• Pump manufacturers test each pump design to
determine the level of suction pressure required to
avoid cavitation, reporting the result as the net
positive suction head required, NPSHR, for the pump
at each operating condition of capacity (volume flow
rate) and total head on the pump.
• We can define the NPSH margin M to be
79. 13. Pump Selection and Applications
ã2005 Pearson Education South Asia Pte Ltd
13.10.3 NPSH
• In design problems in this book, we call for a
minimum of 10% margin. That
• Fig 13.37 shows the vapor pressure versus
temperature for common liquids. The data for
gasoline are approximate because there are many
different formulations that have widely varying
volatility for vehicle operation in different climates
and altitudes.
80. 13. Pump Selection and Applications
ã2005 Pearson Education South Asia Pte Ltd
13.10.3 NPSH
81. 13. Pump Selection and Applications
ã2005 Pearson Education South Asia Pte Ltd
13.10.3 NPSH
82. 13. Pump Selection and Applications
ã2005 Pearson Education South Asia Pte Ltd
13.10.4 Computing NPSHA
• The value of NPSHA is dependent on the vapor
pressure of the fluid being pumped, energy losses in
the suction piping, the location of the fluid reservoir,
and the pressure applied to the fluid in the reservoir.
• This can be expressed as
• Fig 13.38 shows the pump suction-line details and
definitions of terms for computing NPSH.
83. 13. Pump Selection and Applications
ã2005 Pearson Education South Asia Pte Ltd
13.10.4 Computing NPSHA
84. 13. Pump Selection and Applications
ã2005 Pearson Education South Asia Pte Ltd
13.10.4 Computing NPSHA
• Figure 13.38(a) includes a pressurized reservoir
placed above the pump.
• Part (b) shows the pump drawing fluid from an open
reservoir below the pump.
85. 13. Pump Selection and Applications
ã2005 Pearson Education South Asia Pte Ltd
13.10.5 Effect of Pump Speed on NPSH
• The data given in pump catalogs for NPSH are for
water and apply only to the listed operating speed. If
the pump is operated at a different speed, the NPSH
required at the new speed can be calculated from
where the subscript 1 refers to catalog data and the
subscript 2 refers to conditions at the new operating
speed. The pump speed in rpm is N.
86. 13. Pump Selection and Applications
ã2005 Pearson Education South Asia Pte Ltd
Example 13.3
Determine the available NPSH for the system shown in
Fig. 13.38(a). The fluid reservoir is a closed tank with a
pressure of -20 kPa above water at 70°C. The
atmospheric pressure is 100.5 kPa. The water level in
the tank is 2.5 m above the pump inlet. The pipe is a
1.5-in Schedule 40 steel pipe with a total length of 12.0
m. The elbow is standard and the valve is a fully open
globe valve. The flow rate is 95 L/min.
87. 13. Pump Selection and Applications
ã2005 Pearson Education South Asia Pte Ltd
Example 13.3
Using Eq. (13–14),
But we know that
Now, based on the elevation of the tank, we have
88. 13. Pump Selection and Applications
ã2005 Pearson Education South Asia Pte Ltd
Example 13.3
To find the friction loss , we must find the velocity,
Reynolds number, and friction factor:
Thus, from Fig. 8.6, f = 0.0225. From Table 10.5,
fT = 0.021. Now we have
89. 13. Pump Selection and Applications
ã2005 Pearson Education South Asia Pte Ltd
Example 13.3
The velocity head is
Then, the friction loss is
Finally, from Table 13.2 we get
90. 13. Pump Selection and Applications
ã2005 Pearson Education South Asia Pte Ltd
Example 13.3
Combining these terms gives
We can compute the maximum allowable NPSHR for the
pump from Eq. (13–13),
Thus
91. 13. Pump Selection and Applications
ã2005 Pearson Education South Asia Pte Ltd
13.11 Suction Line Details
• The suction line refers to all parts of the flow system
from the source of the fluid to the inlet of the pump.
• Figure 13.38 shows two methods of providing fluid to
a pump. In part (a), a positive head is created by
placing the pump below the supply reservoir.
• This is an aid in ensuring a satisfactory NPSH. In
addition, the pump will always be primed with a
column of liquid at start-up.
• In Fig. 13.38(b), a suction lift condition occurs
because the pump must draw liquid from below.
92. 13. Pump Selection and Applications
ã2005 Pearson Education South Asia Pte Ltd
13.11 Suction Line Details
• Some of these practical considerations include the
cost of pipe, valves, and fittings; the physical space
available to accommodate these elements; and the
attachment of the suction pipe to the suction
connection of the pump.
93. 13. Pump Selection and Applications
ã2005 Pearson Education South Asia Pte Ltd
13.12 Discharge Line Details
• In general, the discharge line should be as short and
direct as possible to minimize the head on the pump.
• Elbows should be of the standard or long-radius type
if possible.
• Pipe size should be chosen according to velocity or
allowable friction losses.
• As shown in Fig. 13.39, other elements may be
added to the discharge line as required.
• A pressure relief valve will protect the pump and
other equipment in case of a blockage of the flow or
accidental shut-off of a valve.
94. 13. Pump Selection and Applications
ã2005 Pearson Education South Asia Pte Ltd
13.13 Piping System Design and Pump Selection
• Below are the piping system design procedure:
1. Obtain specifications for the system including the fluid to be
pumped, design value of the volume flow rate required,
location of the fluid source reservoir, location of the
destination point, and any prescribed elevations and
pressures, particularly at the source and the destination.
2. Determine the fluid properties including temperature, specific
weight, kinematic viscosity, and vapor pressure.
3. Generate a proposed piping layout including the place where
fluid will be drawn from the source reservoir, the placement of
the pump, and suction and discharge line details with
appropriate valves, fittings, and special accessories or
equipment. Consider connections to reservoirs, needs to shut
off or control fluid flow rate, prevention of undesirable back
flow, and service of the pump and other equipment in the
system.
95. 13. Pump Selection and Applications
ã2005 Pearson Education South Asia Pte Ltd
13.13 Piping System Design and Pump Selection
4. Determine the lengths of pipe in the suction and
discharge lines.
5. Specify the pipe sizes for the suction and discharge
lines using Section 6.5 and Fig. 6.2 in Chapter 6 as
a guide.
6. Analyze the system performance at the design flow
rate to determine the total dynamic head using Eq.
(13–1). The spreadsheet described in Section 11.4
can be used.
7. Evaluate the total static head from Eq. (13–11).
96. 13. Pump Selection and Applications
ã2005 Pearson Education South Asia Pte Ltd
13.13 Piping System Design and Pump Selection
8. Select a suitable pump that can deliver at least the design
flow rate against the total dynamic head at that flow rate,
considering the following:
a) Use Figs. 13.27–13.35, Internet sources, vendor catalogs, or
software such as PumpBase supplied with this book.
b) Seek a pump with high efficiency at the design point and one
for which the operating point is near the best efficiency point
(BEP) for the pump.
c) Standards set jointly by the American National Standards
Institute (ANSI) and the Hydraulic Institute (HI) call for a
preferred operating region (POR) for centrifugal pumps to be
between 70 percent and 120 percent of the BEP. See
Standard ANSI/HI 9.6.3-1997, Standard for Centrifugal and
Vertical Pumps for Allowable Operating Region.
d) Specify the model designation, speed, impeller size, and the
sizes for the suction and discharge ports.
97. 13. Pump Selection and Applications
ã2005 Pearson Education South Asia Pte Ltd
13.13 Piping System Design and Pump Selection
9. Determine points on the system curve by analyzing the total
head corresponding to a range of flow rates. The spreadsheet
described in Section 11.4 can greatly facilitate this process
because all system data were entered in Step 6. Only the
flow rate needs to be changed for each calculation.
10. Plot the system curve on the pump performance graph and
determine the actual expected operating point as the
intersection of the pump head versus flow curve and the
system curve.
11. At the actual operating point, determine the power required,
the actual volume flow rate delivered, efficiency, and the
NPSH required,NPSHR. Also check the type of pump,
mounting requirements, and types and sizes for the suction
and discharge ports.
98. 13. Pump Selection and Applications
ã2005 Pearson Education South Asia Pte Ltd
13.13 Piping System Design and Pump Selection
12.Compute the NPSH available, NSPHA for the
system, using Eq. (13–14).
13.Ensure that NPSHA > 1.10NAPSHR for all expected
operating conditions.
14.If necessary, provide a means of connecting the
specified pipe sizes to the connections for the pump
if they are different sizes. See Fig. 7.1 for an
example. Use a gradual reducer or a gradual
expander to minimize energy losses added to the
system by these elements.
99. 13. Pump Selection and Applications
ã2005 Pearson Education South Asia Pte Ltd
Example 13.4
Figure 13.40 shows a system in which a pump is
required to deliver at least 850 L/min of water at 15°C
from a lower reservoir to an elevated tank maintained at
a pressure of 240 kPa gage. Design the system and
specify a suitable pump. Then determine the operating
point for the pump in the system you have designed and
give the performance parameters for the pump at the
operating point.
100. 13. Pump Selection and Applications
ã2005 Pearson Education South Asia Pte Ltd
Example 13.4
101. 13. Pump Selection and Applications
ã2005 Pearson Education South Asia Pte Ltd
Example 13.4
Here we follow the steps listed in the Piping System
Design Procedure.
Step 1. Fluid: Water at 15°C:
Q=850 L/min minimum
Source: lower reservoir; p = 0kPa
Elevation=2.4 m above pump inlet
Destination: upper reservoir; p=240 kPa
Elevation=26.8 m above pump inlet
102. 13. Pump Selection and Applications
ã2005 Pearson Education South Asia Pte Ltd
Example 13.4
Step 2. Water at 15°C:
γ=9.80 kN/m3; v =1.12 x 10⁻⁶ m2/s; hvp =0.182 m.
Step 3. Figure 13.40 shows the proposed layout.
Step 4. Design decisions: Suction line is 2.4 m long;
discharge line is 110 m.
Step 5. Using Fig. 6.2 as a guide:
Suction pipe is 3.5-in Schedule 40 steel pipe; D=0.09 m,
A=6.381 x 10⁻³ m2
Discharge line is 2.5-in Schedule 40 steel pipe; D=0.063
m, A=3.09 x 10⁻³ m2
103. 13. Pump Selection and Applications
ã2005 Pearson Education South Asia Pte Ltd
Example 13.4
Step 6. Use the spreadsheet shown in Fig. 13.41.
Reference point 1 is the surface of the lower reservoir.
Reference point 2 is the surface of the upper reservoir.
Other data are entered into the spreadsheet as
discussed in Chapter 11. The result for the total dynamic
head is given by
104. 13. Pump Selection and Applications
ã2005 Pearson Education South Asia Pte Ltd
Example 13.4
Step 7. Total static head is
Step 8. Pump selection: From Fig. 13.27; 2 x 3 —10
centrifugal pump operating at 3500 rpm. The desired
operating point lies between the curves for the 8-in and
9-in impellers. We specify the 9-in impeller diameter so
the capacity is greater than the minimum of 850 L/min or
0.014 m3/s.
(Note: Some manufacturers permit specifying any
impeller diameter within the range given in the rating
diagram.)
105. 13. Pump Selection and Applications
ã2005 Pearson Education South Asia Pte Ltd
Example 13.4
Step 9. Points on the system curve are shown in Table
13.3, computed using the spreadsheet shown in Fig.
13.41 and varying the volume flow rate from zero to
1.1 m3/min.
Step 10. Figure 13.42 shows the system curve and the
pump rating curve for the 9-in impeller on the same
graph. The actual operating point is indicated.
106. 13. Pump Selection and Applications
ã2005 Pearson Education South Asia Pte Ltd
Example 13.4
107. 13. Pump Selection and Applications
ã2005 Pearson Education South Asia Pte Ltd
Example 13.4
108. 13. Pump Selection and Applications
ã2005 Pearson Education South Asia Pte Ltd
Example 13.4
109. 13. Pump Selection and Applications
ã2005 Pearson Education South Asia Pte Ltd
Example 13.4
Step 11. From the full chart of pump performance in Fig.
13.27, at the operating point:
110. 13. Pump Selection and Applications
ã2005 Pearson Education South Asia Pte Ltd
Example 13.4
Step 12.
111. 13. Pump Selection and Applications
ã2005 Pearson Education South Asia Pte Ltd
Example 13.4
Step 13. Compute
112. 13. Pump Selection and Applications
ã2005 Pearson Education South Asia Pte Ltd
Example 13.4
Step 14. The sizes of the suction and discharge pipes
are different from the sizes of the pump ports. A gradual
reducer must be used from the 3.5-in suction pipe to the
3-in suction port. A gradual enlargement must be used
from the 2-in discharge port to the 2.5-in discharge pipe.
The diameter ratio for each is approximately 1.2.
Referring to Fig. 10.5 for a gradual enlargement and Fig.
10.10 for a gradual reducer, and specifying a 15°C
included angle, we find the K value will be 0.09 for the
enlargement and 0.03 for the reducer. The additional
energy losses are
113. 13. Pump Selection and Applications
ã2005 Pearson Education South Asia Pte Ltd
Example 13.4
These values are negligible compared to the other
energy losses in the suction and discharge lines and
therefore should not significantly affect the pump
selection or its performance.
114. 13. Pump Selection and Applications
ã2005 Pearson Education South Asia Pte Ltd
13.14 Alternate System Operating Modes
• What happens if the speed of the pump varies?
• What if the fluid has a significantly higher or lower
viscosity than water?
• What if we want to use two or more pumps in
parallel to feed a system?
• What happens if we connect pumps in series where
the output from one feeds to the input of the next?
115. 13. Pump Selection and Applications
ã2005 Pearson Education South Asia Pte Ltd
13.14.1 Variable Speed Drives
• Variable-speed drives offer an attractive alternative to
throttling.
• Several types of mechanical variable-speed drives and a
variable-frequency electronic control for a standard AC
electric motor are available.
• The effect of implementing a variable-speed drive for a
system with a centrifugal pump depends on the nature of the
system curve as shown in Fig. 13.43.
• Part (a) shows a system curve that includes only friction
losses.
• The system curve in part (b) includes a substantial static
head comprised of an elevation change and pressure change
from the source to the destination.
116. 13. Pump Selection and Applications
ã2005 Pearson Education South Asia Pte Ltd
13.14.1 Variable Speed Drives
117. 13. Pump Selection and Applications
ã2005 Pearson Education South Asia Pte Ltd
13.14.1 Variable Speed Drives
• In addition to energy savings, other benefits result
from using variable-speed drives:
1. Improved process control Pump delivery can be
matched closely to requirements, resulting in
improved product quality.
2. Control of rate of change Variable-speed drives
control not only the final speed, but also the rate of
change of speed, reducing pressure surges.
3. Reduced wear Lower speeds dramatically reduce
forces on seals and bearings, resulting in longer life
and greater reliability of the pumping system.
118. 13. Pump Selection and Applications
ã2005 Pearson Education South Asia Pte Ltd
13.14.2 Effect of Fluid Viscosity
• The performance rating curves for centrifugal pumps
are generated from test data using water as the fluid.
• These curves are reasonably accurate for any fluid
with a viscosity similar to that of water.
• However, pumping more-viscous fluids causes the
following effects:
1. The power required to drive the pump increases
2. The flow delivered against a given head decreases
3. The efficiency decreases
119. 13. Pump Selection and Applications
ã2005 Pearson Education South Asia Pte Ltd
13.14.2 Effect of Fluid Viscosity
• Figure 13.44 illustrates the effect of pumping a
viscous fluid if the pump was selected for the desired
operating point without applying corrections.
120. 13. Pump Selection and Applications
ã2005 Pearson Education South Asia Pte Ltd
13.14.3 Operating Pumps in Parallel
• Many fluid flow systems require largely varying flow
rates that are difficult to provide with one pump
without calling for the pump to operate far off its best
efficiency point.
• Fig 13.45 shows the performance of two pumps in
parallel.
121. 13. Pump Selection and Applications
ã2005 Pearson Education South Asia Pte Ltd
13.14.4 Operating Pumps in Series
• Directing the output of one pump to the inlet of a
second pump allows the same capacity to be
obtained at a total head equal to the sum of the
ratings of the two pumps.
• This method permits operation against unusually
high heads.
• Fig 13.46 shows the performance of two pumps
operating in series.
122. 13. Pump Selection and Applications
ã2005 Pearson Education South Asia Pte Ltd
13.14.4 Operating Pumps in Series
123. 13. Pump Selection and Applications
ã2005 Pearson Education South Asia Pte Ltd
13.14.5 Multistage Pump
• A performance similar to that achieved by using
pumps in series can be obtained by using multistage
pumps.
• Two or more impellers are arranged in the same
housing in such a way that the fluid flows
successively from one to the next.
• Each stage increases the fluid pressure, so that a
high total head can be developed.
124. 13. Pump Selection and Applications
ã2005 Pearson Education South Asia Pte Ltd
13.15 Pump Selection and Specific Speed
• Figure 13.47 shows one method for deciding what
type of pump is suitable for a given service.
125. 13. Pump Selection and Applications
ã2005 Pearson Education South Asia Pte Ltd
13.15 Pump Selection and Specific Speed
• Another parameter that is useful in selecting the type
of pump for a given application is the specific speed,
defined as
126. 13. Pump Selection and Applications
ã2005 Pearson Education South Asia Pte Ltd
13.15 Pump Selection and Specific Speed
• The specific speed is often combined with the
specific diameter to produce a chart like that shown
in Fig. 13.48. The specific diameter is
• where D is the impeller diameter in inches.
127. 13. Pump Selection and Applications
ã2005 Pearson Education South Asia Pte Ltd
13.16 Life Cycle Costs for Pumped Fluid Systems
• The term life cycle cost (LCC) refers here to the
consideration of all factors that make up the cost of
acquiring, maintaining, and operating a pumped fluid
system.
• Good design practice seeks to minimize LCC by
quantifying and computing the sum of the following
factors:
1. Initial cost to purchase the pump, piping, valves and
other accessories, and controls.
2. Cost to install the system and put it into service.
128. 13. Pump Selection and Applications
ã2005 Pearson Education South Asia Pte Ltd
13.16 Life Cycle Costs for Pumped Fluid Systems
3. Energy cost required to drive the pump and auxiliary
components of the system over the expected life.
4. Operating costs related to managing the system including
labor and supervision.
5. Maintenance and repair costs over the life of the system to
keep the pump operating at design conditions.
6. Cost of lost production of a product during pump failures or
when the pump is shut down for maintenance.
7. Environmental costs created by spilled fluids from the pump
or related equipment.
8. Decommissioning costs at the end of the useful life of the
pump including disposal of the pump and cleanup of the site.
129. 13. Pump Selection and Applications
ã2005 Pearson Education South Asia Pte Ltd
13.16 Life Cycle Costs for Pumped Fluid Systems
3. Energy cost required to drive the pump and auxiliary
components of the system over the expected life.
4. Operating costs related to managing the system including
labor and supervision.
5. Maintenance and repair costs over the life of the system to
keep the pump operating at design conditions.
6. Cost of lost production of a product during pump failures or
when the pump is shut down for maintenance.
7. Environmental costs created by spilled fluids from the pump
or related equipment.
8. Decommissioning costs at the end of the useful life of the
pump including disposal of the pump and cleanup of the site.
130. 13. Pump Selection and Applications
ã2005 Pearson Education South Asia Pte Ltd
13.16 Life Cycle Costs for Pumped Fluid Systems
• When using SI units to determine specific speed,
NS, the following ranges are used for pump
classifications:
• Fig 13.48 shows the specific speed versus specific
diameter for centrifugal pumps—An aid to pump
selection.
131. 13. Pump Selection and Applications
ã2005 Pearson Education South Asia Pte Ltd
13.16 Life Cycle Costs for Pumped Fluid Systems
132. 13. Pump Selection and Applications
ã2005 Pearson Education South Asia Pte Ltd
13.16.1 MinimizingEnergy Costs
• For pumps that operate continuously for long periods
of time, the energy cost is the highest component of
the total life cycle cost.
• Some of the considerations:
1. Perform a careful, complete analysis of the proposed
design for the piping system to understand where
energy losses occur and to predict accurately the
design operating point for the pump.
2. Recognize that energy losses in piping, valves, and
fittings are proportional to the velocity head, that is,
to the square of the flow velocity.
133. 13. Pump Selection and Applications
ã2005 Pearson Education South Asia Pte Ltd
13.16.1 MinimizingEnergy Costs
2. Use the largest practical size of pipe for both the
suction and discharge lines of the system to keep
the flow velocity at a minimum. Fig 13.49 shows the
life-cycle cost principle for pumped fluid distribution
systems.
134. 13. Pump Selection and Applications
ã2005 Pearson Education South Asia Pte Ltd
13.16.1 MinimizingEnergy Costs
3. Use the largest practical size of pipe for both the
suction and discharge lines of the system to keep
the flow velocity at a minimum.
4. Carefully match the pump to the head and capacity
requirements of the system to ensure that the pump
operates at or near its best efficiency point (BEP)
and to avoid using an oversized pump that will cause
it to operate at a lower efficiency.
5. Use the most efficient pump for the application and
operate the pump as close as possible to its BEP.
135. 13. Pump Selection and Applications
ã2005 Pearson Education South Asia Pte Ltd
13.16.1 MinimizingEnergy Costs
6. Use high-efficiency electric motors or other prime
movers to drive the pump.
7. Consider the use of variable-speed drives (VSD) for
the pumps to permit matching the pump delivery to
the requirements of the process.
8. Consider two or more pumps operating in parallel for
systems requiring widely varying flow rates.
9. Provide diligent maintenance of the pump and piping
system to minimize the decrease in performance
due to wear, build-up of corrosion on pipe surfaces,
and fluid leakage.
136. 13. Pump Selection and Applications
ã2005 Pearson Education South Asia Pte Ltd
13.17 Software for Piping System Design and Pump Selection
• Steady or unsteady flow, stress analysis, and
dynamic response of the piping system are
sometimes included.
• Specialized software sets for spraying systems and
fire protection systems are also offered.
• Such software packages allow the consideration of
multiple design proposals to hone in on the optimum
system for the application, taking much of the
computational burden.
137. 13. Pump Selection and Applications
ã2005 Pearson Education South Asia Pte Ltd
13.17.1 Use of the Pumpbase Pump Selection Software
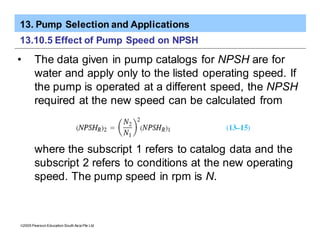
• The PumpBase software requires only a few input
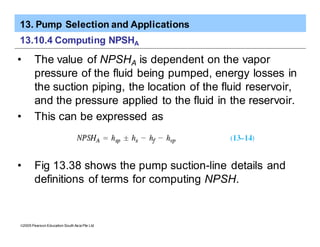
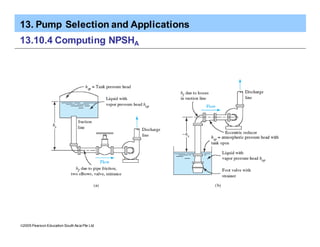
data points, such as total dynamic head (TDH) [Eq.
(13–1)] at the design flow rate and static head [Eq.
(13–11)].
• The system curve is automatically generated by
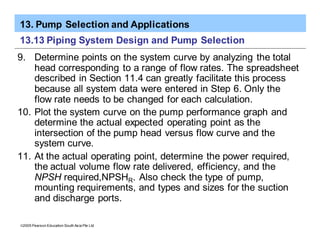
fitting a second-degree curve through these two
known points.
• PumpBase also allows the input of a limiting value of
NPSH required by the pump, and it will then screen
out any pump requiring a greater value.