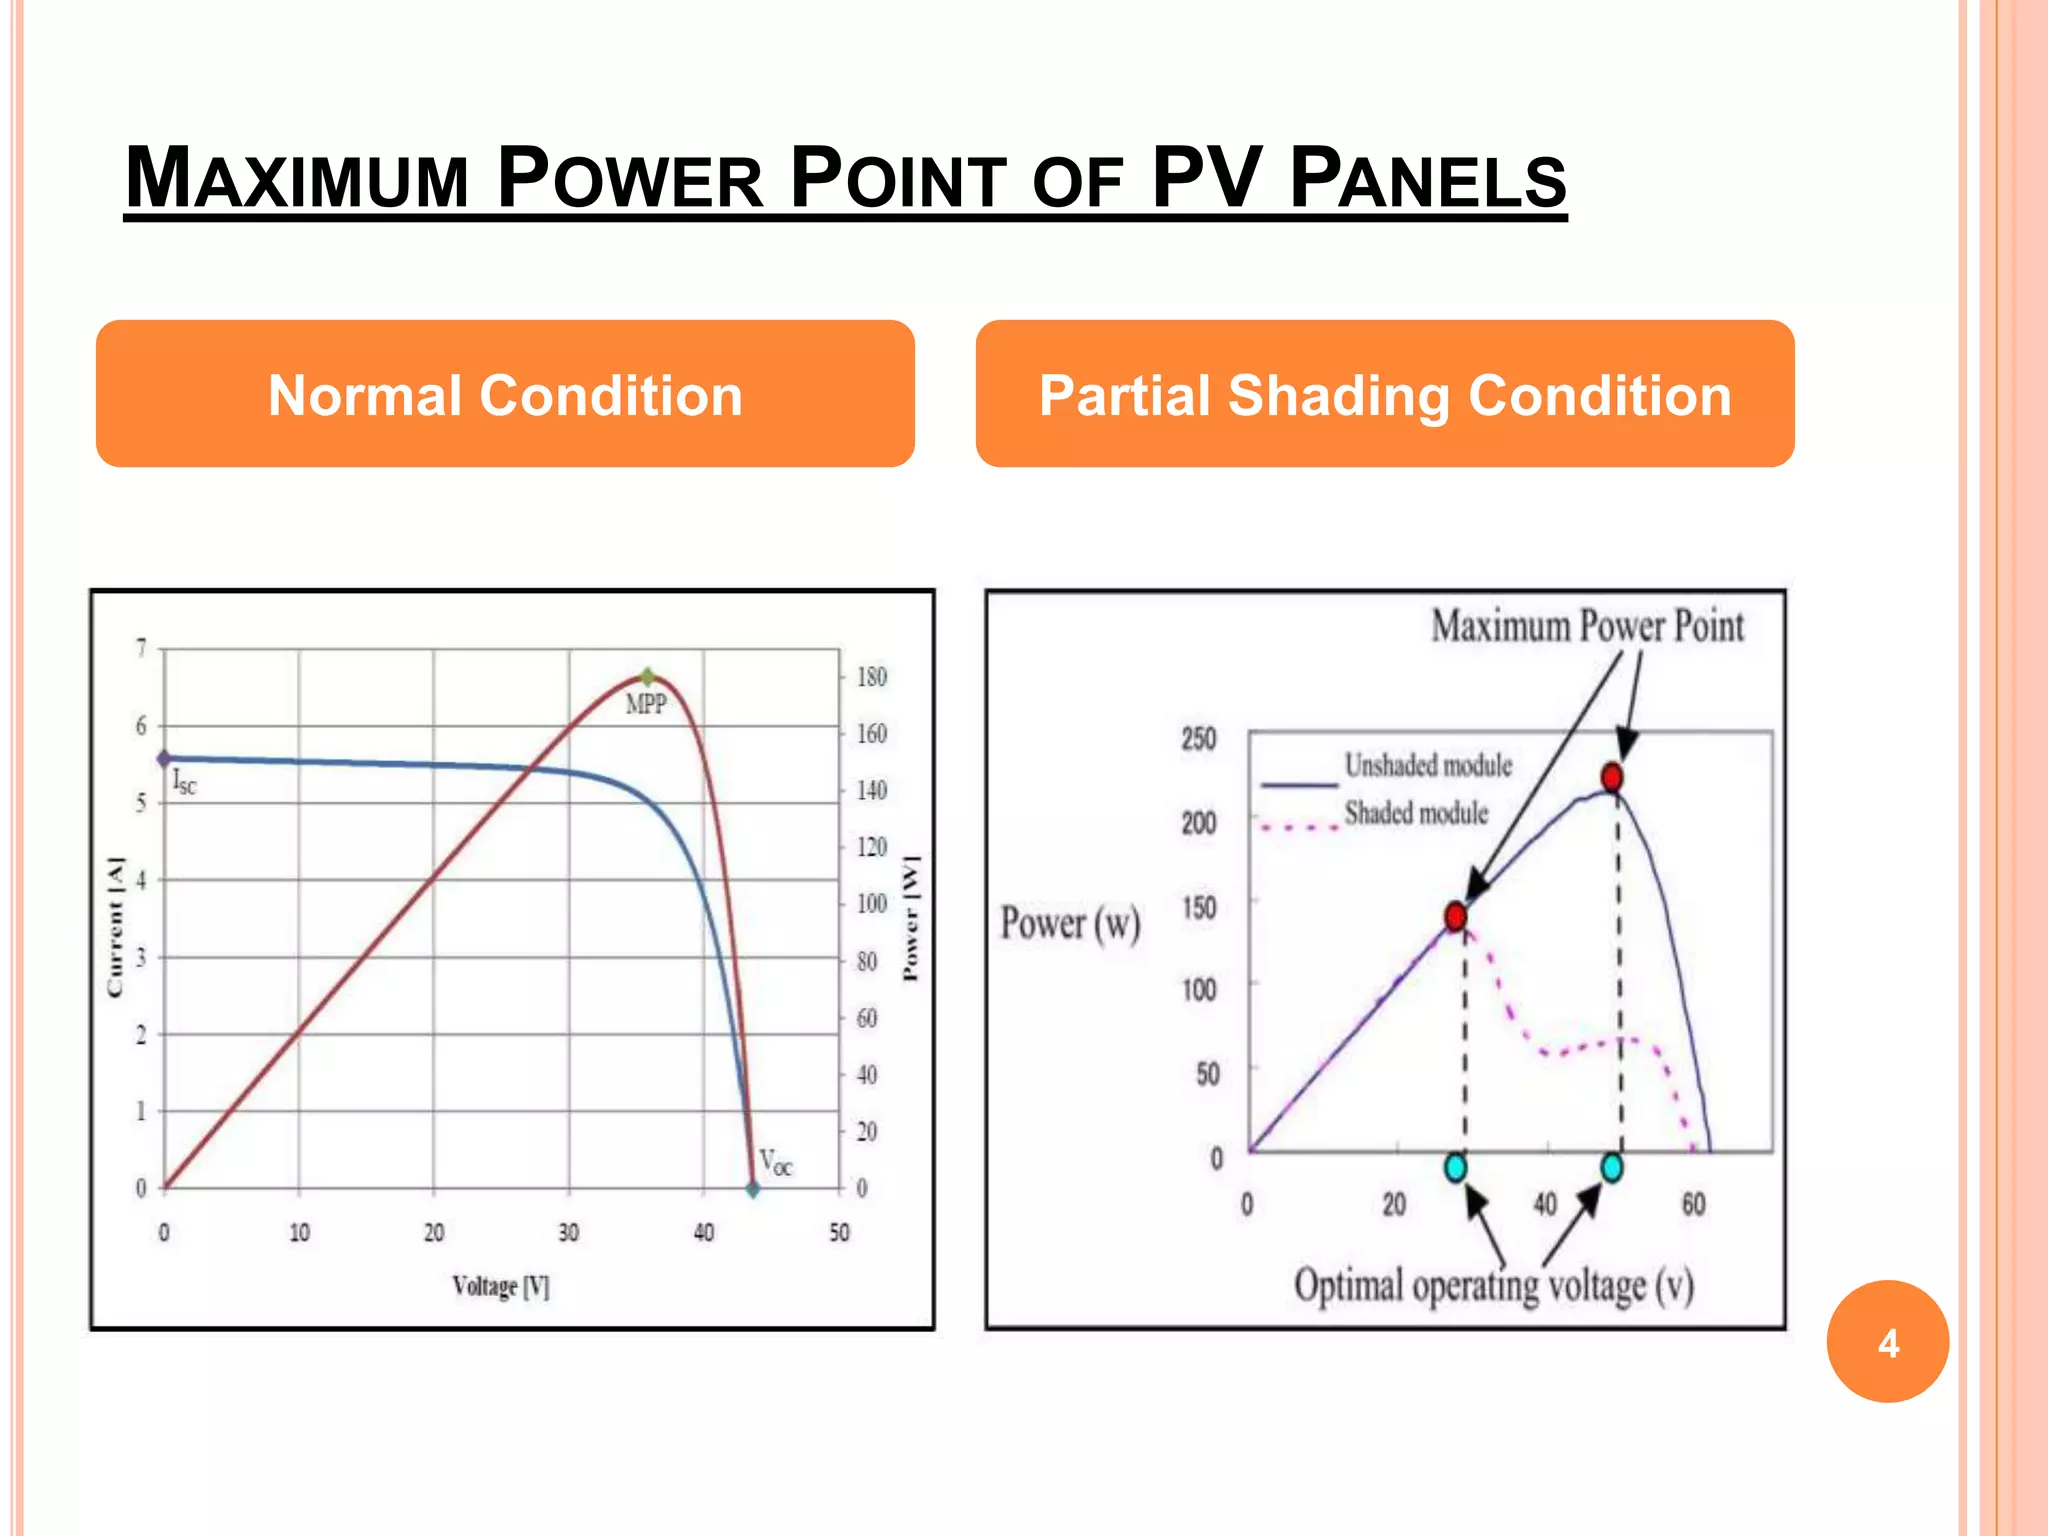
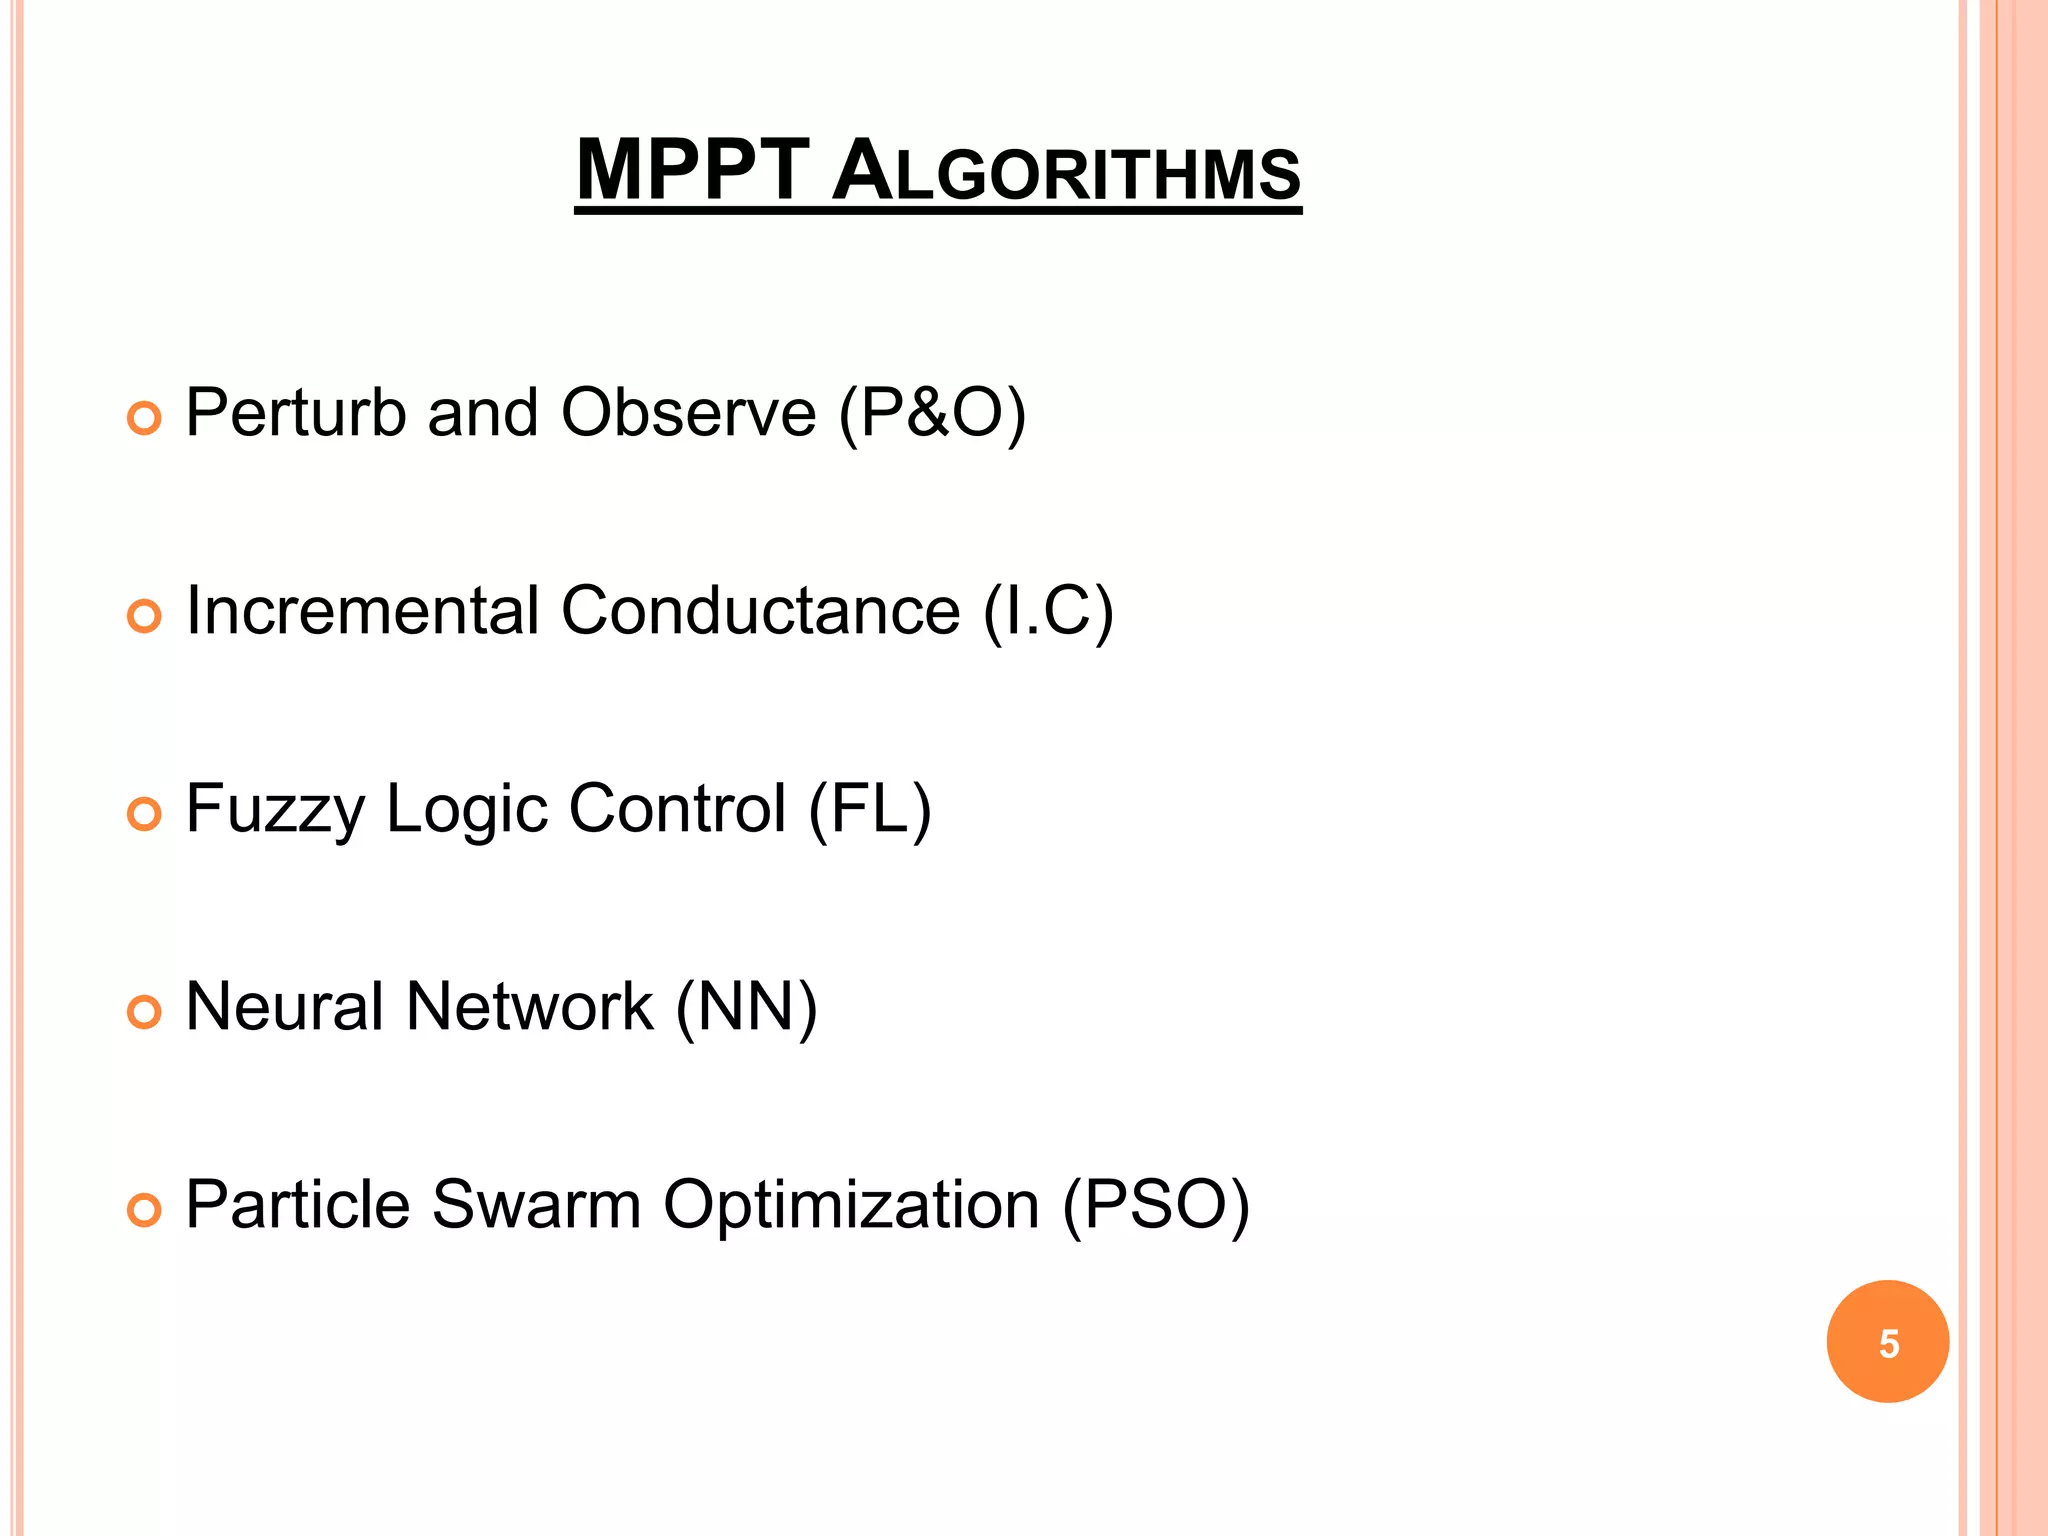
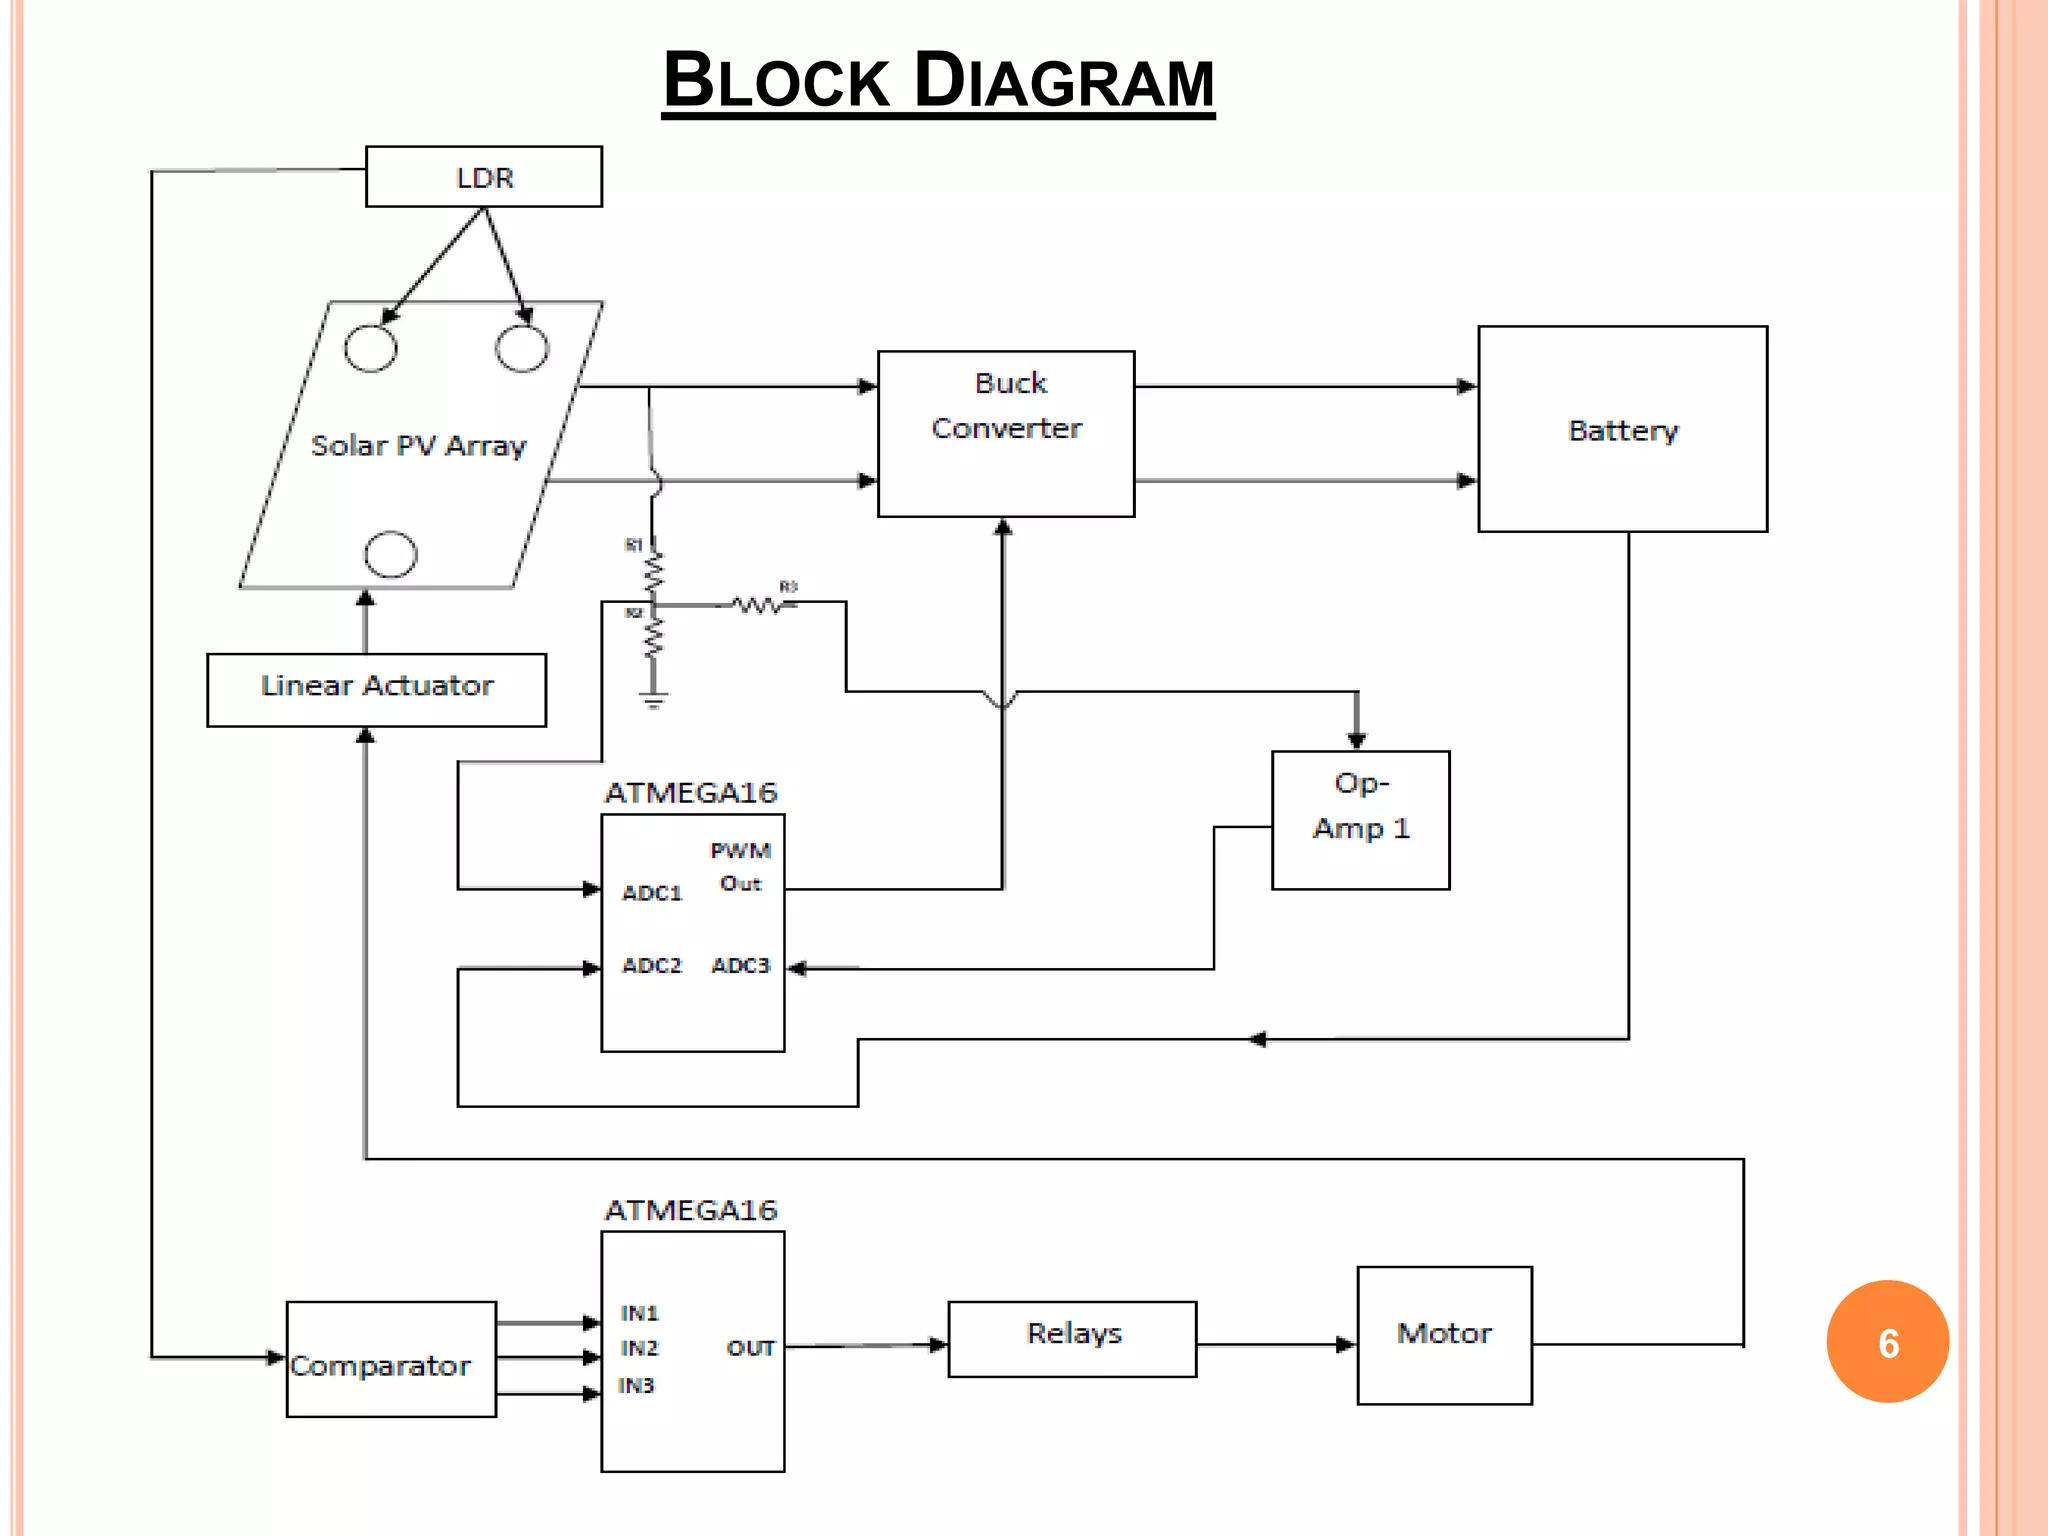
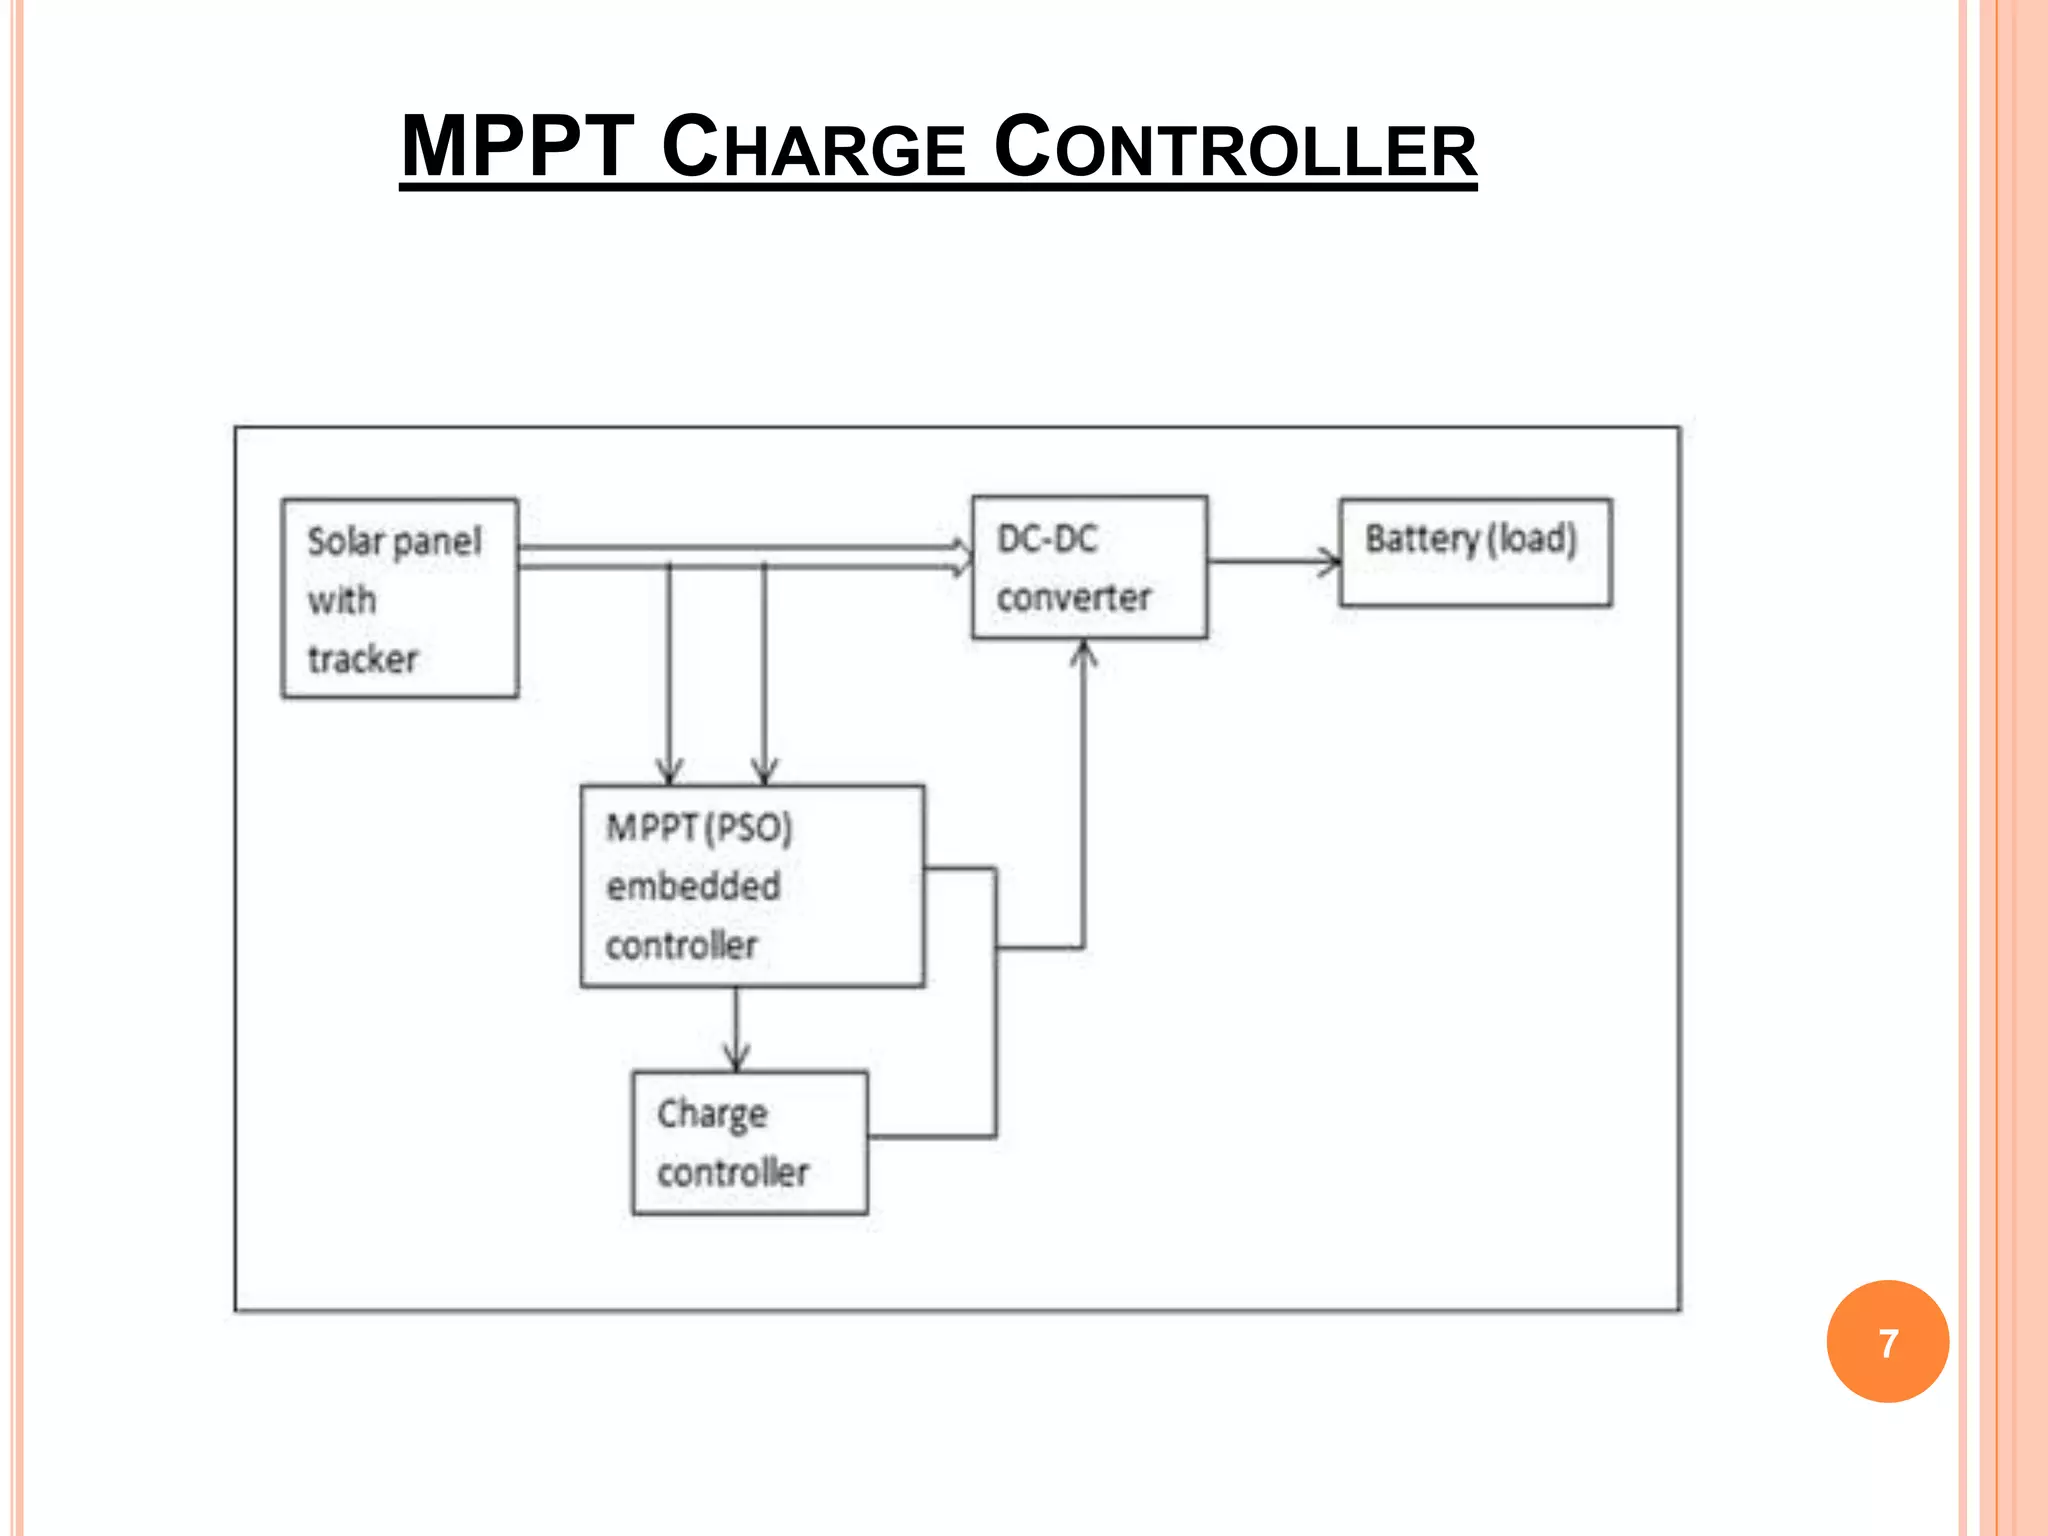
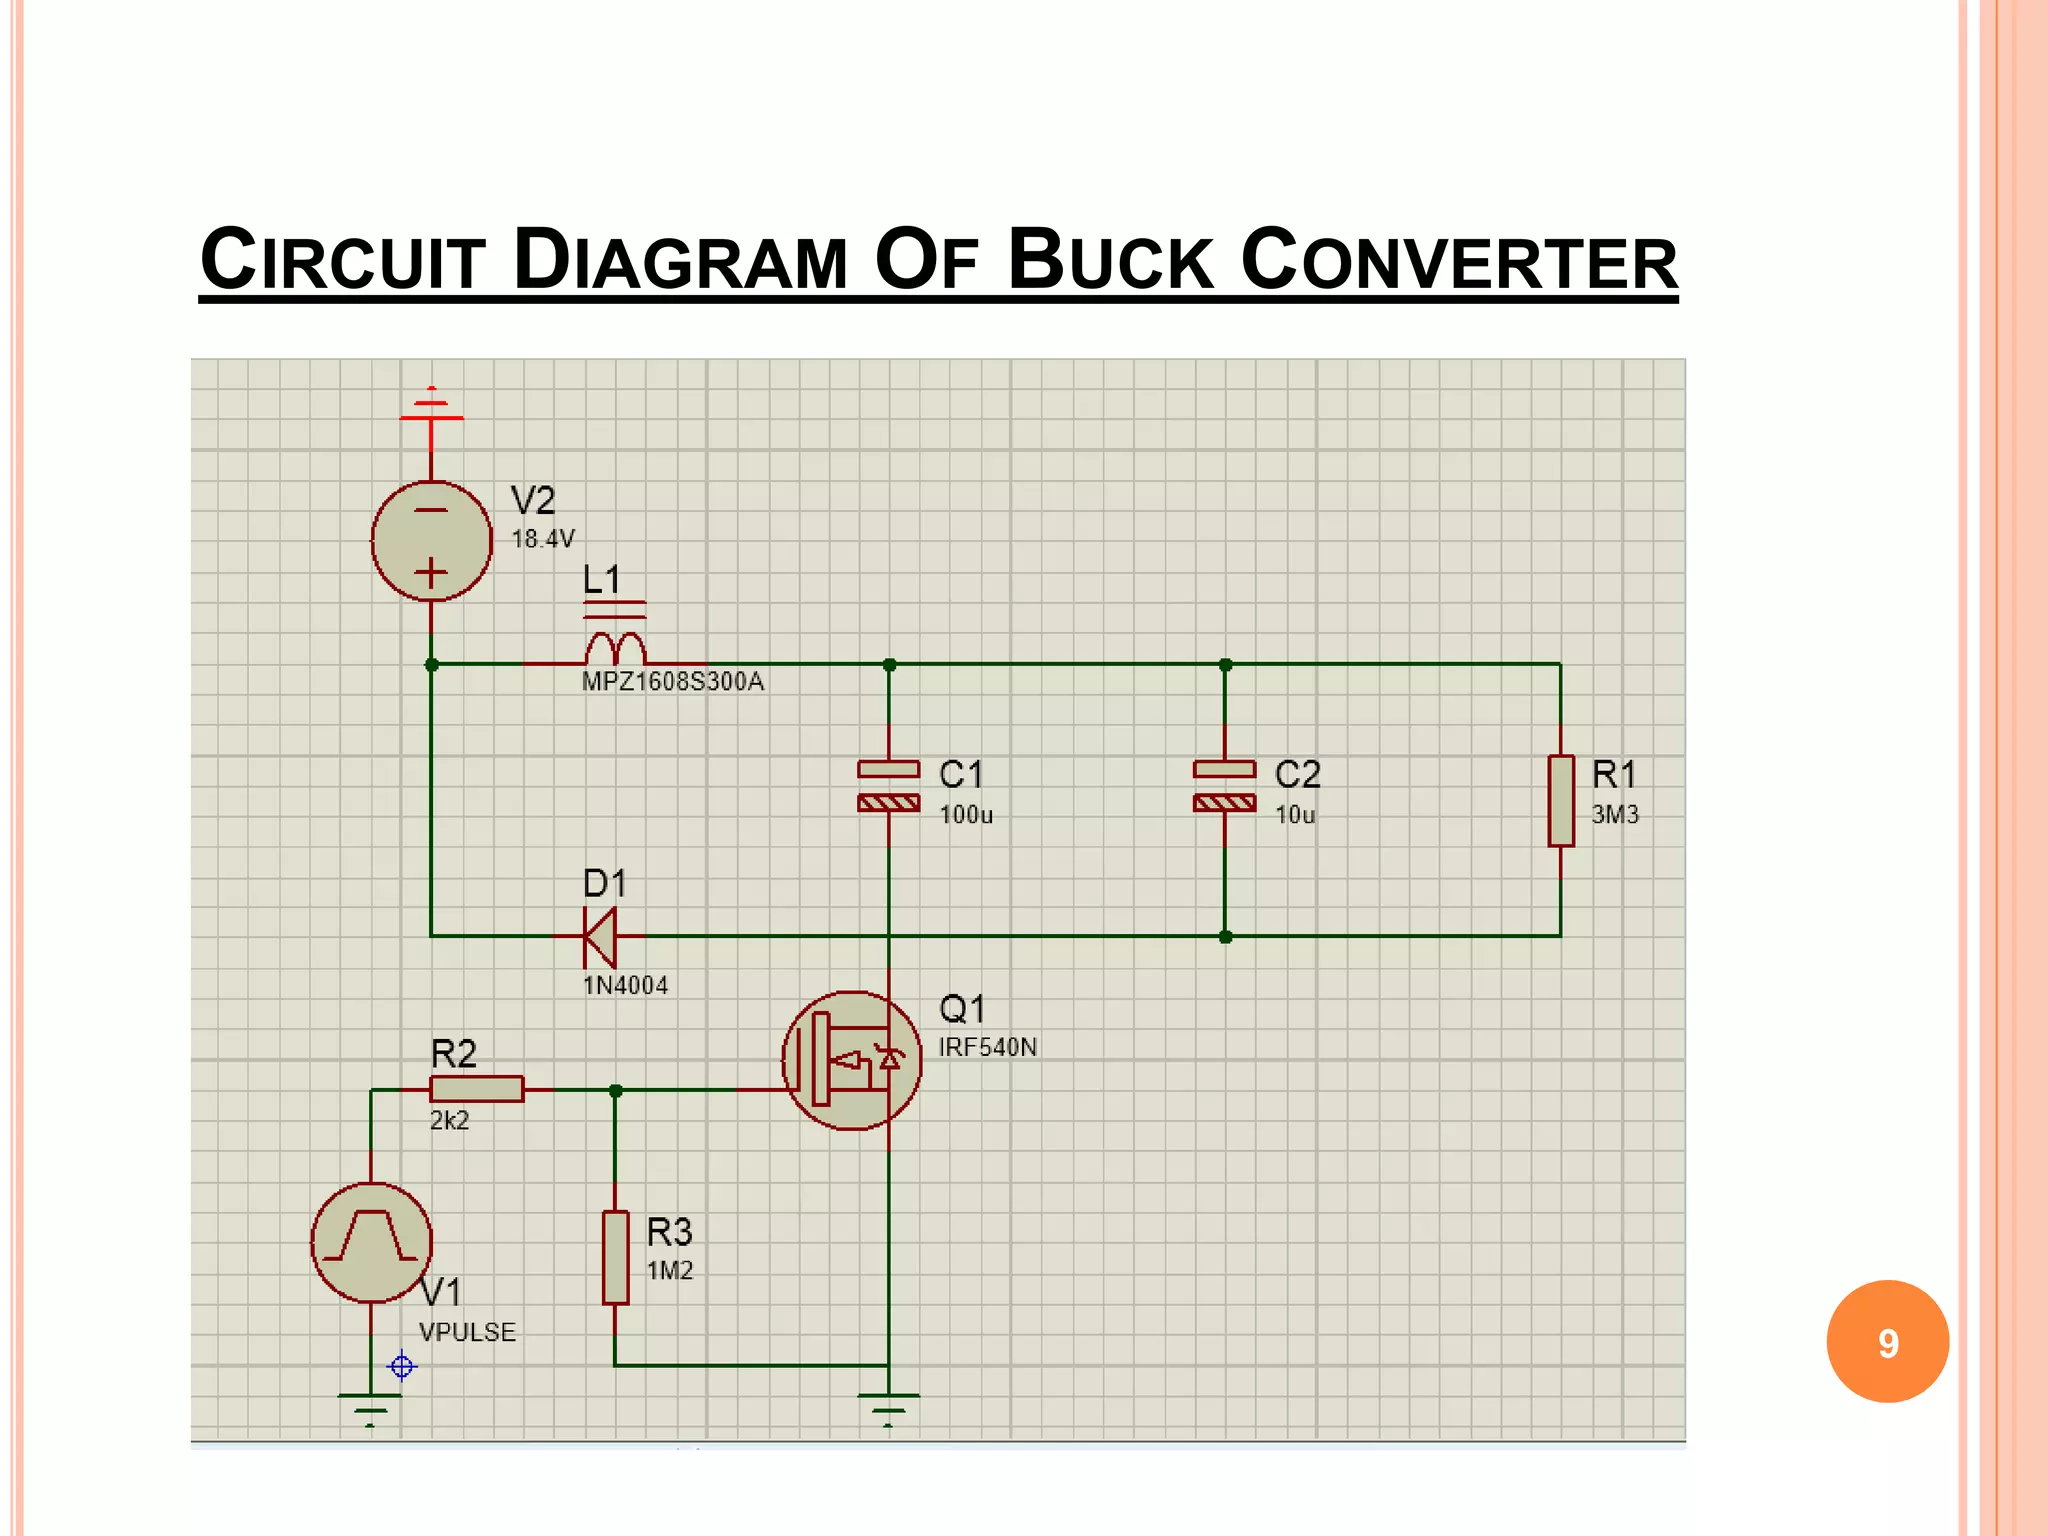
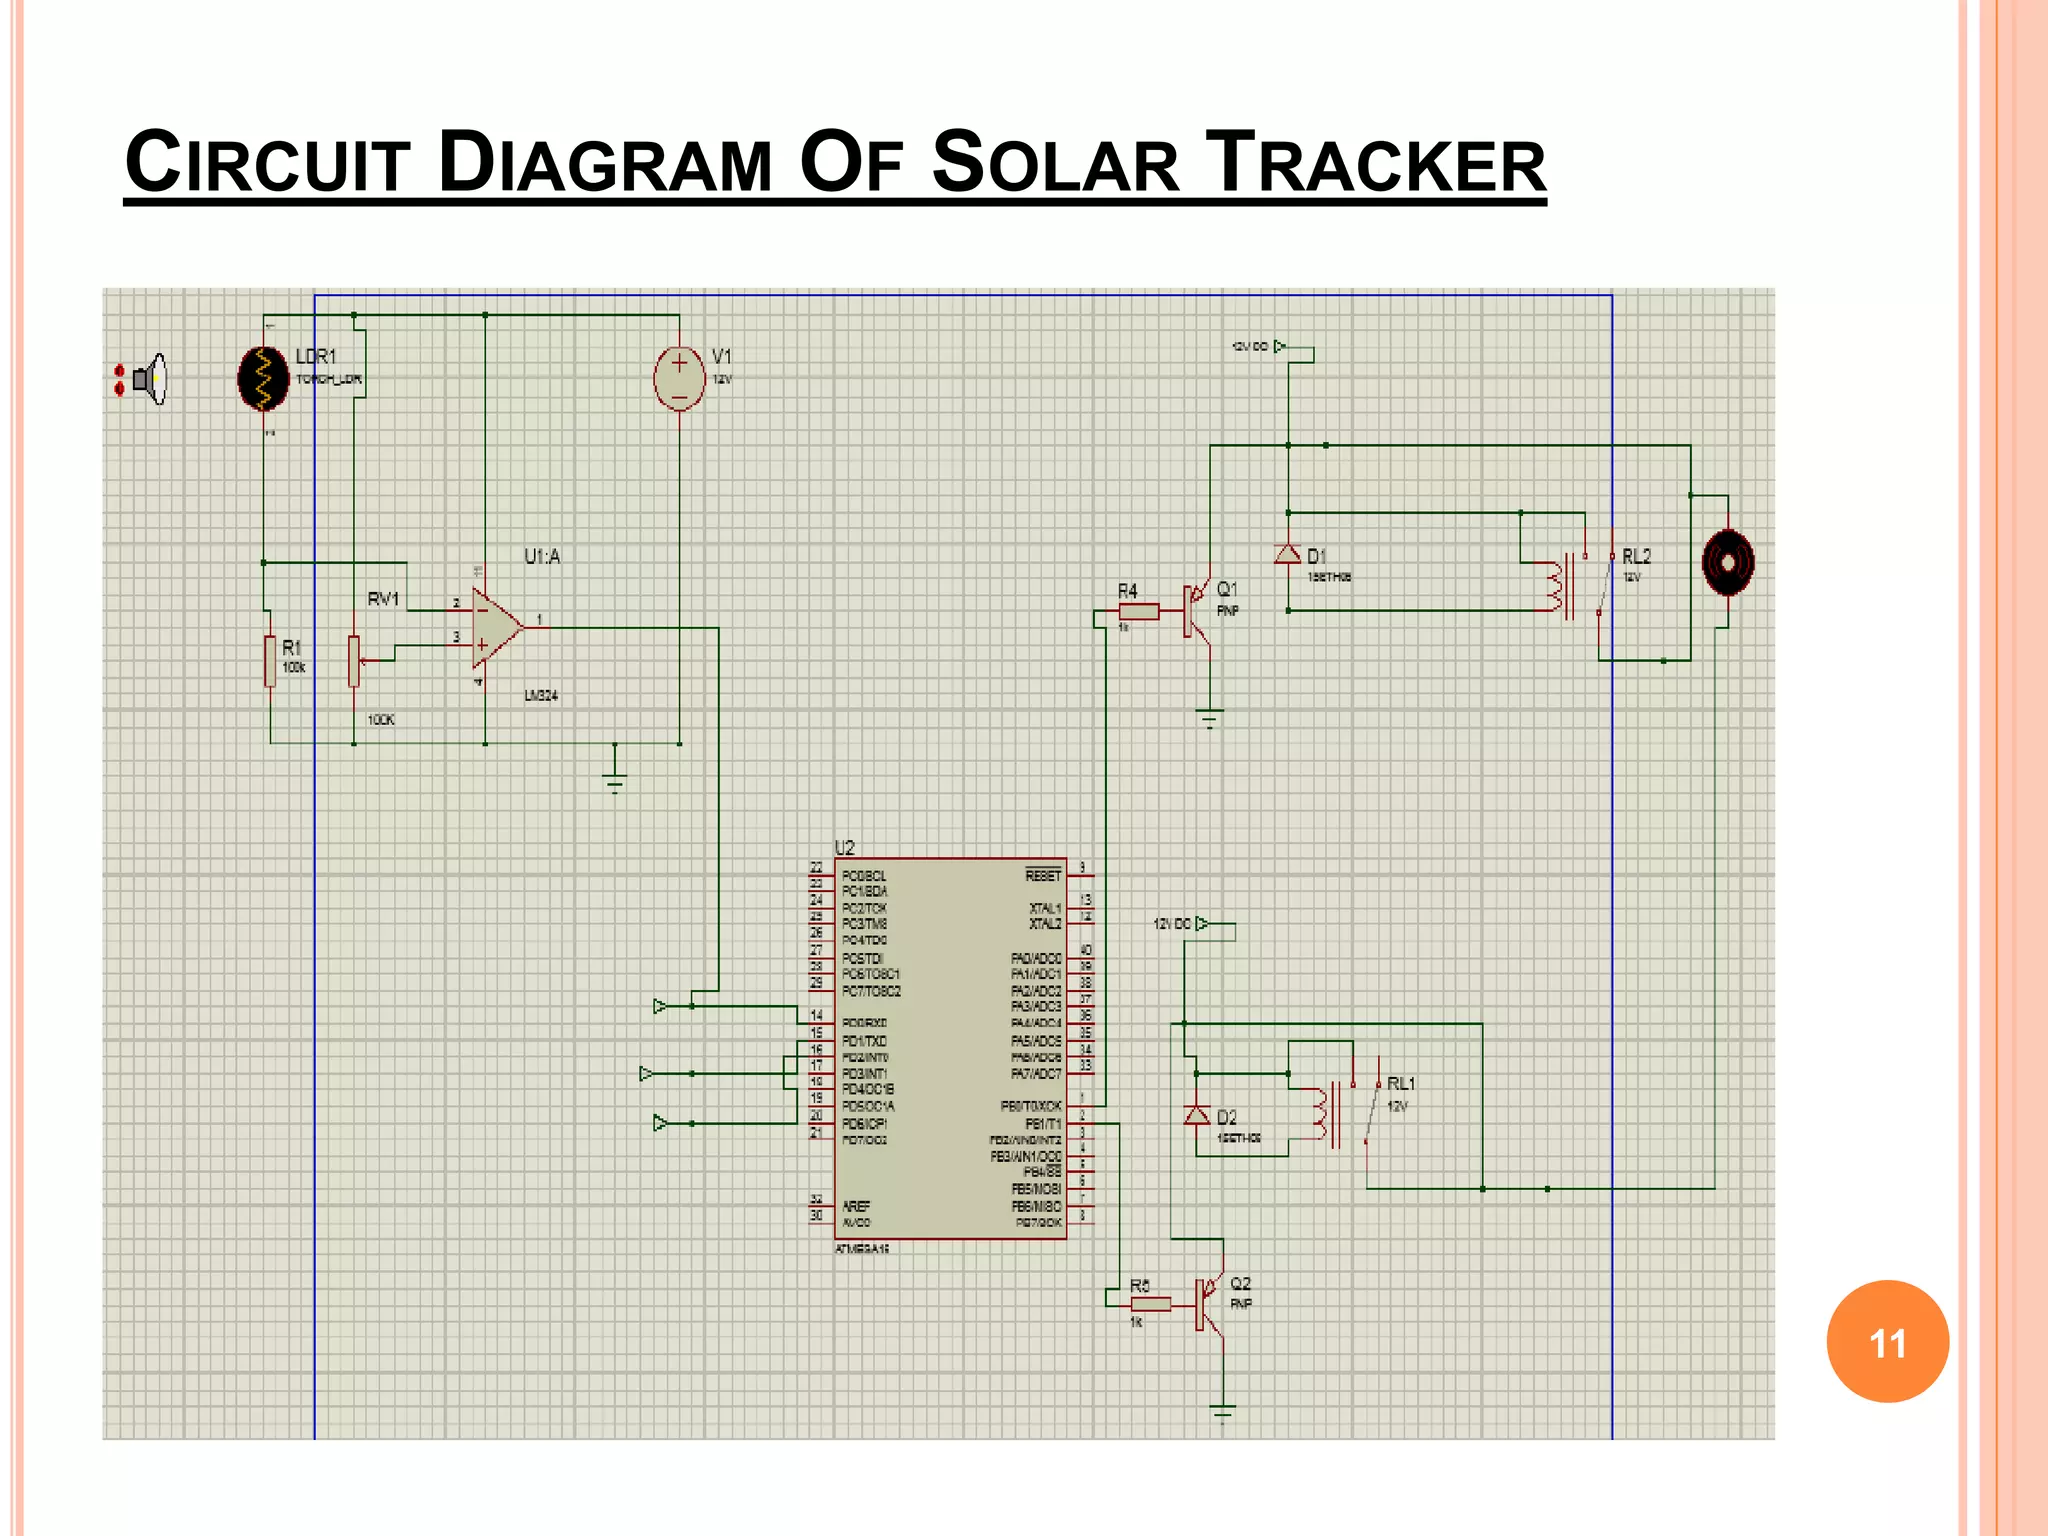
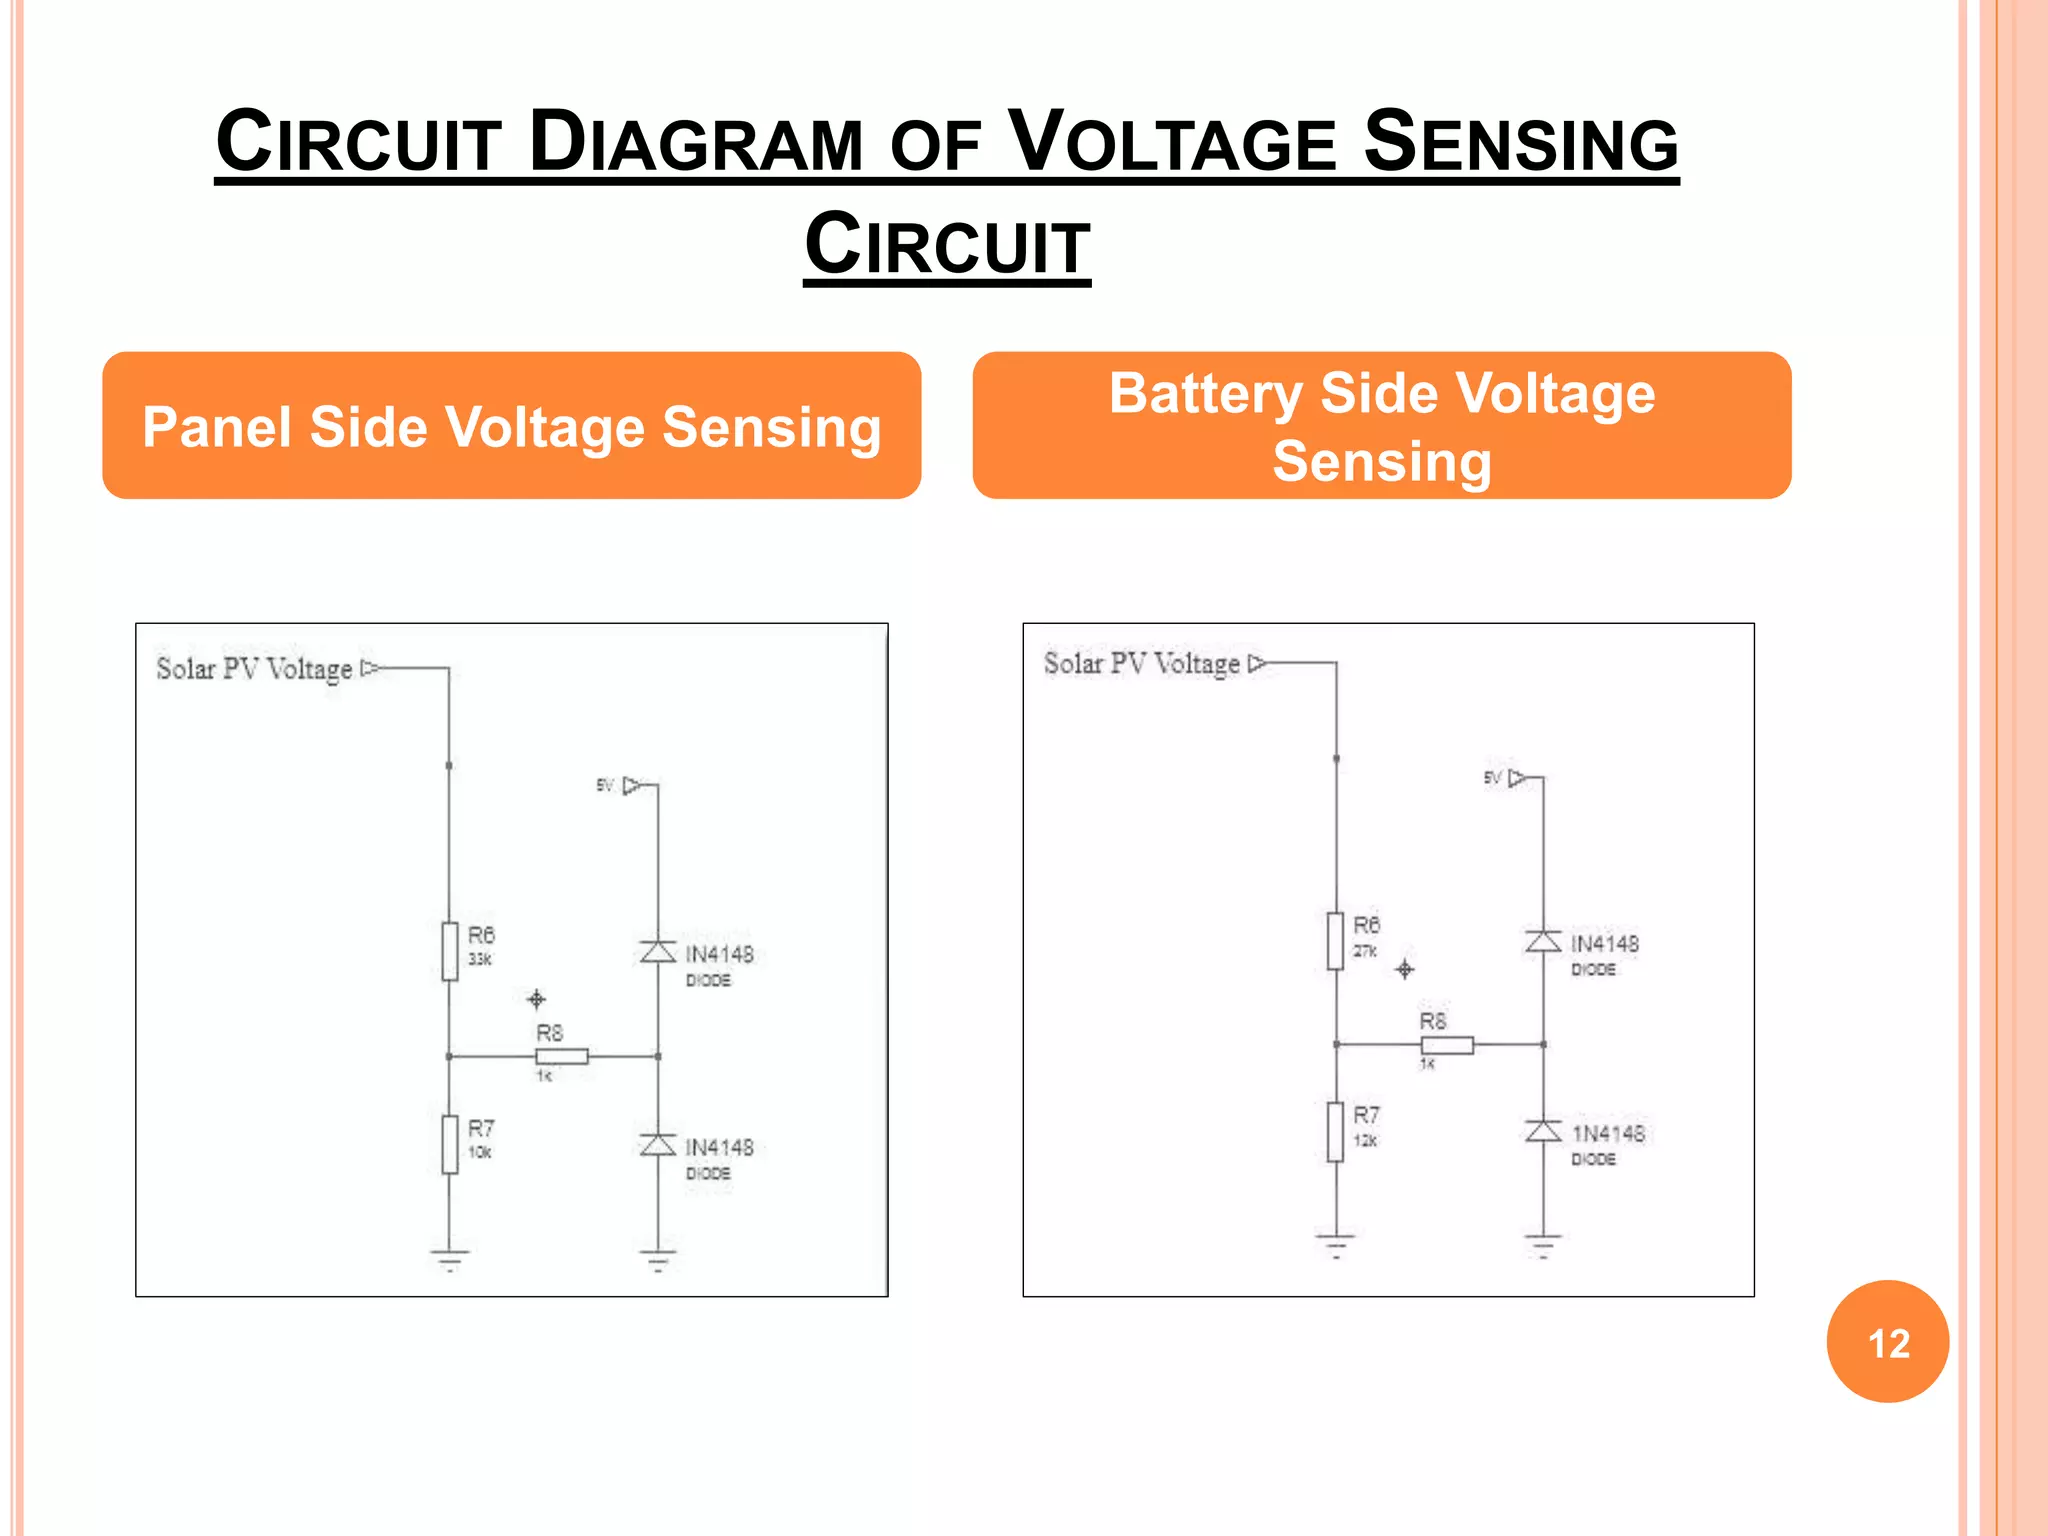
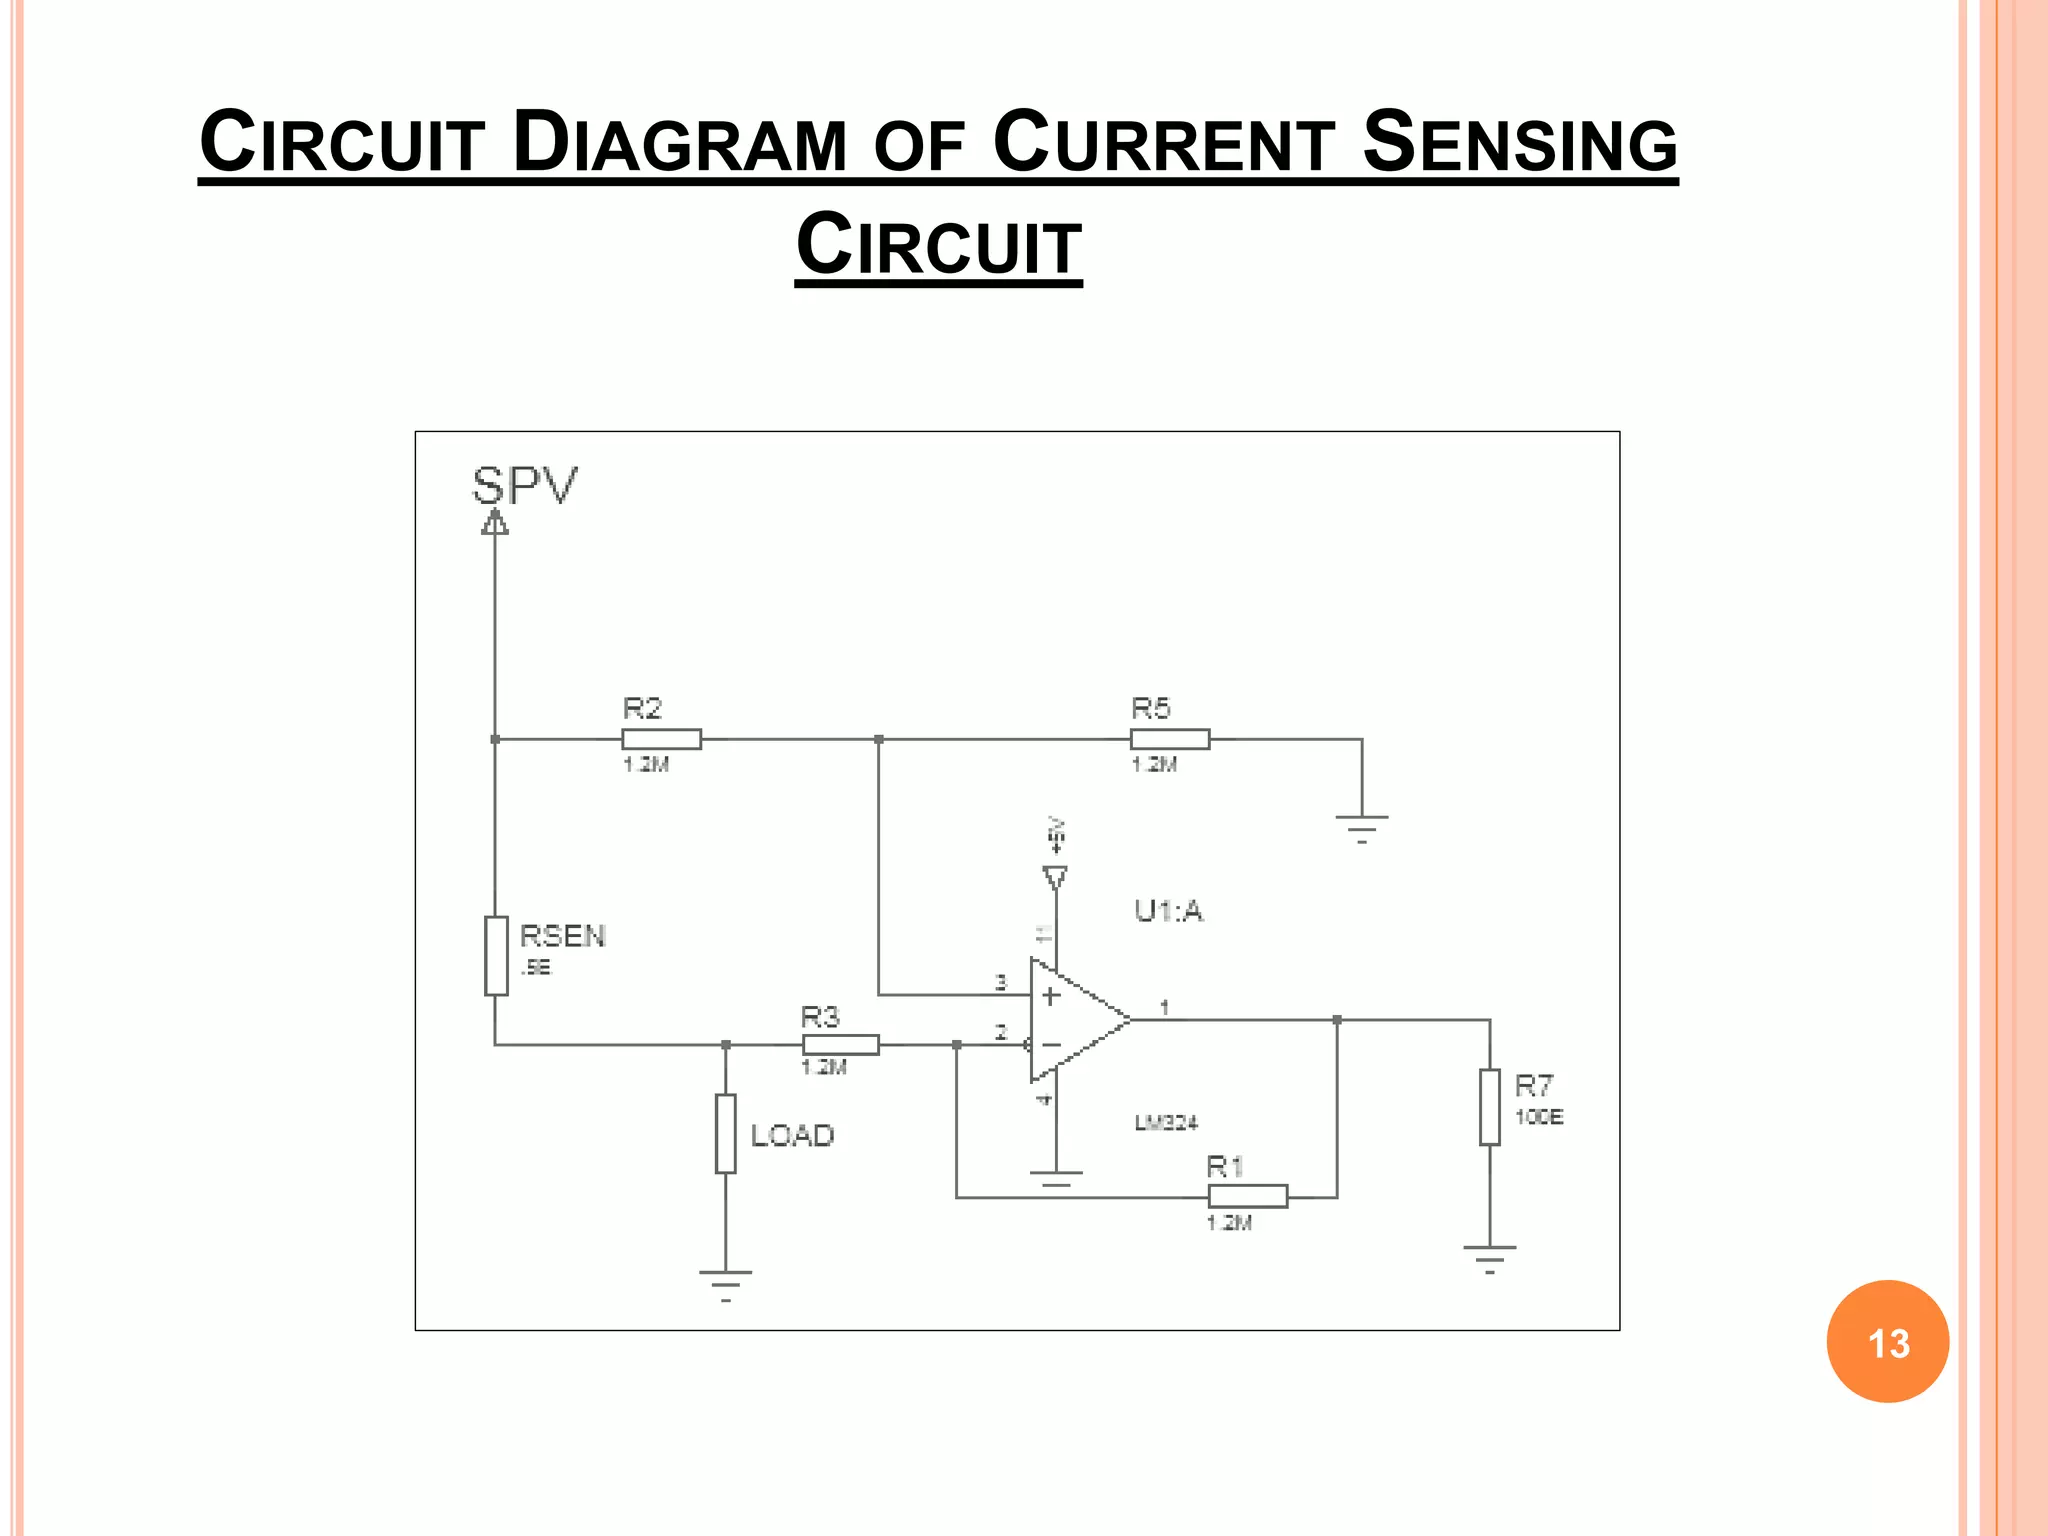
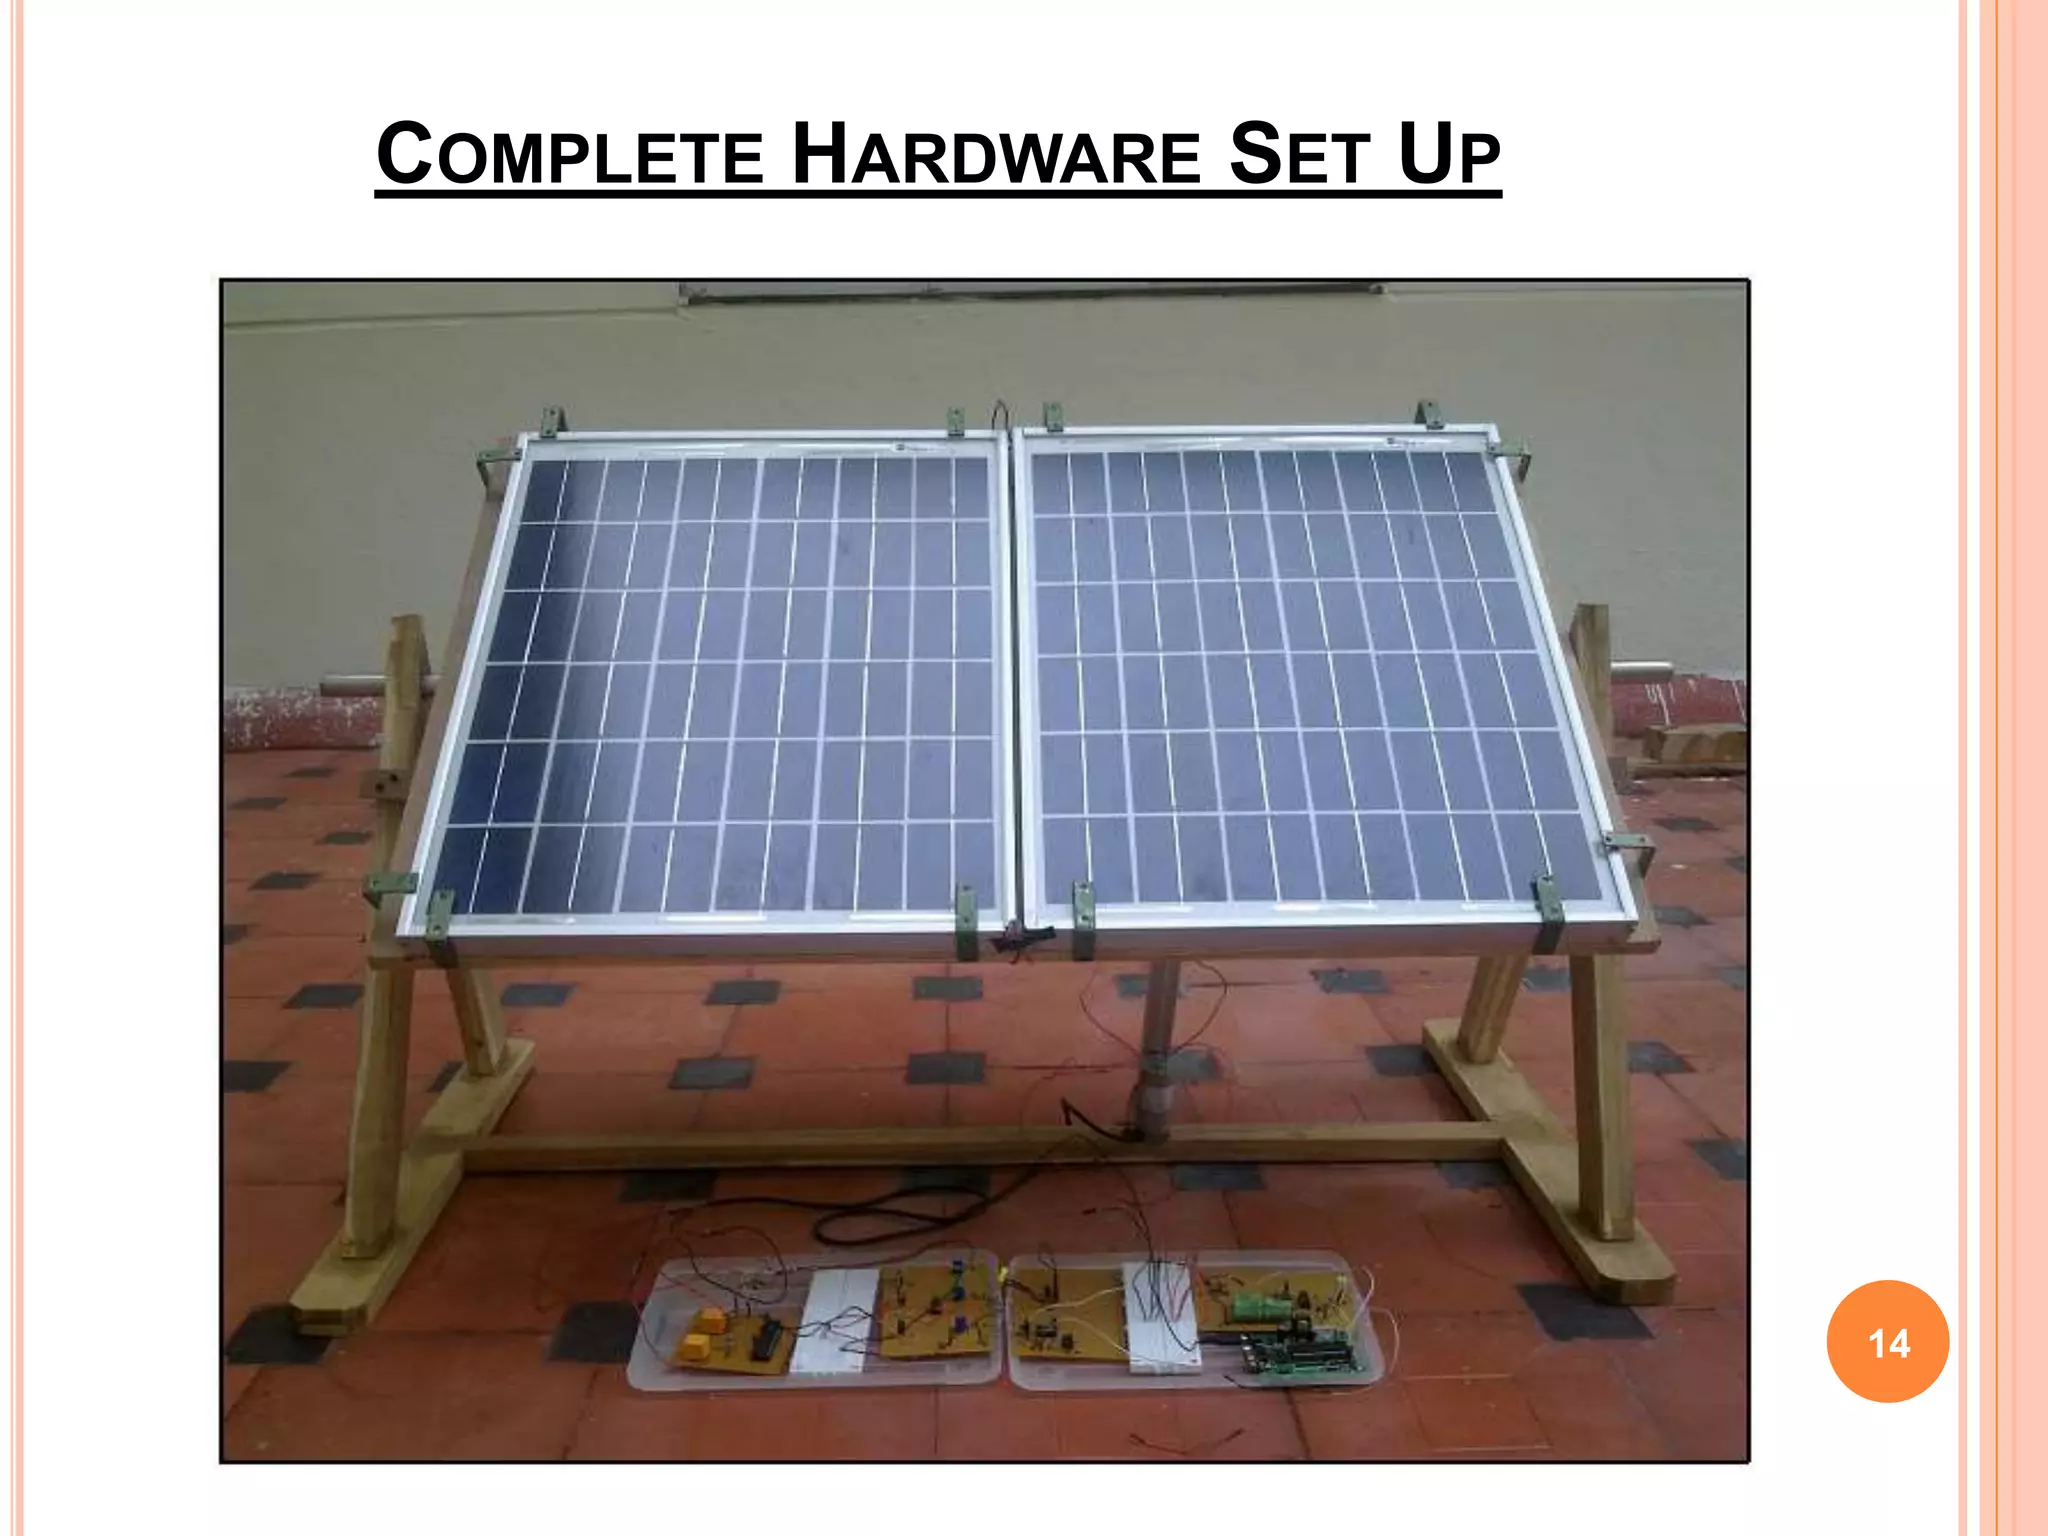
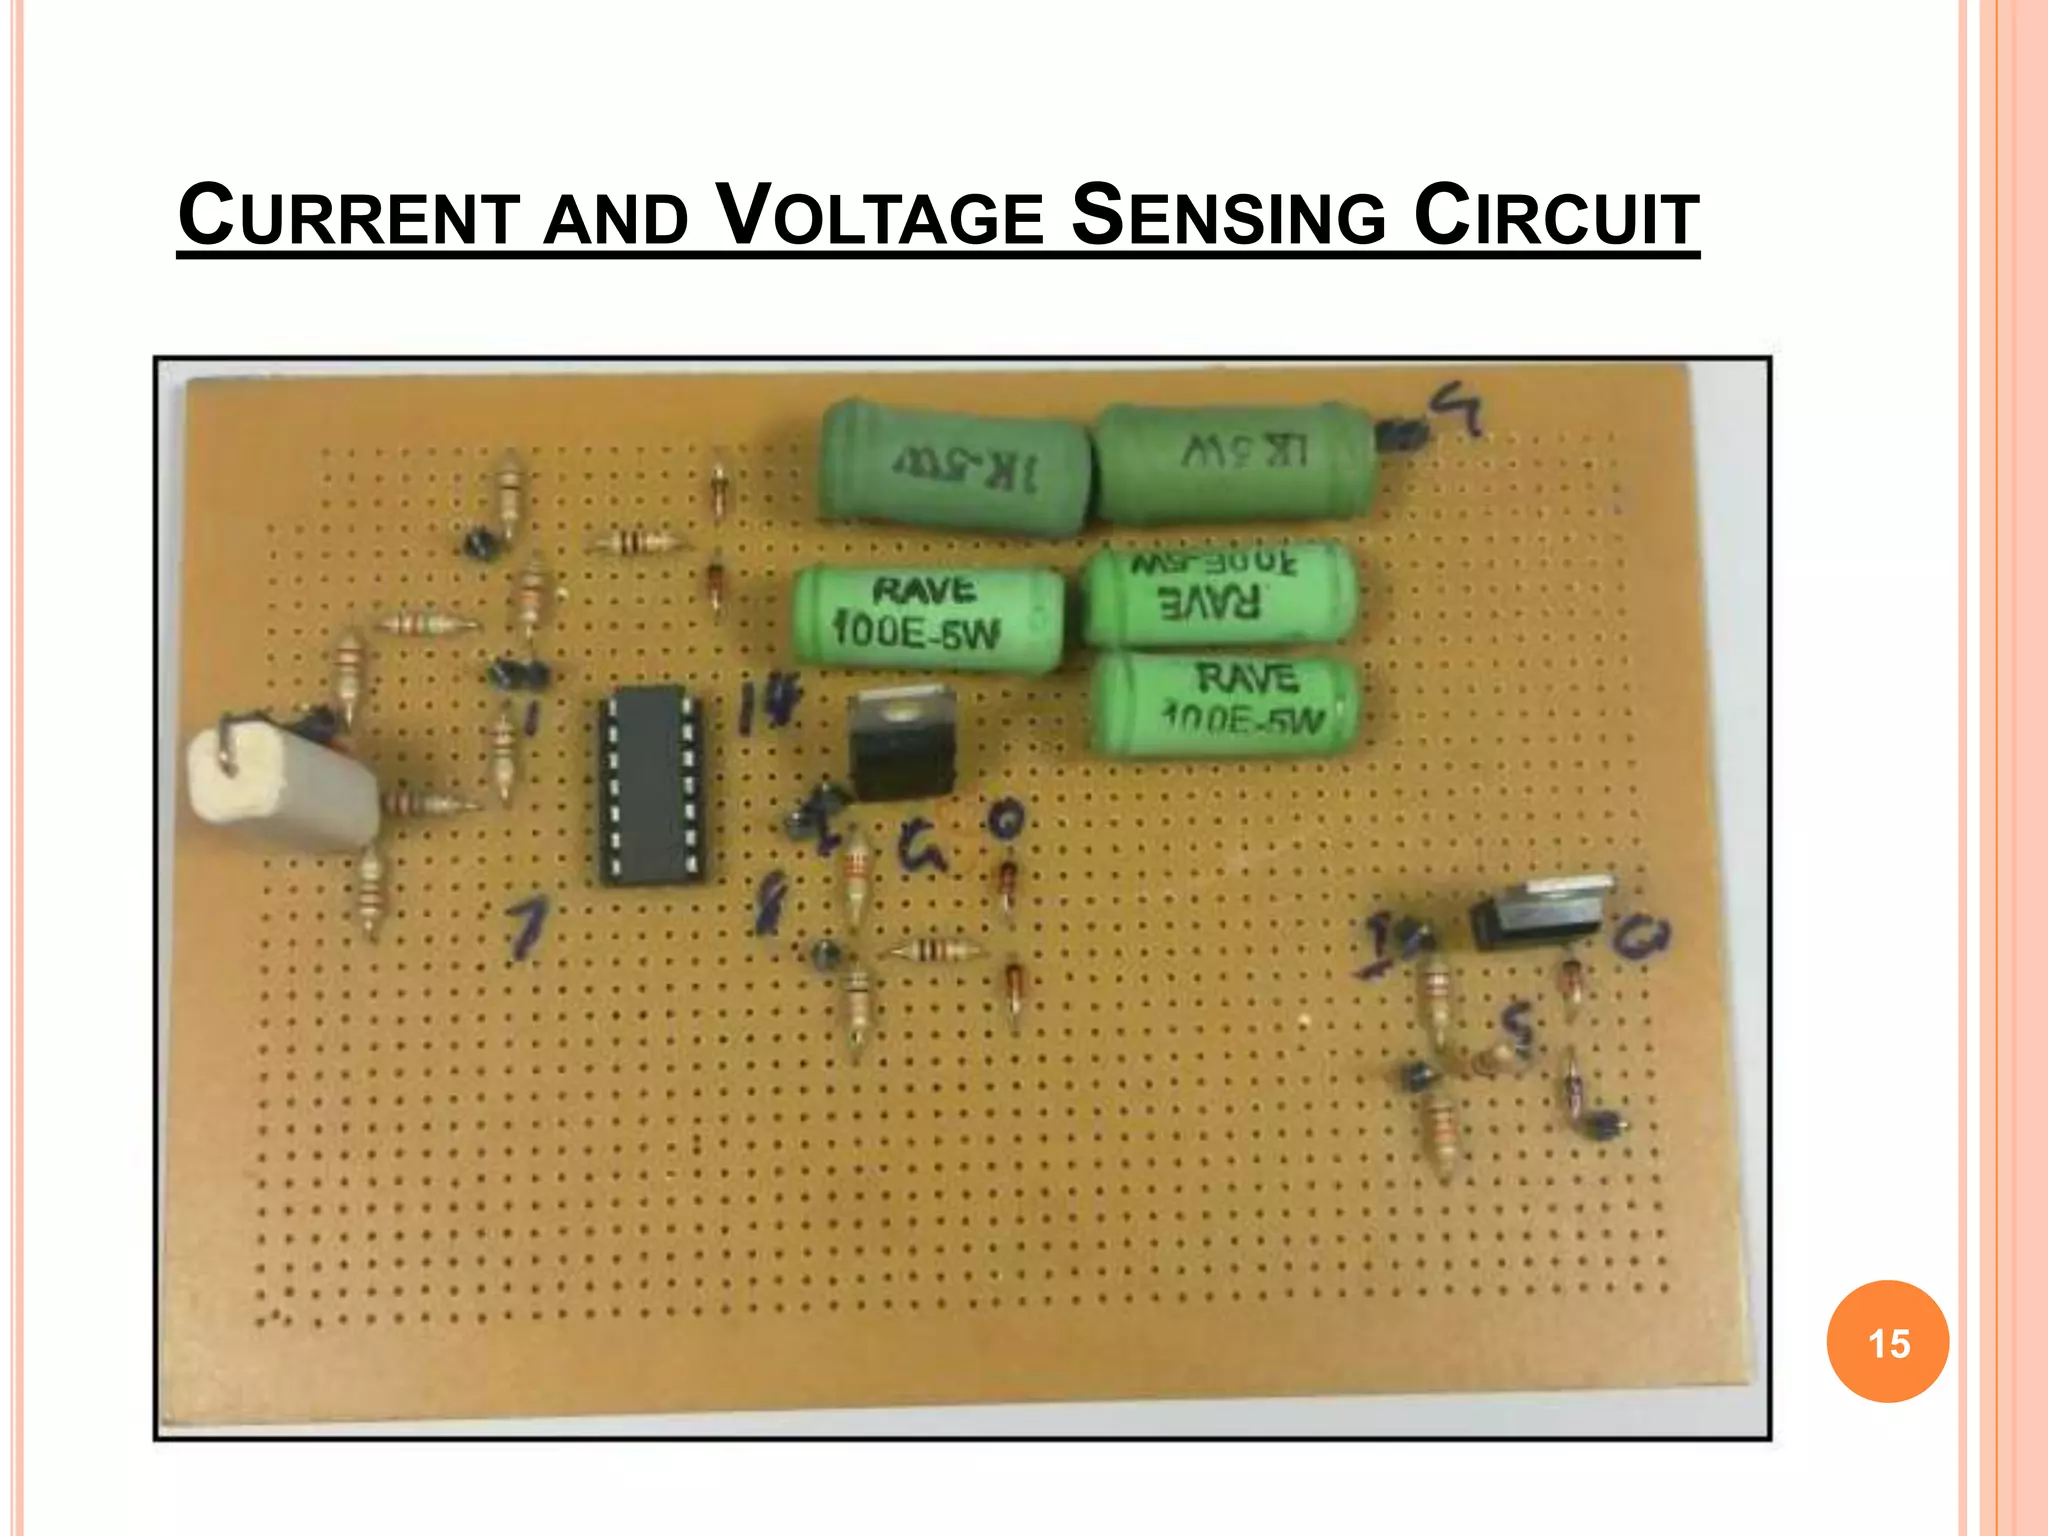
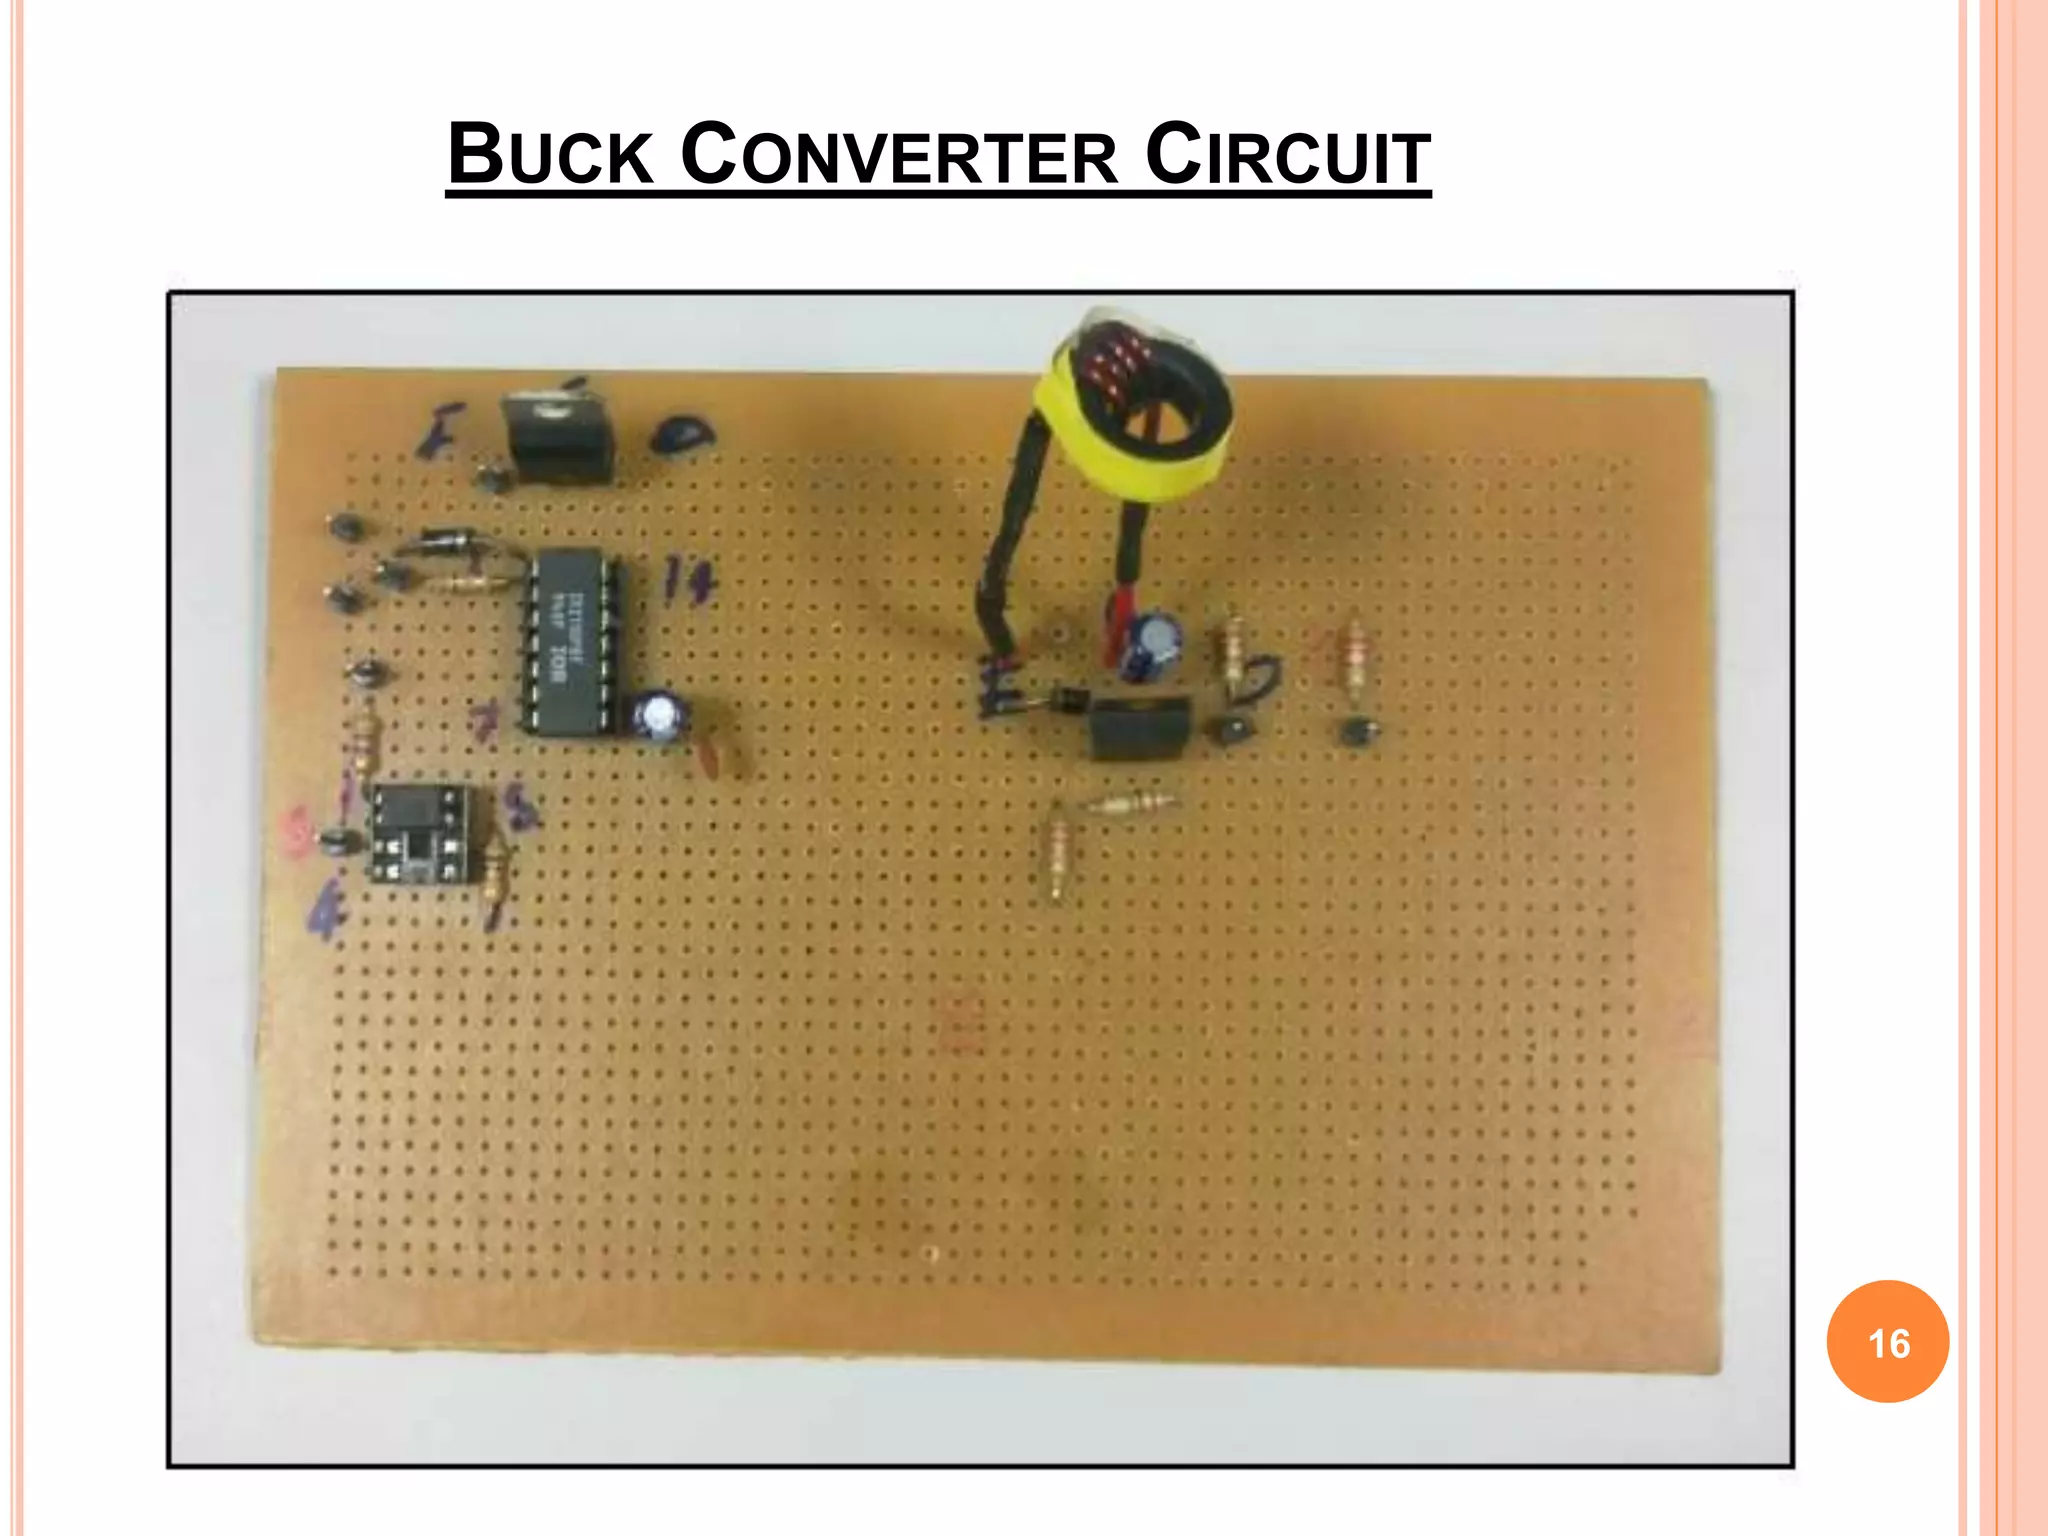
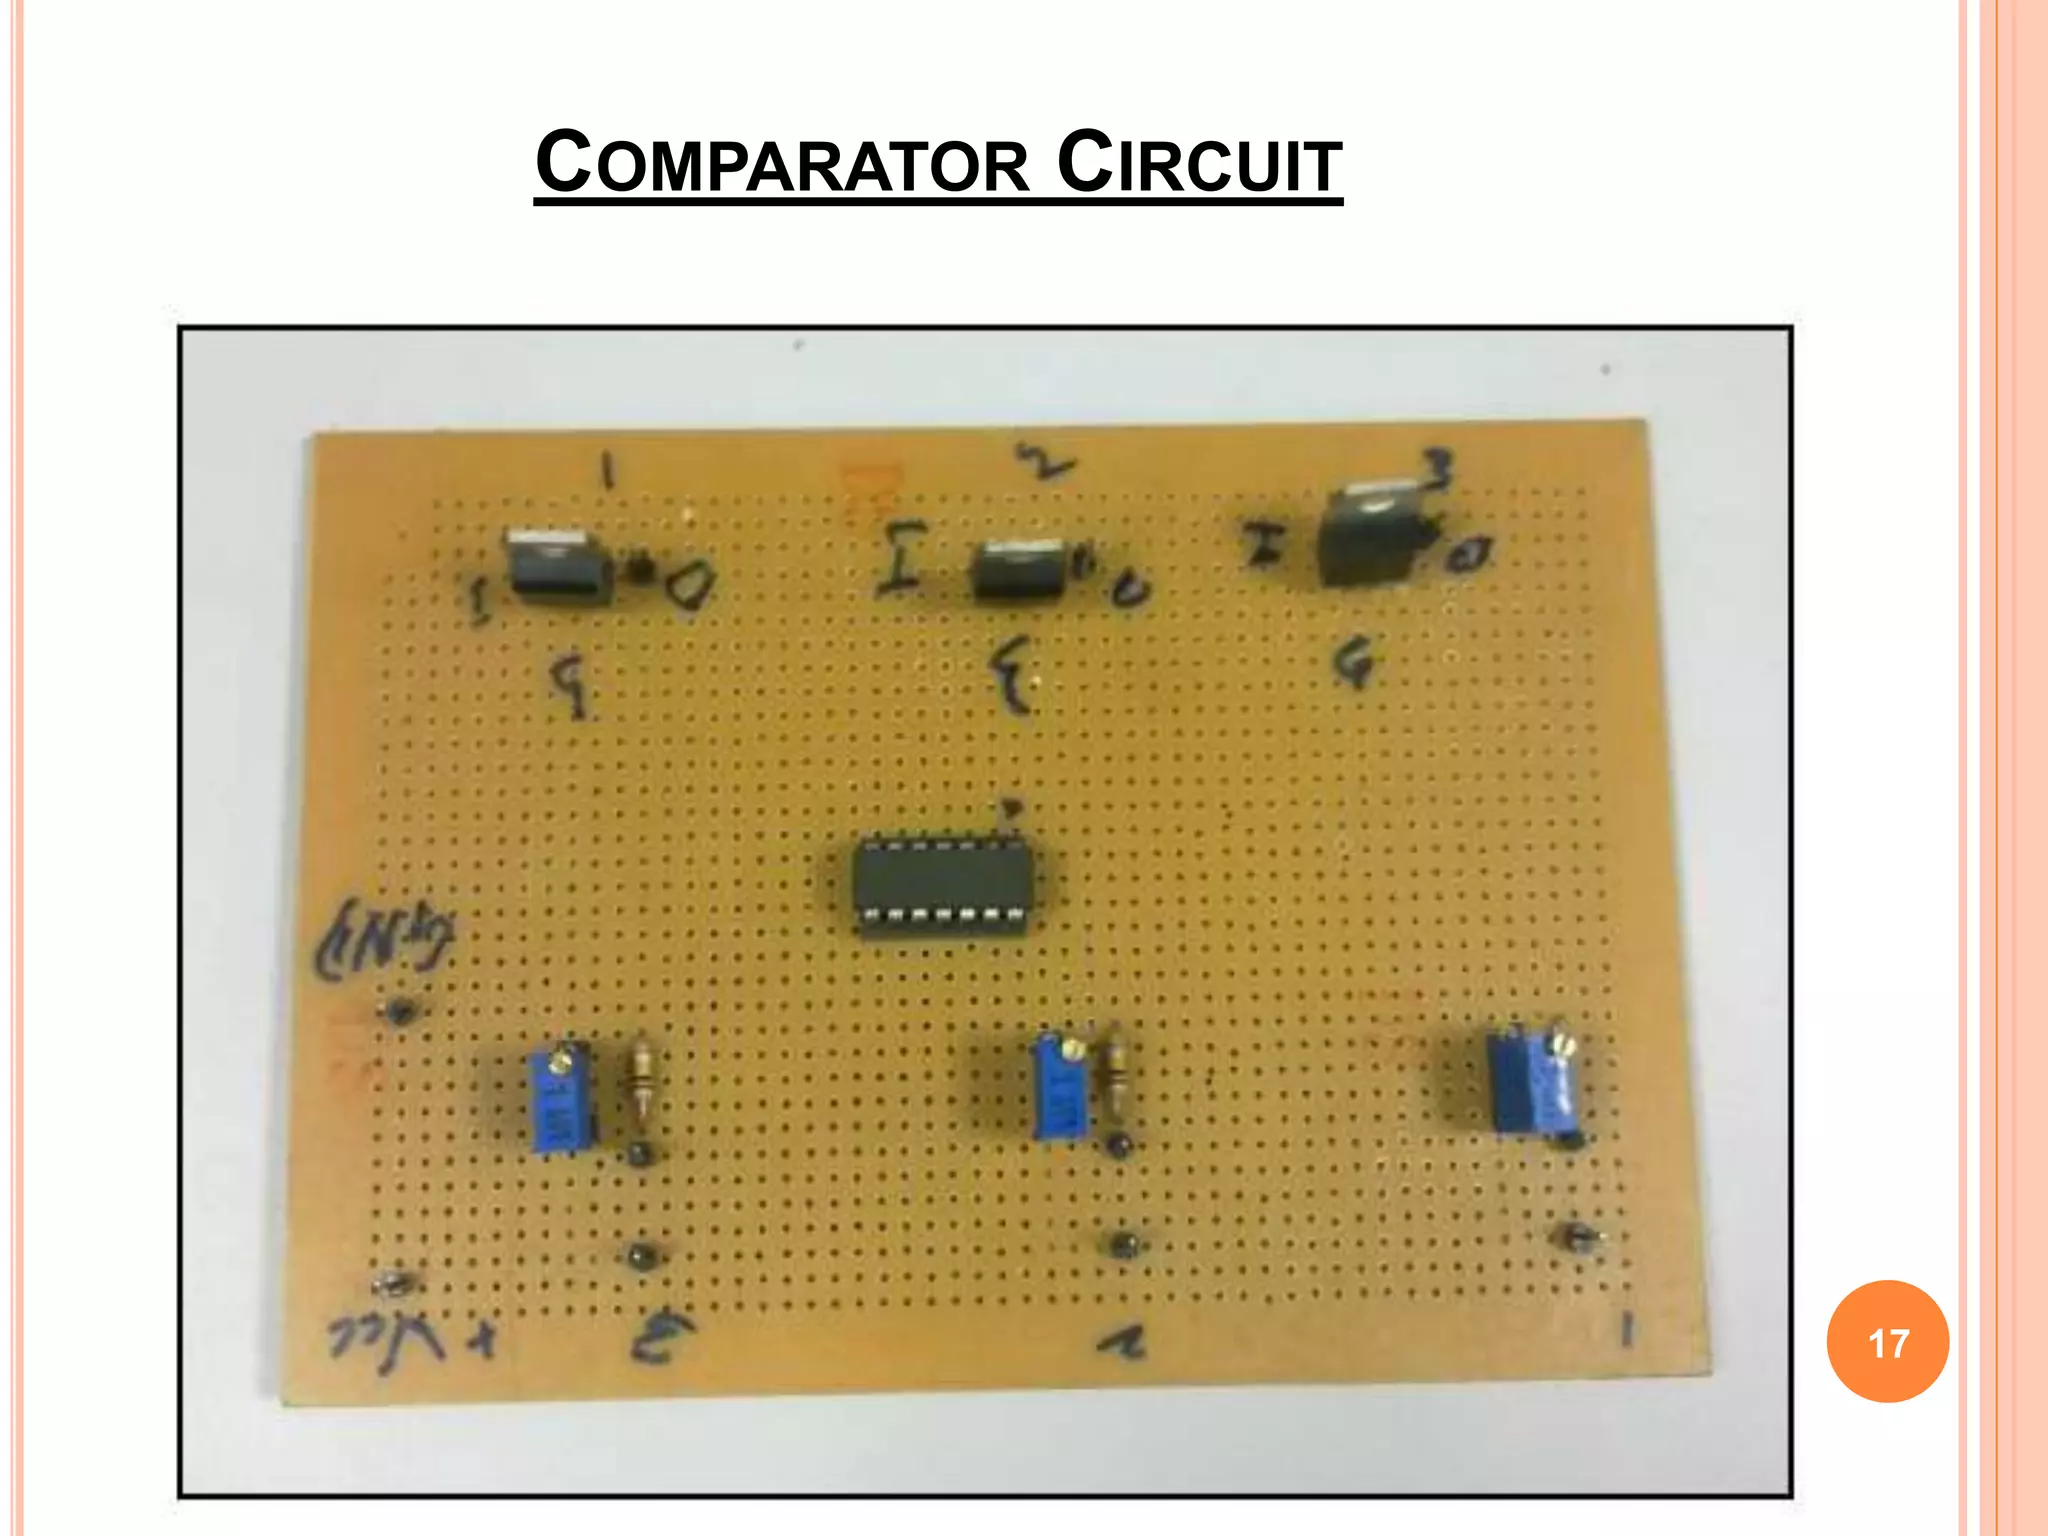
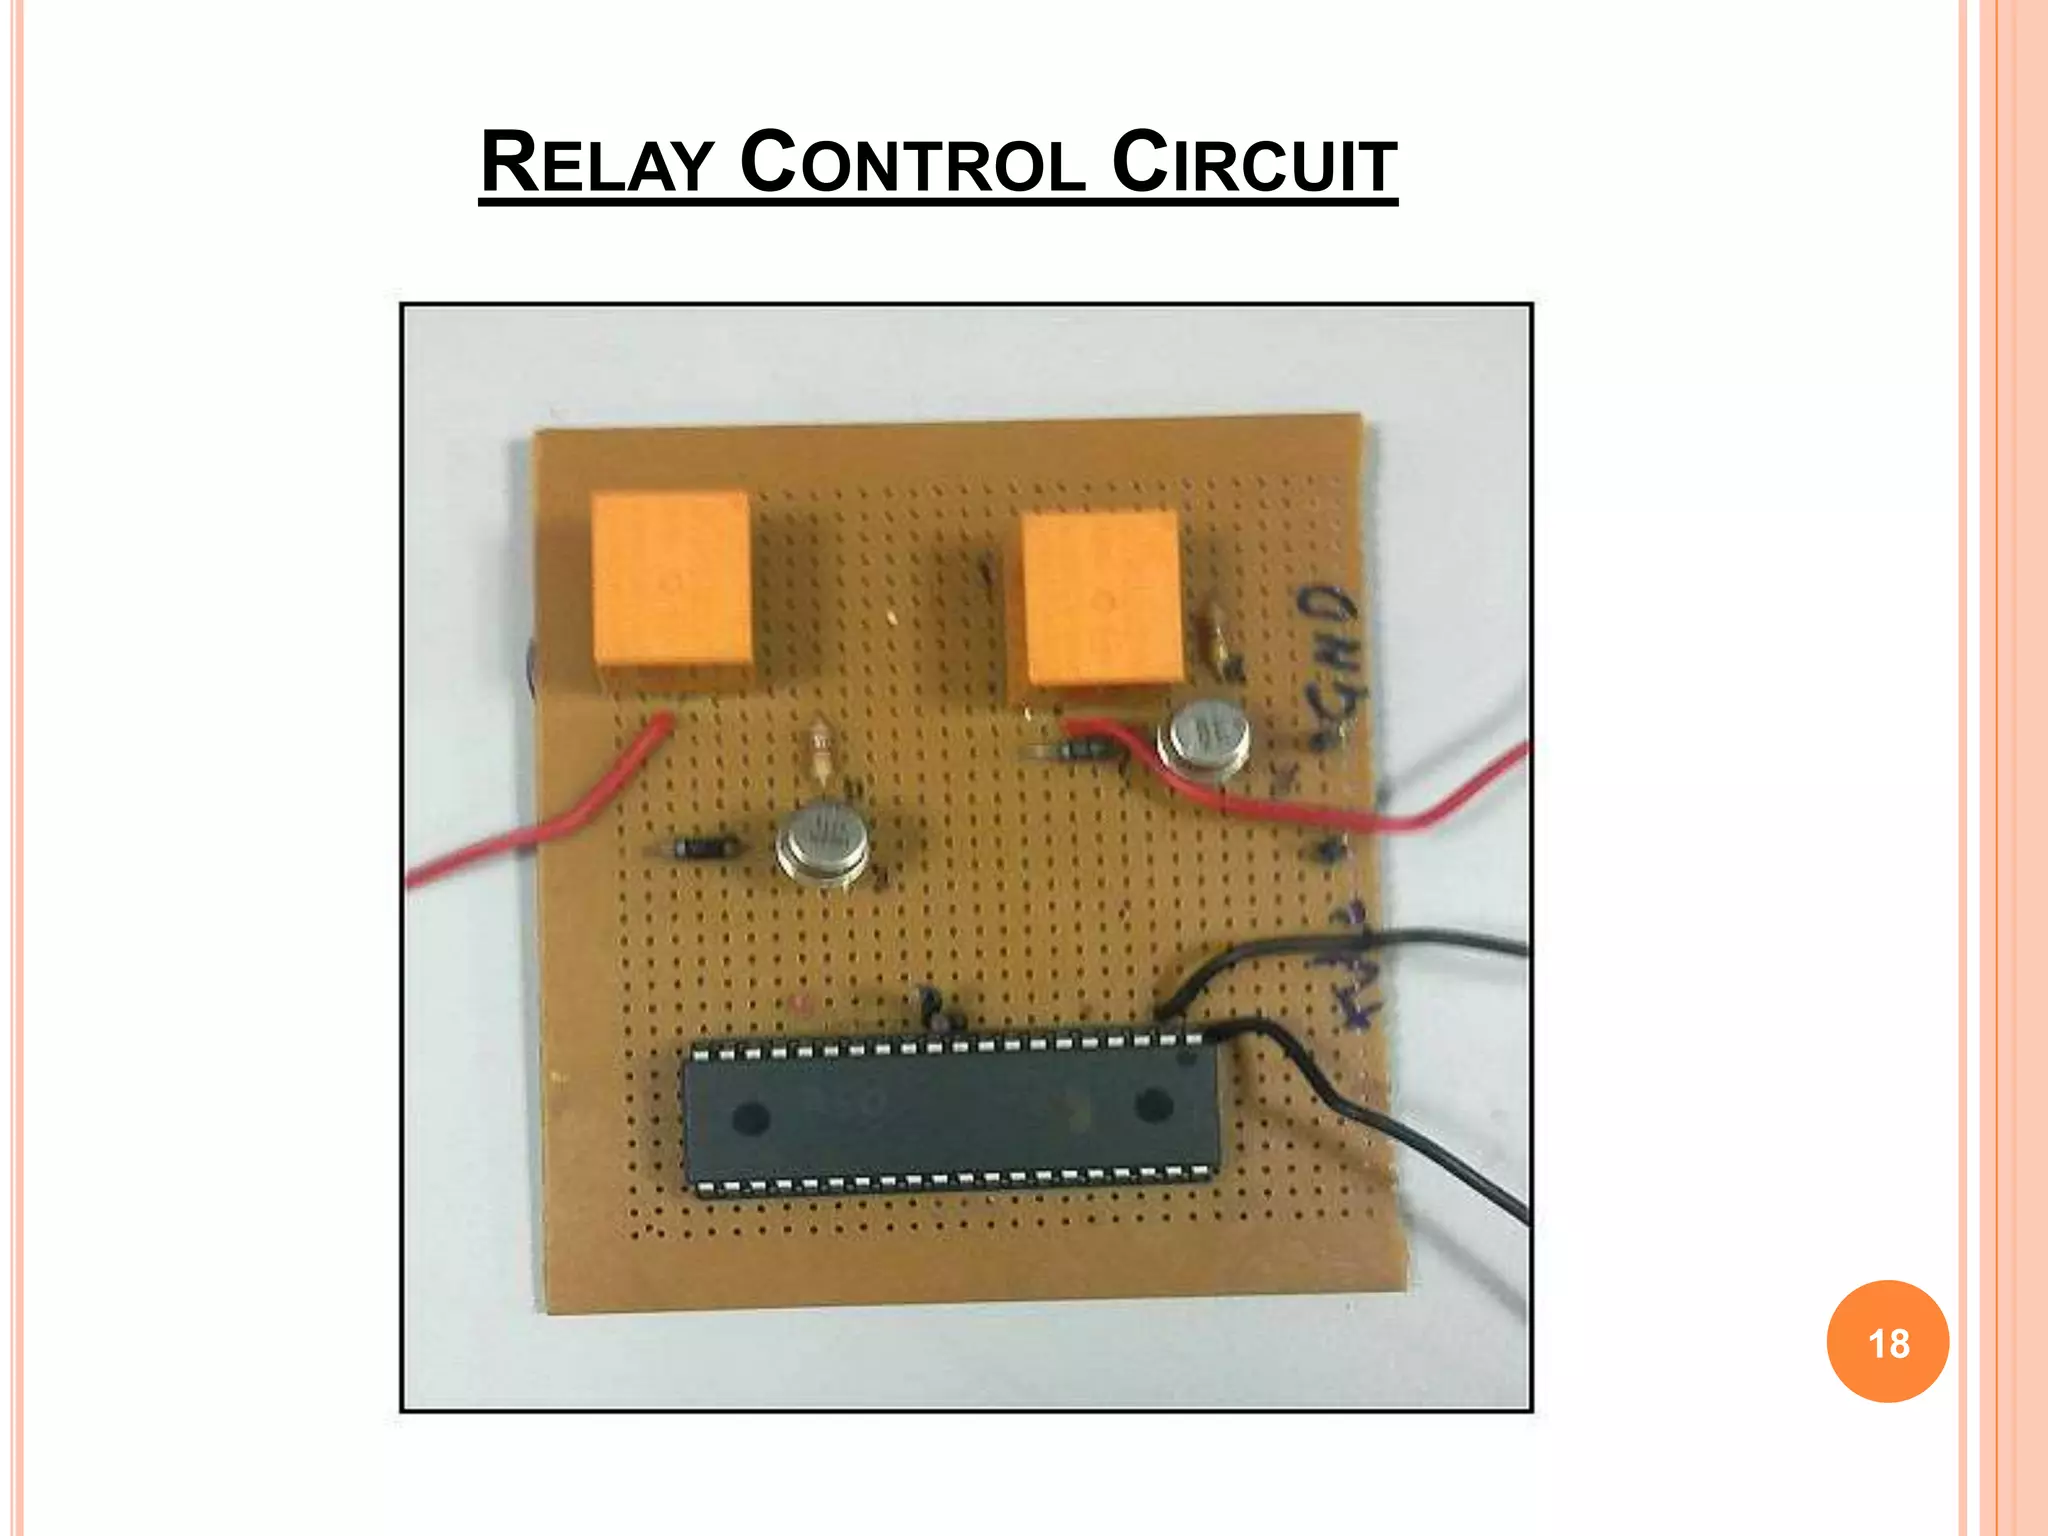
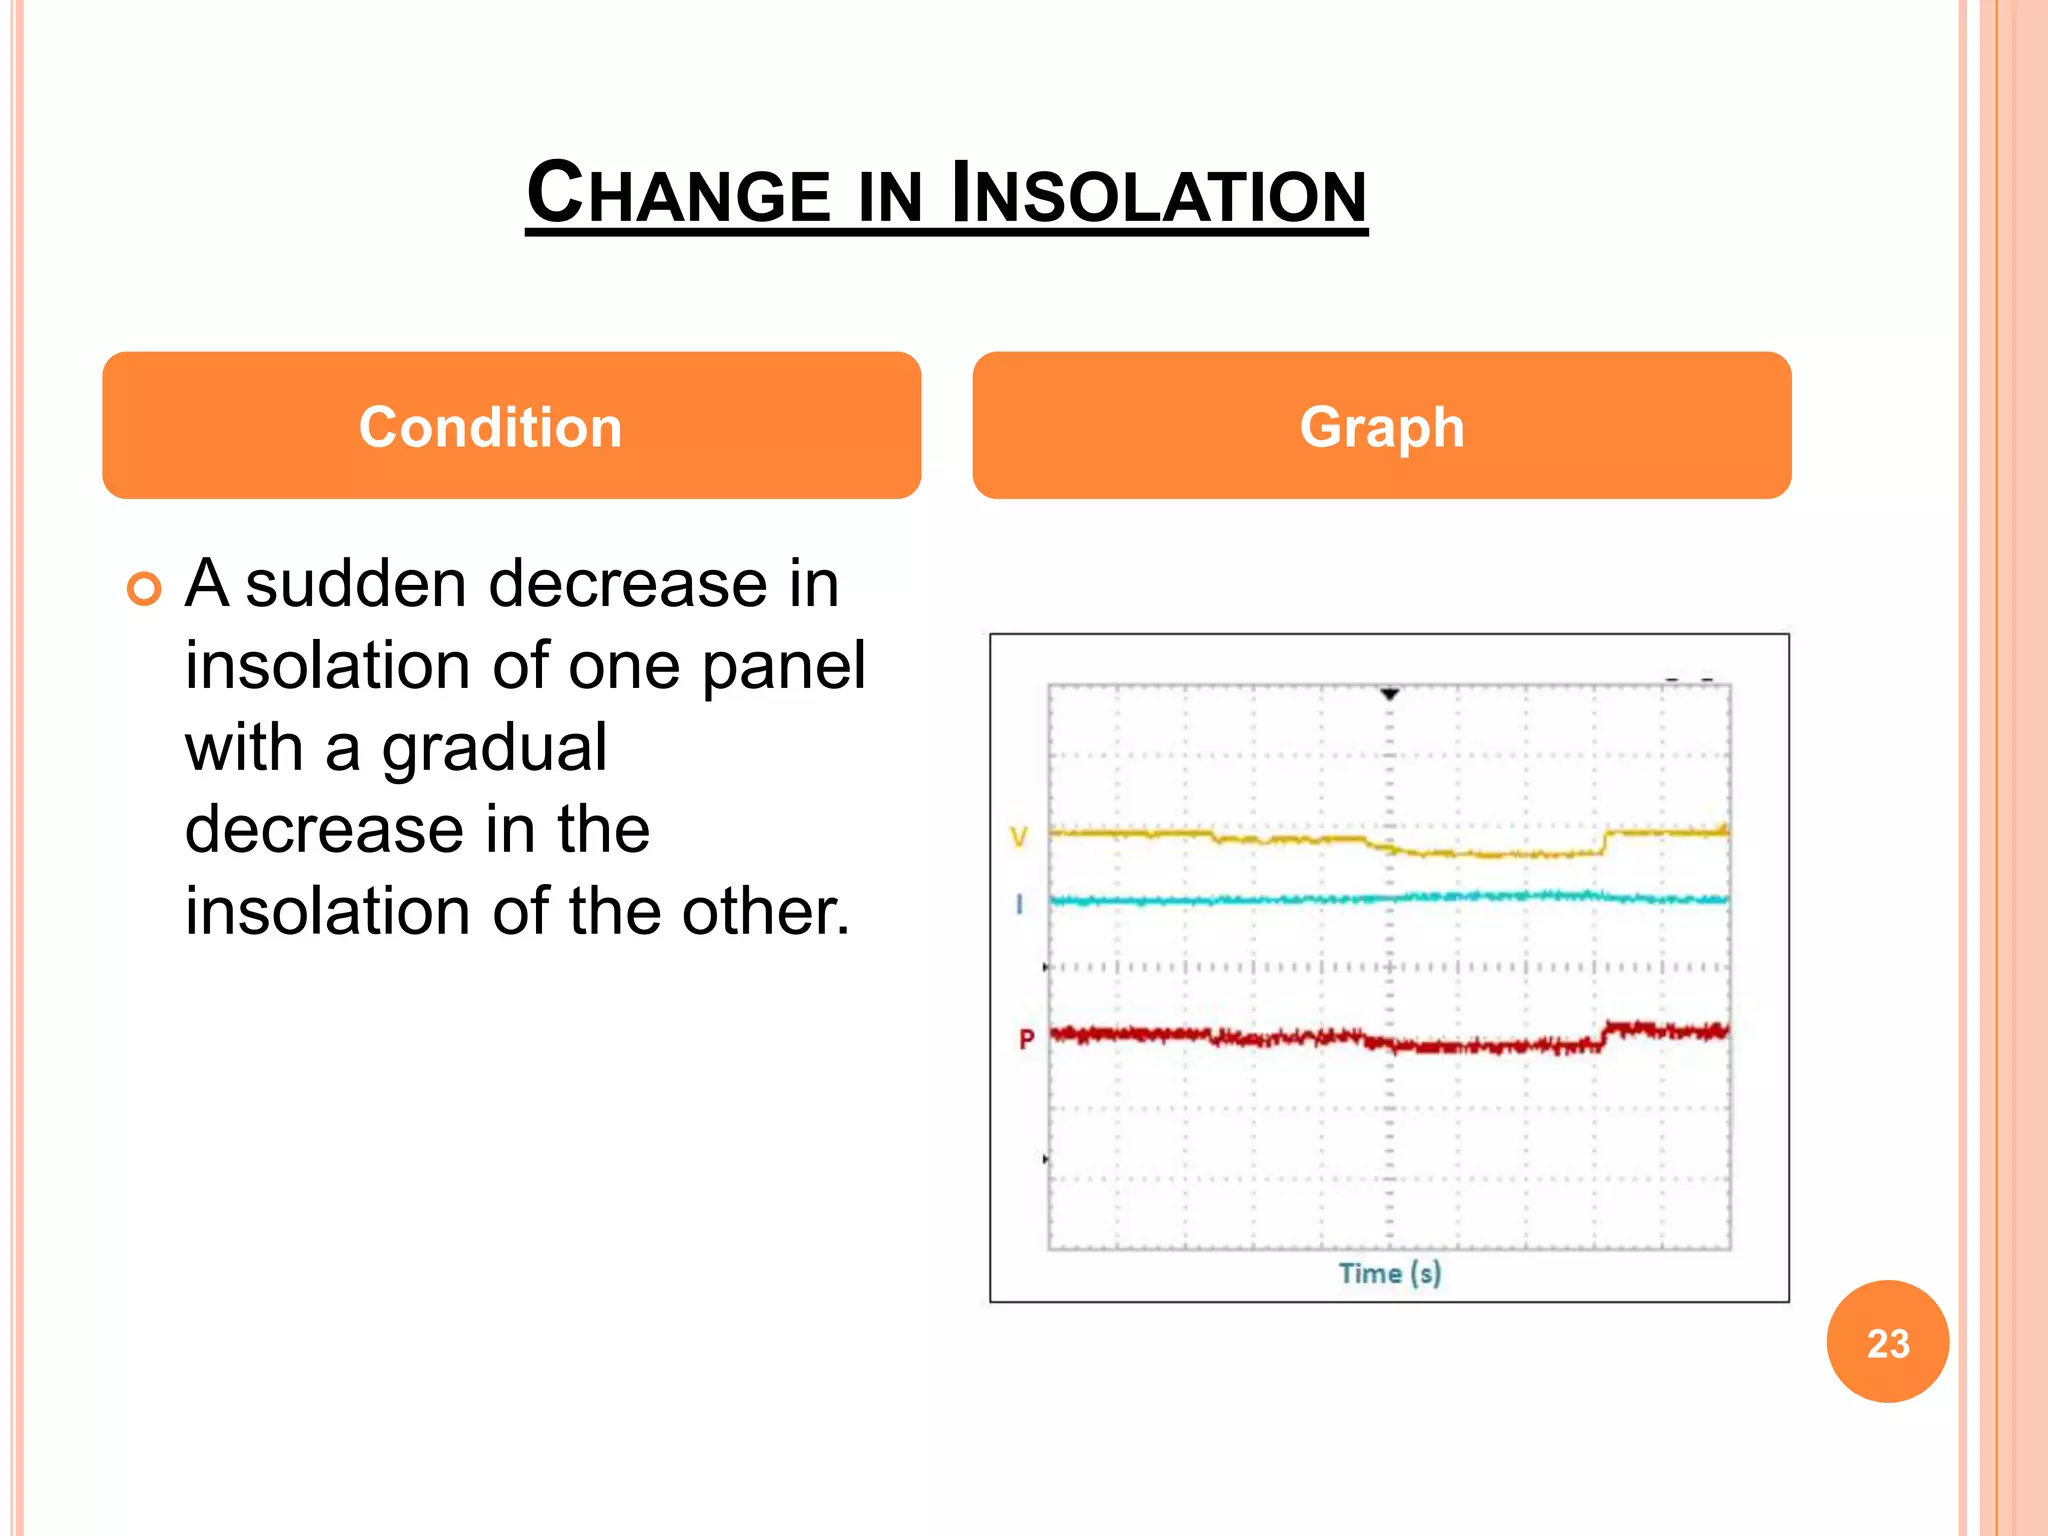
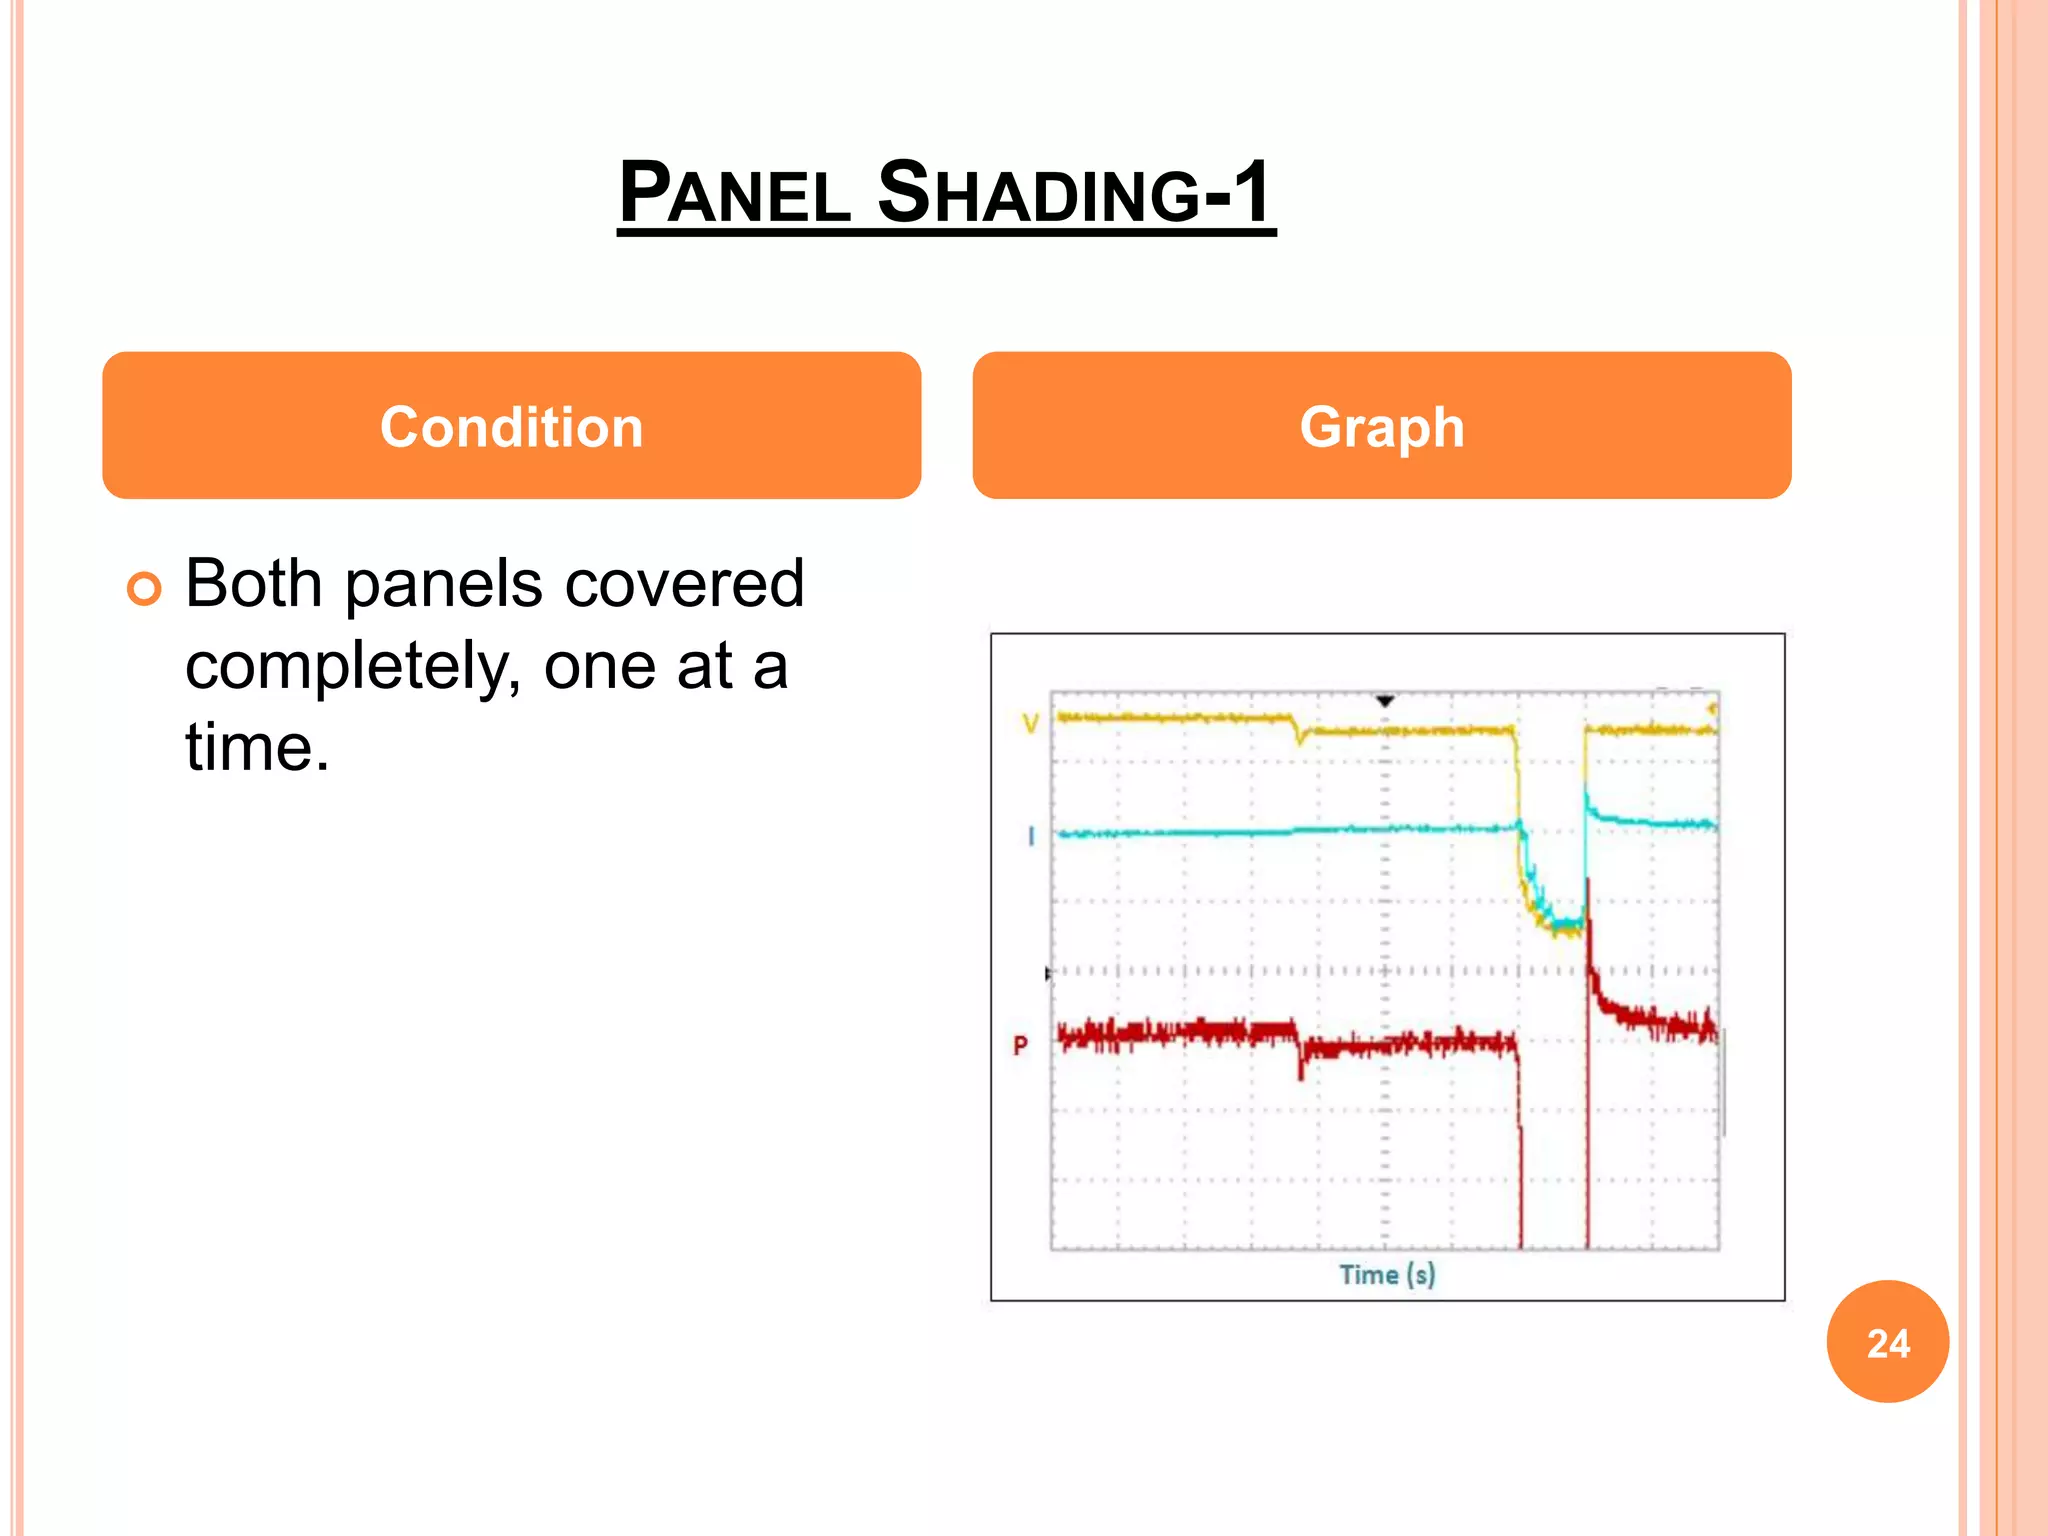
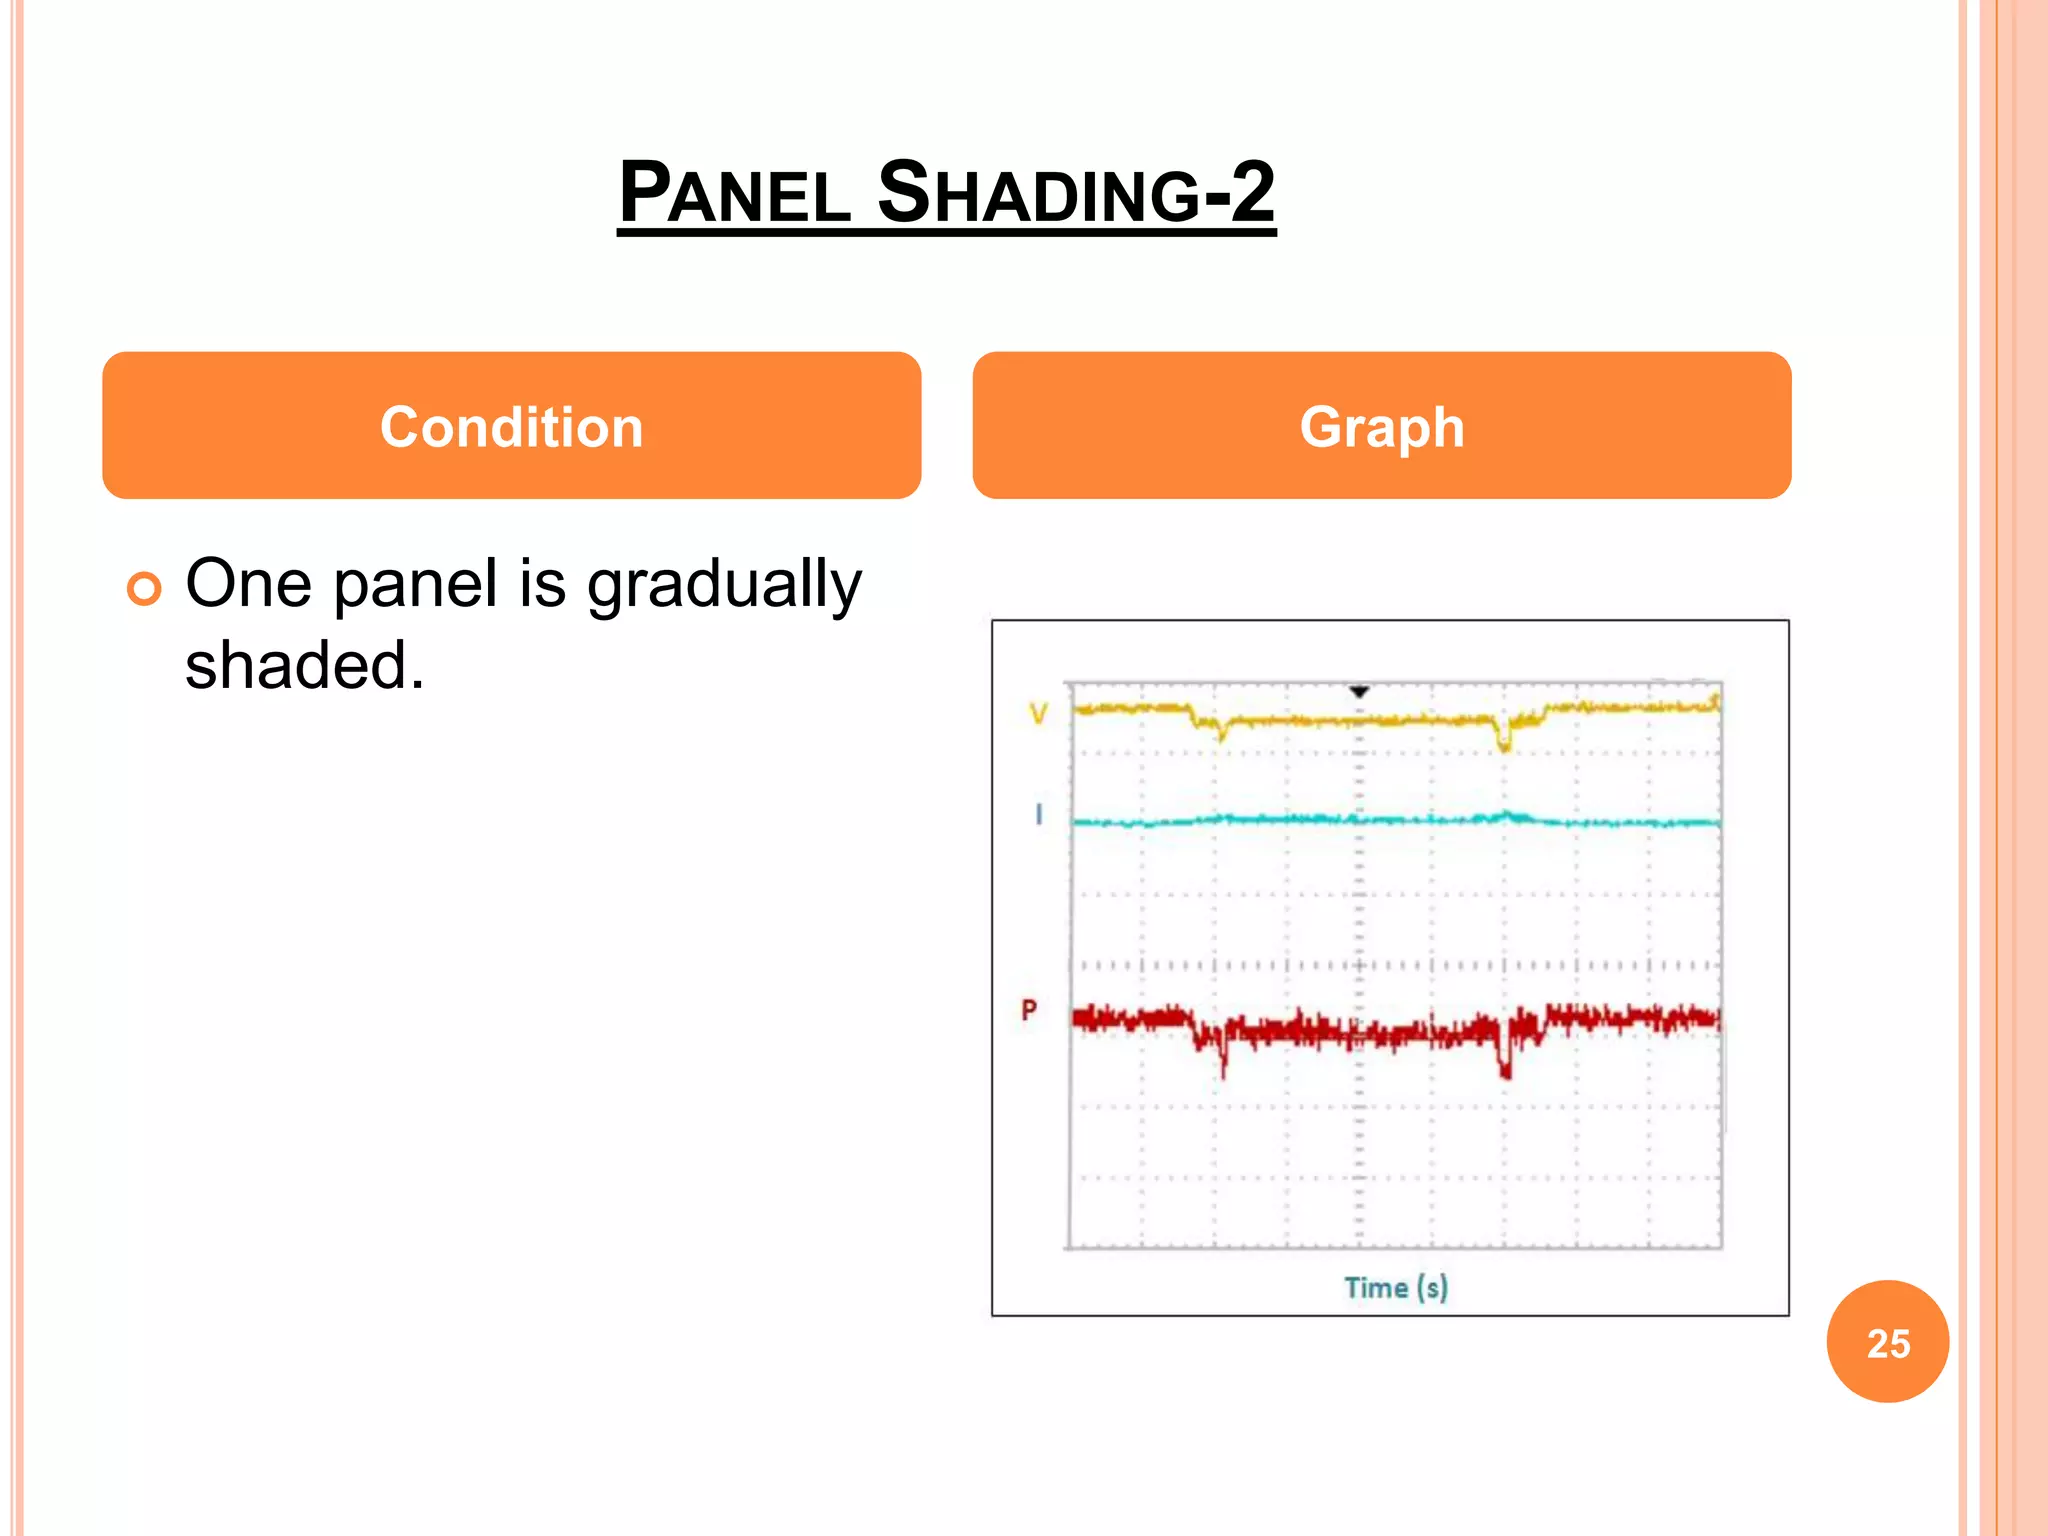
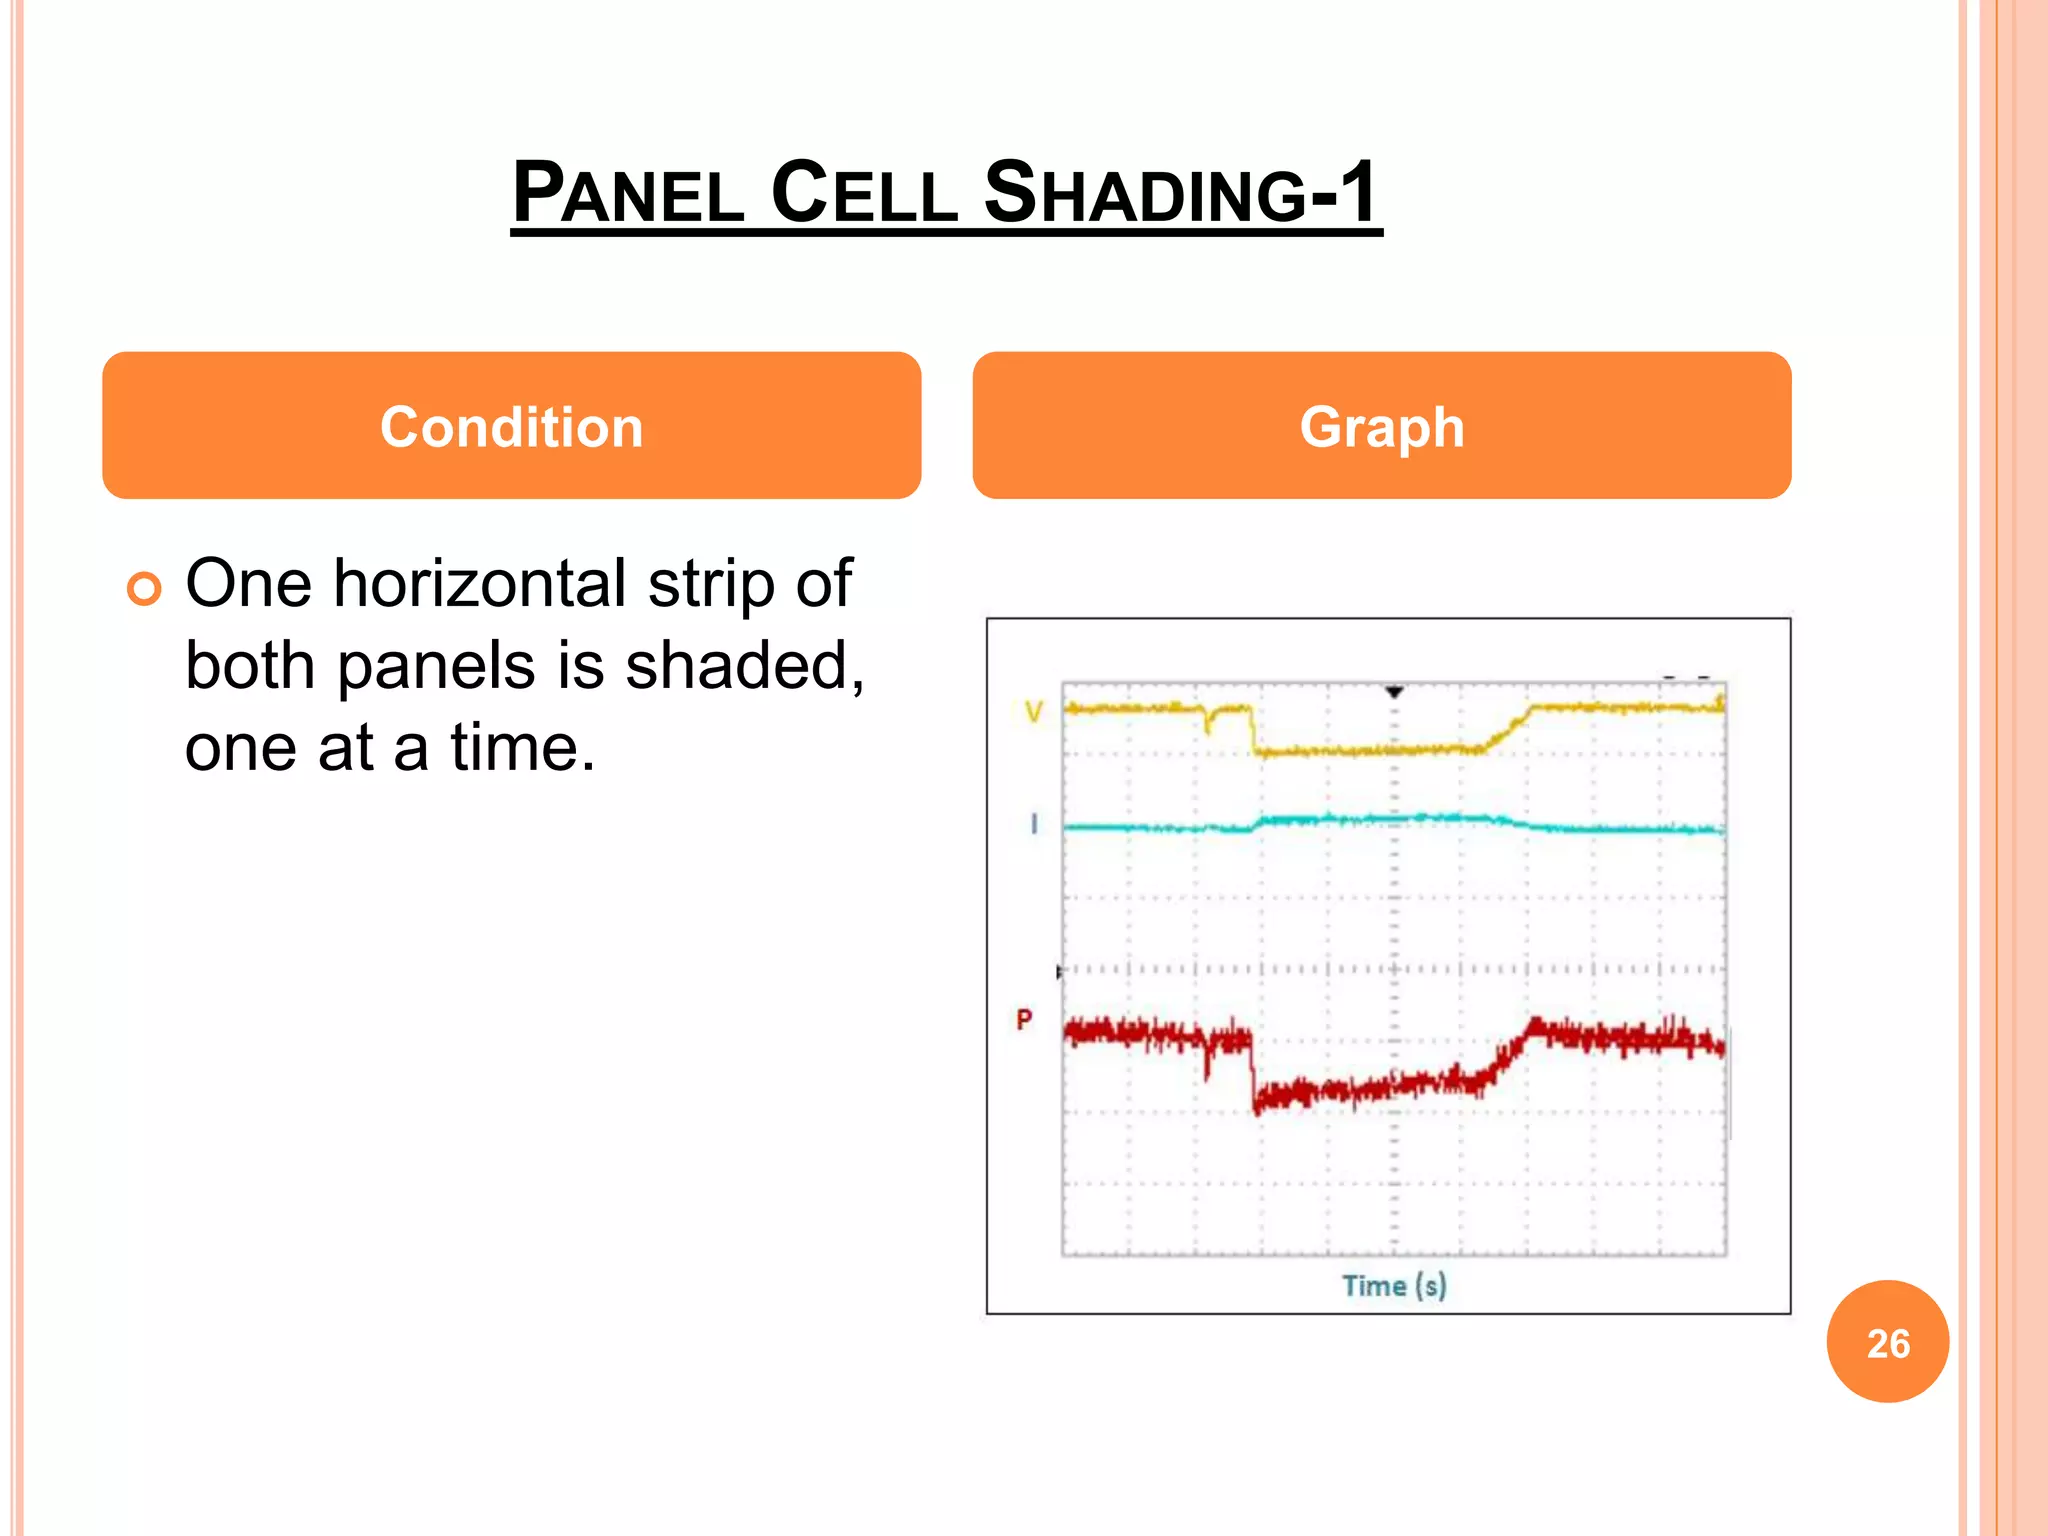
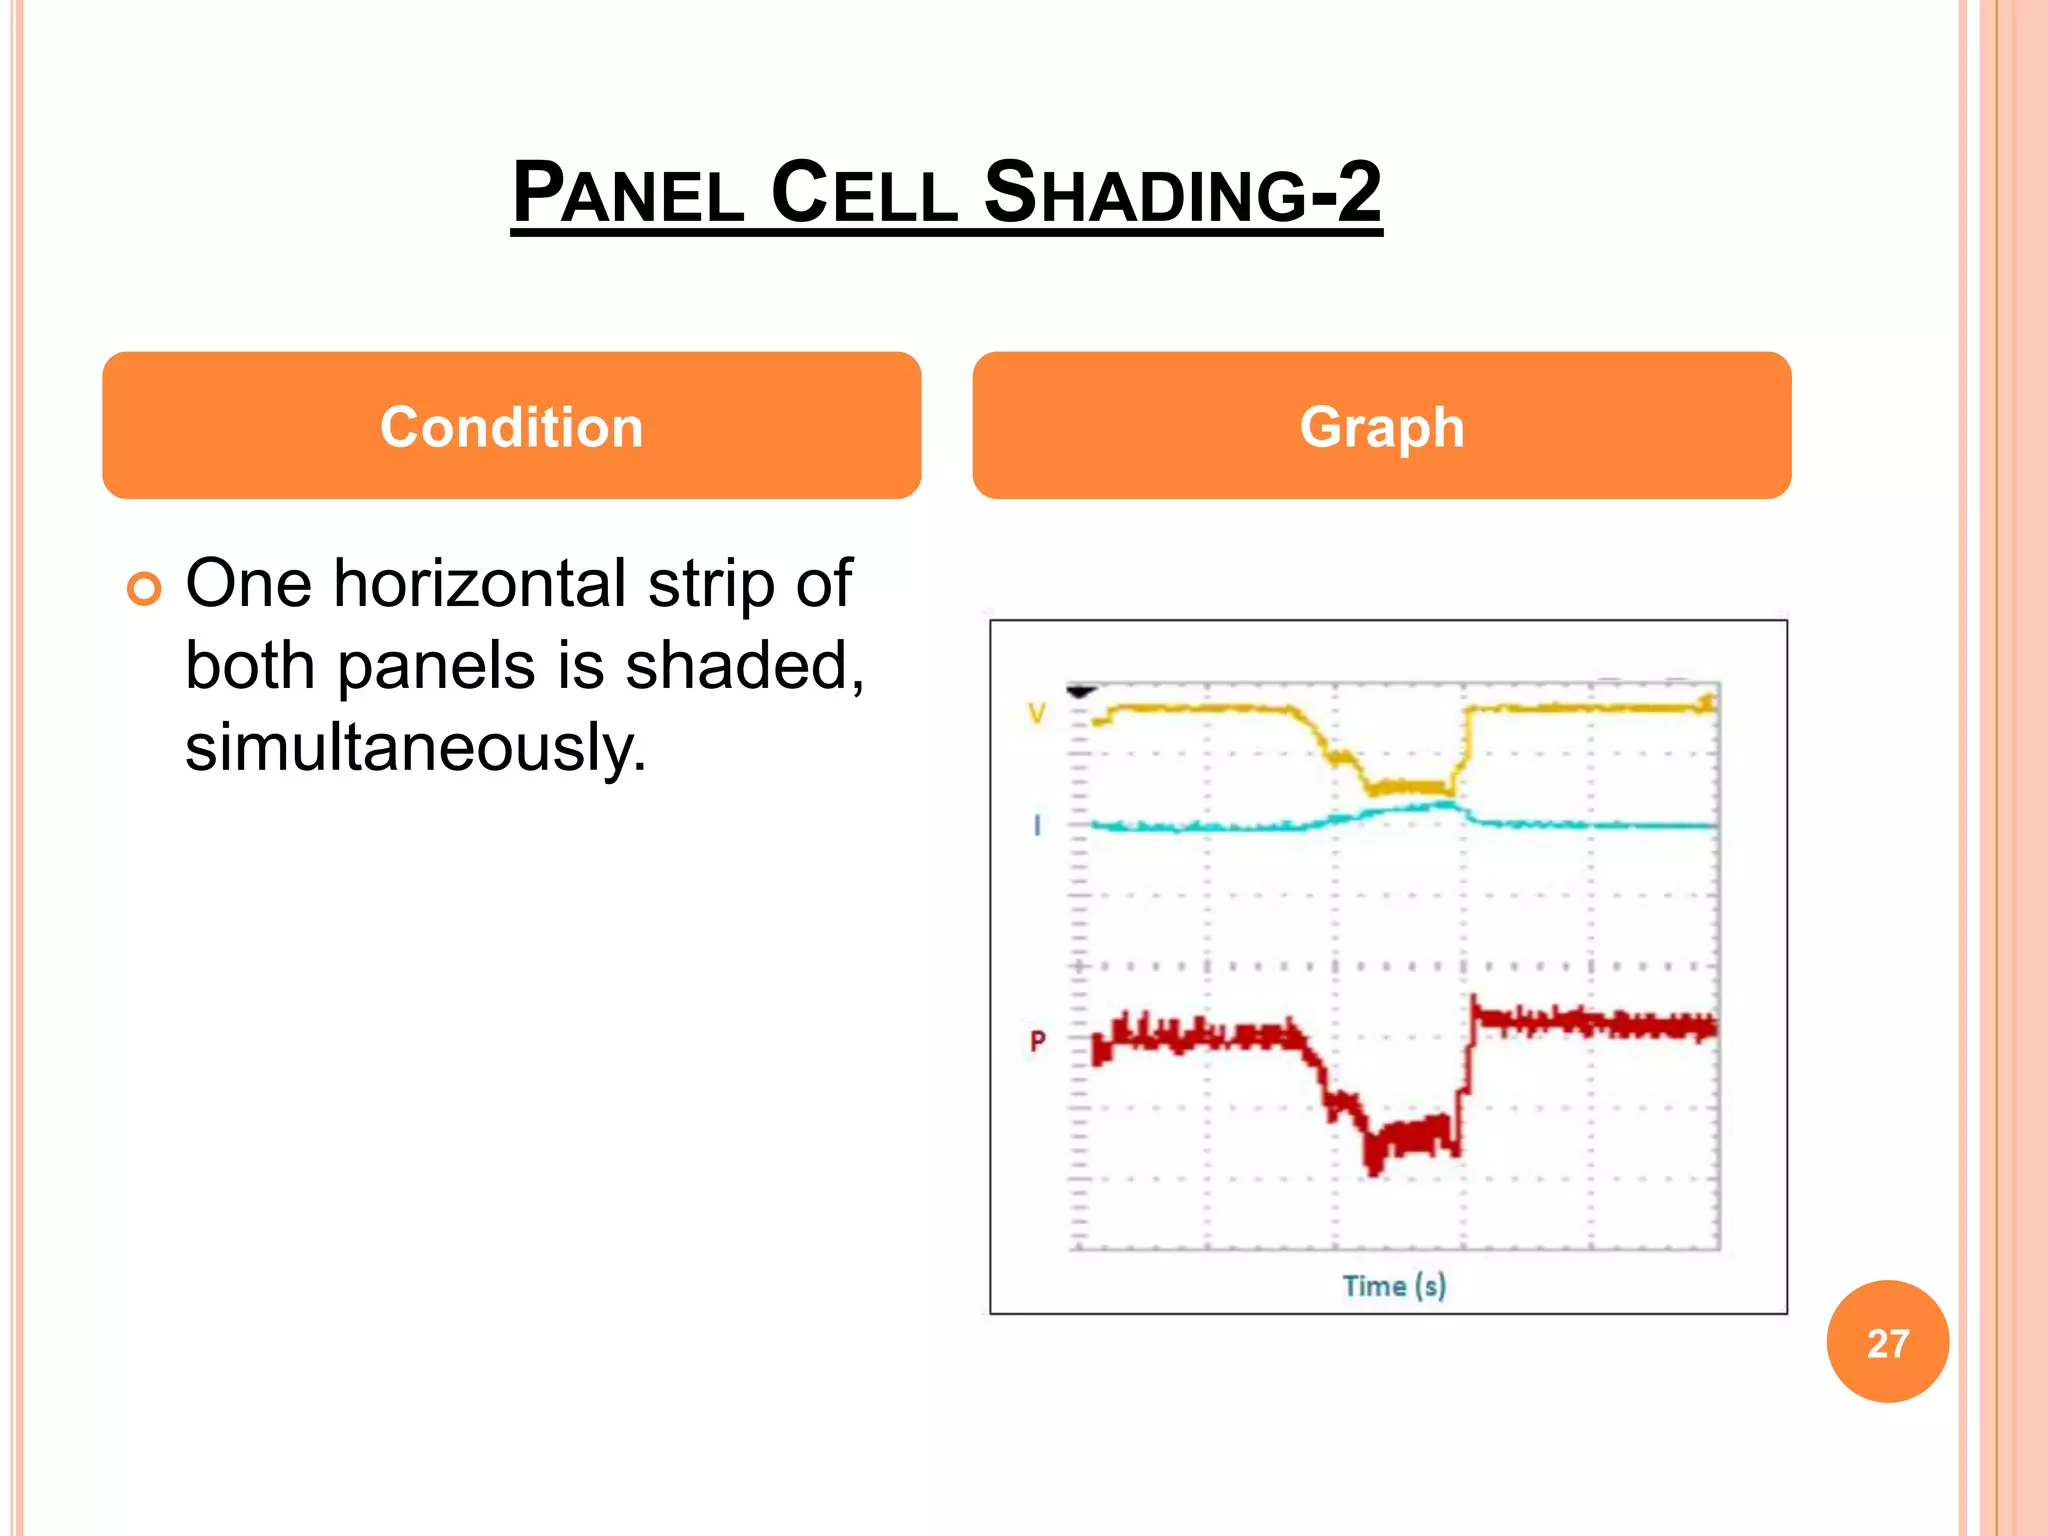
SINGLE AXIS SOLAR TRACKER WITH
MODIFIED PSO-MPPT ALGORITHM
Project Members:
Jyoti Choudhary (1MV10EE020)
Rashmi Hegde (1MV10EE040)
Vrinda K. M. (1MV10EE060)
External Project Guide:
Dr. Vijay Mishra, IISc, Bangalore.
Internal Project Guide:
Ms. Nayana B. R. , Assistant Professor.
1
CONTENTS
 Introduction
 Maximum Power Point of PV Panels
 MPPT Algorithms
 Block Diagram
 MPPT charge controller
 Buck Converter
 Solar Tracker
 Voltage and Current Sensing Circuits
 Hardware Implementation
 Software- PSO
 Results
 Conclusion 2
INTRODUCTION
 Renewable sources of energy have become increasingly
popular source for electrical energy due to its obvious
advantages over non-renewable sources of energy; the
most abundant and virtuous among these sources being
solar energy.
 Solar energy can be directly harnessed to generate
electricity with the help of photovoltaic (PV) cells or solar
cells, which convert the radiant energy directly into
electricity.
 However, the efficiency of the solar panels depends heavily
on both the amount of reception off insolation and its
uniformity over the cells of the PV panel. 3
MAXIMUM POWER POINT OF PV PANELS
4
Normal Condition Partial Shading Condition
MPPT ALGORITHMS
 Perturb and Observe (P&O)
 Incremental Conductance (I.C)
 Fuzzy Logic Control (FL)
 Neural Network (NN)
 Particle Swarm Optimization (PSO)
5
BLOCK DIAGRAM
6
MPPT CHARGE CONTROLLER
7
BUCK CONVERTER
 The solar panels provide higher voltage levels than
their ratings during peak hours whereas the battery
charges at the level of 13.5 at the maximum.
 This leads to the current increasing to dangerously
high levels and may result in damage of the battery.
 To prevent this, the output from the solar panel is
required to be reduced before being given to the
battery.
 The converter reduces the voltage level of the input
to the battery and brings it closer to the battery
rating to maintain the current at optimum levels.
8
CIRCUIT DIAGRAM OF BUCK CONVERTER
9
SOLAR TRACKER
 The single axis solar tracker uses Light Detecting
Resistors(LDRs) as sensors to track the position of
the sun from east to west.
 On the basis of the difference in the intensities of
sunlight received by the LDRs, the microcontroller
is programmed to control the switching of the
relays.
 The sequence of relay switching determines the
direction of motor rotation, which in turn decides the
direction of motion of the Linear Actuator.
10
CIRCUIT DIAGRAM OF SOLAR TRACKER
11
CIRCUIT DIAGRAM OF VOLTAGE SENSING
CIRCUIT
12
Panel Side Voltage Sensing
Battery Side Voltage
Sensing
CIRCUIT DIAGRAM OF CURRENT SENSING
CIRCUIT
13
COMPLETE HARDWARE SET UP
14
CURRENT AND VOLTAGE SENSING CIRCUIT
15
BUCK CONVERTER CIRCUIT
16
COMPARATOR CIRCUIT
17
RELAY CONTROL CIRCUIT
18
SOFTWARE - PSO
 PSO Initialization
Number of Particles (NP) =3
Cognitive Learning Co-efficient (c1) = 1.2
Social Learning Co-efficient (c2) = 1.6
Inertia Weight (w) = (iter (max) - iter)/ (iter (max))
 Update Particle Velocity and Position
 Convergence Criteria
1. Iter= max. iter
2. Δv = |v(iter + 1) − v(iter)|
 Change in Shading Conditions
P(i) < P(i-1) 19
20
RESULTS
 To validate the proposed algorithm discussed in
previous sections, experimental studies were
carried out on two 20V, 2A, and 40W solar panels.
 The panels are connected in panels with the tracker
algorithm set in motion.
 Real-time test measurements are presented for the
following five cases.
 These real-time graphs effectively validate the main
aim of the system, which is to track the position of
the sun and simultaneously deliver maximum power
output irrespective of insolation conditions.
21
 The solar tracker effectively tracked the position of
the sun at various points of the day from east to
west.
 The proposed PSO based MPPT, which employs
multi-search based technique; was capable of
finding the global maximum power point even under
complex partial shading conditions.
 This ensured that the battery, which is the main
load of the system, was charged as close to its
maximum voltage as possible.
22
CHANGE IN INSOLATION
23
 A sudden decrease in
insolation of one panel
with a gradual
decrease in the
insolation of the other.
Condition Graph
PANEL SHADING-1
24
 Both panels covered
completely, one at a
time.
Condition Graph
PANEL SHADING-2
25
 One panel is gradually
shaded.
Condition Graph
PANEL CELL SHADING-1
26
 One horizontal strip of
both panels is shaded,
one at a time.
Condition Graph
PANEL CELL SHADING-2
27
 One horizontal strip of
both panels is shaded,
simultaneously.
Condition Graph
CONCLUSIONS
 The hardware implementation of the single axis
solar tracker with modified PSO-MPPT algorithm
has been executed.
 The results obtained match the simulation results of
the reference paper “An Improved PSO based
MPPT for PV with reduced oscillations” by Ishaque
et al- An IEEE transaction on Power Electronics,
August 2012.
28
THANK YOU!
29

Project overview

  • 1.
    SINGLE AXIS SOLARTRACKER WITH MODIFIED PSO-MPPT ALGORITHM Project Members: Jyoti Choudhary (1MV10EE020) Rashmi Hegde (1MV10EE040) Vrinda K. M. (1MV10EE060) External Project Guide: Dr. Vijay Mishra, IISc, Bangalore. Internal Project Guide: Ms. Nayana B. R. , Assistant Professor. 1
  • 2.
    CONTENTS  Introduction  MaximumPower Point of PV Panels  MPPT Algorithms  Block Diagram  MPPT charge controller  Buck Converter  Solar Tracker  Voltage and Current Sensing Circuits  Hardware Implementation  Software- PSO  Results  Conclusion 2
  • 3.
    INTRODUCTION  Renewable sourcesof energy have become increasingly popular source for electrical energy due to its obvious advantages over non-renewable sources of energy; the most abundant and virtuous among these sources being solar energy.  Solar energy can be directly harnessed to generate electricity with the help of photovoltaic (PV) cells or solar cells, which convert the radiant energy directly into electricity.  However, the efficiency of the solar panels depends heavily on both the amount of reception off insolation and its uniformity over the cells of the PV panel. 3
  • 4.
    MAXIMUM POWER POINTOF PV PANELS 4 Normal Condition Partial Shading Condition
  • 5.
    MPPT ALGORITHMS  Perturband Observe (P&O)  Incremental Conductance (I.C)  Fuzzy Logic Control (FL)  Neural Network (NN)  Particle Swarm Optimization (PSO) 5
  • 6.
  • 7.
  • 8.
    BUCK CONVERTER  Thesolar panels provide higher voltage levels than their ratings during peak hours whereas the battery charges at the level of 13.5 at the maximum.  This leads to the current increasing to dangerously high levels and may result in damage of the battery.  To prevent this, the output from the solar panel is required to be reduced before being given to the battery.  The converter reduces the voltage level of the input to the battery and brings it closer to the battery rating to maintain the current at optimum levels. 8
  • 9.
    CIRCUIT DIAGRAM OFBUCK CONVERTER 9
  • 10.
    SOLAR TRACKER  Thesingle axis solar tracker uses Light Detecting Resistors(LDRs) as sensors to track the position of the sun from east to west.  On the basis of the difference in the intensities of sunlight received by the LDRs, the microcontroller is programmed to control the switching of the relays.  The sequence of relay switching determines the direction of motor rotation, which in turn decides the direction of motion of the Linear Actuator. 10
  • 11.
    CIRCUIT DIAGRAM OFSOLAR TRACKER 11
  • 12.
    CIRCUIT DIAGRAM OFVOLTAGE SENSING CIRCUIT 12 Panel Side Voltage Sensing Battery Side Voltage Sensing
  • 13.
    CIRCUIT DIAGRAM OFCURRENT SENSING CIRCUIT 13
  • 14.
  • 15.
    CURRENT AND VOLTAGESENSING CIRCUIT 15
  • 16.
  • 17.
  • 18.
  • 19.
    SOFTWARE - PSO PSO Initialization Number of Particles (NP) =3 Cognitive Learning Co-efficient (c1) = 1.2 Social Learning Co-efficient (c2) = 1.6 Inertia Weight (w) = (iter (max) - iter)/ (iter (max))  Update Particle Velocity and Position  Convergence Criteria 1. Iter= max. iter 2. Δv = |v(iter + 1) − v(iter)|  Change in Shading Conditions P(i) < P(i-1) 19
  • 20.
  • 21.
    RESULTS  To validatethe proposed algorithm discussed in previous sections, experimental studies were carried out on two 20V, 2A, and 40W solar panels.  The panels are connected in panels with the tracker algorithm set in motion.  Real-time test measurements are presented for the following five cases.  These real-time graphs effectively validate the main aim of the system, which is to track the position of the sun and simultaneously deliver maximum power output irrespective of insolation conditions. 21
  • 22.
     The solartracker effectively tracked the position of the sun at various points of the day from east to west.  The proposed PSO based MPPT, which employs multi-search based technique; was capable of finding the global maximum power point even under complex partial shading conditions.  This ensured that the battery, which is the main load of the system, was charged as close to its maximum voltage as possible. 22
  • 23.
    CHANGE IN INSOLATION 23 A sudden decrease in insolation of one panel with a gradual decrease in the insolation of the other. Condition Graph
  • 24.
    PANEL SHADING-1 24  Bothpanels covered completely, one at a time. Condition Graph
  • 25.
    PANEL SHADING-2 25  Onepanel is gradually shaded. Condition Graph
  • 26.
    PANEL CELL SHADING-1 26 One horizontal strip of both panels is shaded, one at a time. Condition Graph
  • 27.
    PANEL CELL SHADING-2 27 One horizontal strip of both panels is shaded, simultaneously. Condition Graph
  • 28.
    CONCLUSIONS  The hardwareimplementation of the single axis solar tracker with modified PSO-MPPT algorithm has been executed.  The results obtained match the simulation results of the reference paper “An Improved PSO based MPPT for PV with reduced oscillations” by Ishaque et al- An IEEE transaction on Power Electronics, August 2012. 28
  • 29.