Download to read offline
![International Research Journal of Engineering and Technology (IRJET) e-ISSN: 2395-0056
Volume: 07 Issue: 02 | Feb 2020 www.irjet.net p-ISSN: 2395-0072
© 2020, IRJET | Impact Factor value: 7.34 | ISO 9001:2008 Certified Journal | Page 1065
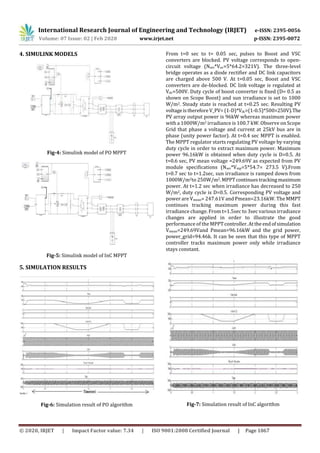
Comparative Simulation Study of Grid Connected Perturb & Observe
and Incremental Conductance MPPT Algorithm
Sujit Kumar Sah1, Kanchan Thakur2
1Former PG scholar at NIT Nagaland
2Former PG scholar at NIT Nagaland
---------------------------------------------------------------------***----------------------------------------------------------------------
Abstract - This paper describes the comparativesimulation
study of Grid connected two MPPT (Maximum Power Point
Tracking) algorithm. MPPT algorithms are important in PV
systems because it is cost efficient as it reduces the number of
PV panels required to achieve the desired output power. The
two algorithms used in this paper for comparison are P&O
(Perturb and Observe) and Inc (Incremental Conductance).
These algorithms are widely used because of its minimumcost
and ease of realization. The important parameters such as
voltage and power output for each differentcombinationhave
been taken out for both algorithms. MATLABSimulinktoolbox
has been used for performance evaluation by a 100 kW
photovoltaic (PV) array.
Key Words: MPPT (Maximum Power Point Tracking),
PV (Photovoltaic), P&O (Perturb & Observe), InC
Incremental Conductance), MATLAB, Simulink.
1. INTRODUCTION
Solar energy is a non-conventional type of energy.
Solar energy has been harnessed by humans since ancient
times using a variety of technologies. Solar radiation, along
with secondary solar-powered resources such as wave and
wind power, hydroelectricity and biomass, account formost
of the available non-conventional type of energy on earth.
Only a small fraction of the available solar energy is used.
Solar powered electrical generation relies on photovoltaic
system and heat engines. Solarenergy'susesarelimitedonly
by human creativity. To harvest the solar energy, the most
common way is to use photo voltaic panels which will
receive photon energy from sun and convert to electrical
energy. Solar technologies are broadly classified as either
passive solar or active solar depending on the way they
detain, convert and distribute solar energy. Active solar
techniques include the use of PV panels and solar thermal
collectors to strap up the energy. Passive solar techniques
include orienting a building to the Sun, selecting materials
with favorable thermal mass or light dispersing properties
and design spaces that naturally circulate air. Solar energy
has a vast area of application such as electricity generation
for distribution, heating water, lightening building, crop
drying etc. [2].
1.1 Solar radiation distributions
Fig – 1: Solar radiation distributions [3]
From the above of solar radiation, Earth receives
174 petawatts (PW) of incoming solar radiationattheupper
atmosphere. Approximately 30% is reflected back to space
and only 89 PW is absorbed by oceans and land masses. The
spectrum of solar light at the Earth's surface is generally
spread across the visible and near-infrared reason with a
small part in the near-ultraviolet. The total solar energy
absorbed by Earth's atmosphere, oceans and land masses is
approximately 3,850,000 EJ per year [3].
1.2 Photovoltaic
Photovoltaic (PV)energyiscurrently “consideredas
one of the most renewable natural energy sources in the
world because it is clean, free, abundant, pollution-free
and inexhaustible. Due to the rapid growth in solar cells
and power electronics technology, PV energy has
received increasing interest in electrical power
applications. ”Nonetheless,the“present energyconservation
efficiency of PV array is still low.Itrequiresmaximumpower
point tracking(MPPT) control techniques to extract the
maximum power from PV arrays in order to achieve
maximum operating efficiency.”A PV cluster as of now is a
nonlinear voltage that fluctuates with exhibit
temperature and sun oriented separation, making the most
extreme power point(MPP) hard to find. To beat this issue,
different techniques, for example, the botherandperception
strategy and Incremental conductancestrategies,” havebeen
proposed for the MPPT calculations of PV clusters. “In the
perturbation and observation method, theoperatingvoltage
of PV array changes the duty ratio in order to locate](https://image.slidesharecdn.com/irjet-v7i2226-201116090636/85/IRJET-Comparative-Simulation-Study-of-Grid-Connected-Perturb-Observe-and-Incremental-Conductance-MPPT-Algorithm-1-320.jpg)
![International Research Journal of Engineering and Technology (IRJET) e-ISSN: 2395-0056
Volume: 07 Issue: 02 | Feb 2020 www.irjet.net p-ISSN: 2395-0072
© 2020, IRJET | Impact Factor value: 7.34 | ISO 9001:2008 Certified Journal | Page 1065
Comparative Simulation Study of Grid Connected Perturb & Observe
and Incremental Conductance MPPT Algorithm
Sujit Kumar Sah1, Kanchan Thakur2
1Former PG scholar at NIT Nagaland
2Former PG scholar at NIT Nagaland
---------------------------------------------------------------------***----------------------------------------------------------------------
Abstract - This paper describes the comparativesimulation
study of Grid connected two MPPT (Maximum Power Point
Tracking) algorithm. MPPT algorithms are important in PV
systems because it is cost efficient as it reduces the number of
PV panels required to achieve the desired output power. The
two algorithms used in this paper for comparison are P&O
(Perturb and Observe) and Inc (Incremental Conductance).
These algorithms are widely used because of its minimumcost
and ease of realization. The important parameters such as
voltage and power output for each differentcombinationhave
been taken out for both algorithms. MATLABSimulinktoolbox
has been used for performance evaluation by a 100 kW
photovoltaic (PV) array.
Key Words: MPPT (Maximum Power Point Tracking),
PV (Photovoltaic), P&O (Perturb & Observe), InC
Incremental Conductance), MATLAB, Simulink.
1. INTRODUCTION
Solar energy is a non-conventional type of energy.
Solar energy has been harnessed by humans since ancient
times using a variety of technologies. Solar radiation, along
with secondary solar-powered resources such as wave and
wind power, hydroelectricity and biomass, account formost
of the available non-conventional type of energy on earth.
Only a small fraction of the available solar energy is used.
Solar powered electrical generation relies on photovoltaic
system and heat engines. Solarenergy'susesarelimitedonly
by human creativity. To harvest the solar energy, the most
common way is to use photo voltaic panels which will
receive photon energy from sun and convert to electrical
energy. Solar technologies are broadly classified as either
passive solar or active solar depending on the way they
detain, convert and distribute solar energy. Active solar
techniques include the use of PV panels and solar thermal
collectors to strap up the energy. Passive solar techniques
include orienting a building to the Sun, selecting materials
with favorable thermal mass or light dispersing properties
and design spaces that naturally circulate air. Solar energy
has a vast area of application such as electricity generation
for distribution, heating water, lightening building, crop
drying etc. [2].
1.1 Solar radiation distributions
Fig – 1: Solar radiation distributions [3]
From the above of solar radiation, Earth receives
174 petawatts (PW) of incoming solar radiationattheupper
atmosphere. Approximately 30% is reflected back to space
and only 89 PW is absorbed by oceans and land masses. The
spectrum of solar light at the Earth's surface is generally
spread across the visible and near-infrared reason with a
small part in the near-ultraviolet. The total solar energy
absorbed by Earth's atmosphere, oceans and land masses is
approximately 3,850,000 EJ per year [3].
1.2 Photovoltaic
Photovoltaic (PV)energyiscurrently “consideredas
one of the most renewable natural energy sources in the
world because it is clean, free, abundant, pollution-free
and inexhaustible. Due to the rapid growth in solar cells
and power electronics technology, PV energy has
received increasing interest in electrical power
applications. ”Nonetheless,the“present energyconservation
efficiency of PV array is still low.Itrequiresmaximumpower
point tracking(MPPT) control techniques to extract the
maximum power from PV arrays in order to achieve
maximum operating efficiency.”A PV cluster as of now is a
nonlinear voltage that fluctuates with exhibit
temperature and sun oriented separation, making the most
extreme power point(MPP) hard to find. To beat this issue,
different techniques, for example, the botherandperception
strategy and Incremental conductancestrategies,” havebeen
proposed for the MPPT calculations of PV clusters. “In the
perturbation and observation method, theoperatingvoltage
of PV array changes the duty ratio in order to locate](https://image.slidesharecdn.com/irjet-v7i2226-201116090636/75/IRJET-Comparative-Simulation-Study-of-Grid-Connected-Perturb-Observe-and-Incremental-Conductance-MPPT-Algorithm-1-2048.jpg)
![International Research Journal of Engineering and Technology (IRJET) e-ISSN: 2395-0056
Volume: 07 Issue: 02 | Feb 2020 www.irjet.net p-ISSN: 2395-0072
© 2020, IRJET | Impact Factor value: 7.34 | ISO 9001:2008 Certified Journal | Page 1066
variations in directions for maximizing PV array current. If
power increases, the operating voltage is further perturbed
in the same direction; If it decreases, the direction of the
Perturbation is reversed. This methoddoesnotrequiresolar
panel characteristics, but it remains unsuitable for
applications underrapidlychangingatmospheric conditions.
The disadvantage of perturb and observationmethodcan be
minimized by comparing the incremental andinstantaneous
conductance of PV arrays. This method is more accurateand
can provide good performance under rapidly changing
conditions.”In this paper, a comparative study between PO
and InC algorithm has been done using MATLAB /
Simulink[4].
2. PERTURBATION AND OBSERVATION
ALGORITHM
Perturb and observe algorithms are widely used in MPPT
because of their simple structure and the few measured
parameters which arerequired.Theyoperatebyperiodically
perturbing (i.e. incrementing or decrementing) the array
termed voltage and comparing the PV output power with
that of the previous perturbation cycle. If the power is
increasing, the perturbation will continue in the same
direction in the next cycle, otherwise the perturbation
direction will be reversed.
Fig-2: Flow chart of P&O algorithm.
This means the array terminal voltage is perturbed every
MPPT cycle, therefore when the P&O is reached, the P&O
algorithm will oscillate around it resulting in a loss of PV
power, especially in cases of constant or slowly varying
atmospheric conditions. Another way to reduce the power
loss around the P&O is to decrease the perturbation step,
however, the algorithm will be slow in following the P&O
when the atmospheric conditions start to vary and more
power will be lost [7].
3. INCREMENTAL CONDUCTANCE ALGORITHM
Incremental Conductance (IC) method overcomes the
disadvantage of the Perturb and Observe methodintracking
the peak power under fast varying atmospheric condition.
This method can determine whether the MPPT has reached
the MPP and also stops perturbingtheoperatingpoint.Ifthis
condition is not met, the direction in which the MPPT
operating point must be perturbed can be calculated using
the relationship between dl/dV and –I/V. Condition are:
Maximum power point is obtained when dP/dV=0
Where, P= V*I
=) d (V*I)/dV = I + V*dI/dV = 0
=) dI/dV = -I/V
=) dI/dV + I/V = 0
This relationship is derived from the fact that dP/dV is
negative when the MPPT is to the right of the MPP and
positive when it is to the left of the MPP. This algorithm
determines when the MPPT has reached the MPP, where as
P&O oscillates around the MPP. This is clearly an advantage
over P&O. Also, incremental conductance can track rapidly
increasing and decreasing irradiance conditions withhigher
accuracy than perturb and observe method. The
disadvantage of this algorithm is that it is more complex
when compared to P&O. The algorithm can be easily
understood by the following flow chart which is shown in
figure.
Fig-3: Flow chart of InC algorithm.](https://image.slidesharecdn.com/irjet-v7i2226-201116090636/85/IRJET-Comparative-Simulation-Study-of-Grid-Connected-Perturb-Observe-and-Incremental-Conductance-MPPT-Algorithm-2-320.jpg)
![International Research Journal of Engineering and Technology (IRJET) e-ISSN: 2395-0056
Volume: 07 Issue: 02 | Feb 2020 www.irjet.net p-ISSN: 2395-0072
© 2020, IRJET | Impact Factor value: 7.34 | ISO 9001:2008 Certified Journal | Page 1068
From t=0 sec to t= 0.05 sec, pulses to Boost and VSC
converters are blocked. PV voltage corresponds to open-
circuit voltage (Nser*Voc=5*64.2=321V). The three-level
bridge operates as a diode rectifier and DC link capacitors
are charged above 500 V. At t=0.05 sec, Boost and VSC
converters are de-blocked. DC link voltage is regulated at
Vdc=500V. Duty cycle of boost converter is fixed [D= 0.5 as
shown on Scope Boost) and sun irradiance is set to 1000
W/m2. Steady state is reached at t=0.25 sec. Resulting PV
voltageisthereforeV_PV=(1-D)*Vdc=(1-0.5)*500=250V].The
PV array output power is 96kW whereas maximum power
with a 1000W/m2 irradiance is 100.7 kW. Observe on Scope
Grid that phase A voltage and current at 25kV bus are in
phase (unity power factor).Att=0.4sec MPPTis enabled. The
MPPT regulator starts regulating PV voltage by varyingduty
cycle in order to extract maximum power. Maximum power
96.16kW is obtained when duty cycle is D=0.5. At t=0.6 sec,
PV mean voltage =274.74V as expected from PV module
specifications (Nser*Vmp= 5*54.7= 273.5 V).Fromt=0.7sec to
t=1.2sec, sun irradiance is ramped down from 1000W/m2to
250W/m2. MPPT continues tracking maximum power. At
t=1.2 sec when irradiance has decreased to 250 W/m2, duty
cycle is D=0.5. Corresponding PV voltage and power are
Vmean= 255V and Pmean=22.6kW. The MMPT continues
tracking maximum power during thisfastirradiancechange.
From t=1.5sec to 3secvarious irradiancechangesareapplied
in order to illustrate the good performance of the MPPT
controller. At the end of simulation Vmean=274.74V and
Pmean=100.71kW and the grid power,powergrid=99.04 kW.
It can be seen that this type of MPPT controller tracks
maximum power only while irradiance stays constant.
6. CONCLUSIONS
Table -1: Comparison between P&O and InC algorithms.
MPPT Output
Voltage of
PV array
Output
Power of PV
array
Grid Power Accuracy
P&O 249.69 V 96.15 kW 94.46 kW Less
InC 274.40 V 100.71 kW 99.04 kW Accurate
The Perturb and Observe and Incremental Conductance
algorithms are simulated and compared using the same
conditions. When atmospheric conditions are constant or
change slowly, the P&O MPPT oscillates close to MPP but
Incremental conductance MPPT finds the MPP accurately at
changingatmospheric conditions. It proved thatincremental
conductance method has better performance than P&O
algorithm.
REFERENCES
[1] W. Xiao, W. G. Dunford, and A. Capel, “A novel modeling
method for photovoltaic cells”, in Proc. IEEE 35th Annu.
Power Electron. Spec. Conf. (PESC), 2004, vol. 3, pp.
1950–1956.
[2] Application of non-conventional & renewable energy
sources, Bureau of Energy Efficiency.
[3] http://alexgomez.com/autoxtra.htm.
[4] B Ramakrishna, T Srikanth, M Naga Chaitanya and T
Vijay Muni, “Comparative Analysis of Perturb and
Observe Method and Current Based Method”,
International Journal of Innovative Technology and
Exploring Engineering (IJITEE), ISSN: 2278-3075,
Volume-8 Issue-6, April 2019.
[5] Wlliam Christopher and Dr. R. Ramesh, “Comparative
Study of P&O and InC MPPT Algorithms”, American
Journal of Engineering Research (AJER), Volume-02,
Issue-12, pp-402-408.
[6] Mr. S. Sheik Mohammed and Dr. D. Devaraj, “Simulation
and Analysis of Stand-alone Photovoltaic System with
Boost Converter using MATLAB/Simulink”.
[7] Design and Analysis of P&O and IP&O MPPT Techniques
for Photovoltaic System,(IJMER)Vol.2,Issue.4,July-Aug.
2012 pp-2174-2180.
[8] Mohammed A. Elgendy, Bashar Zahawi, and David J.
Atkinson, “Assessment of Perturb and Observe MPPT
Algorithm Implementation Techniques for PV Pumping
Applications”.](https://image.slidesharecdn.com/irjet-v7i2226-201116090636/85/IRJET-Comparative-Simulation-Study-of-Grid-Connected-Perturb-Observe-and-Incremental-Conductance-MPPT-Algorithm-4-320.jpg)

This document compares the Perturb and Observe (P&O) and Incremental Conductance (InC) maximum power point tracking algorithms through MATLAB/Simulink simulations of a 100 kW photovoltaic system connected to the grid. The P&O algorithm oscillates around the maximum power point, resulting in lower output power compared to the InC algorithm, which can track the maximum power point directly. Simulation results show the InC algorithm achieved higher output voltage, power, and grid power compared to the P&O algorithm under changing irradiance conditions. The InC algorithm more accurately tracks the maximum power point, especially under rapidly changing irradiance, but is more complex than the P&O algorithm.