Download to read offline

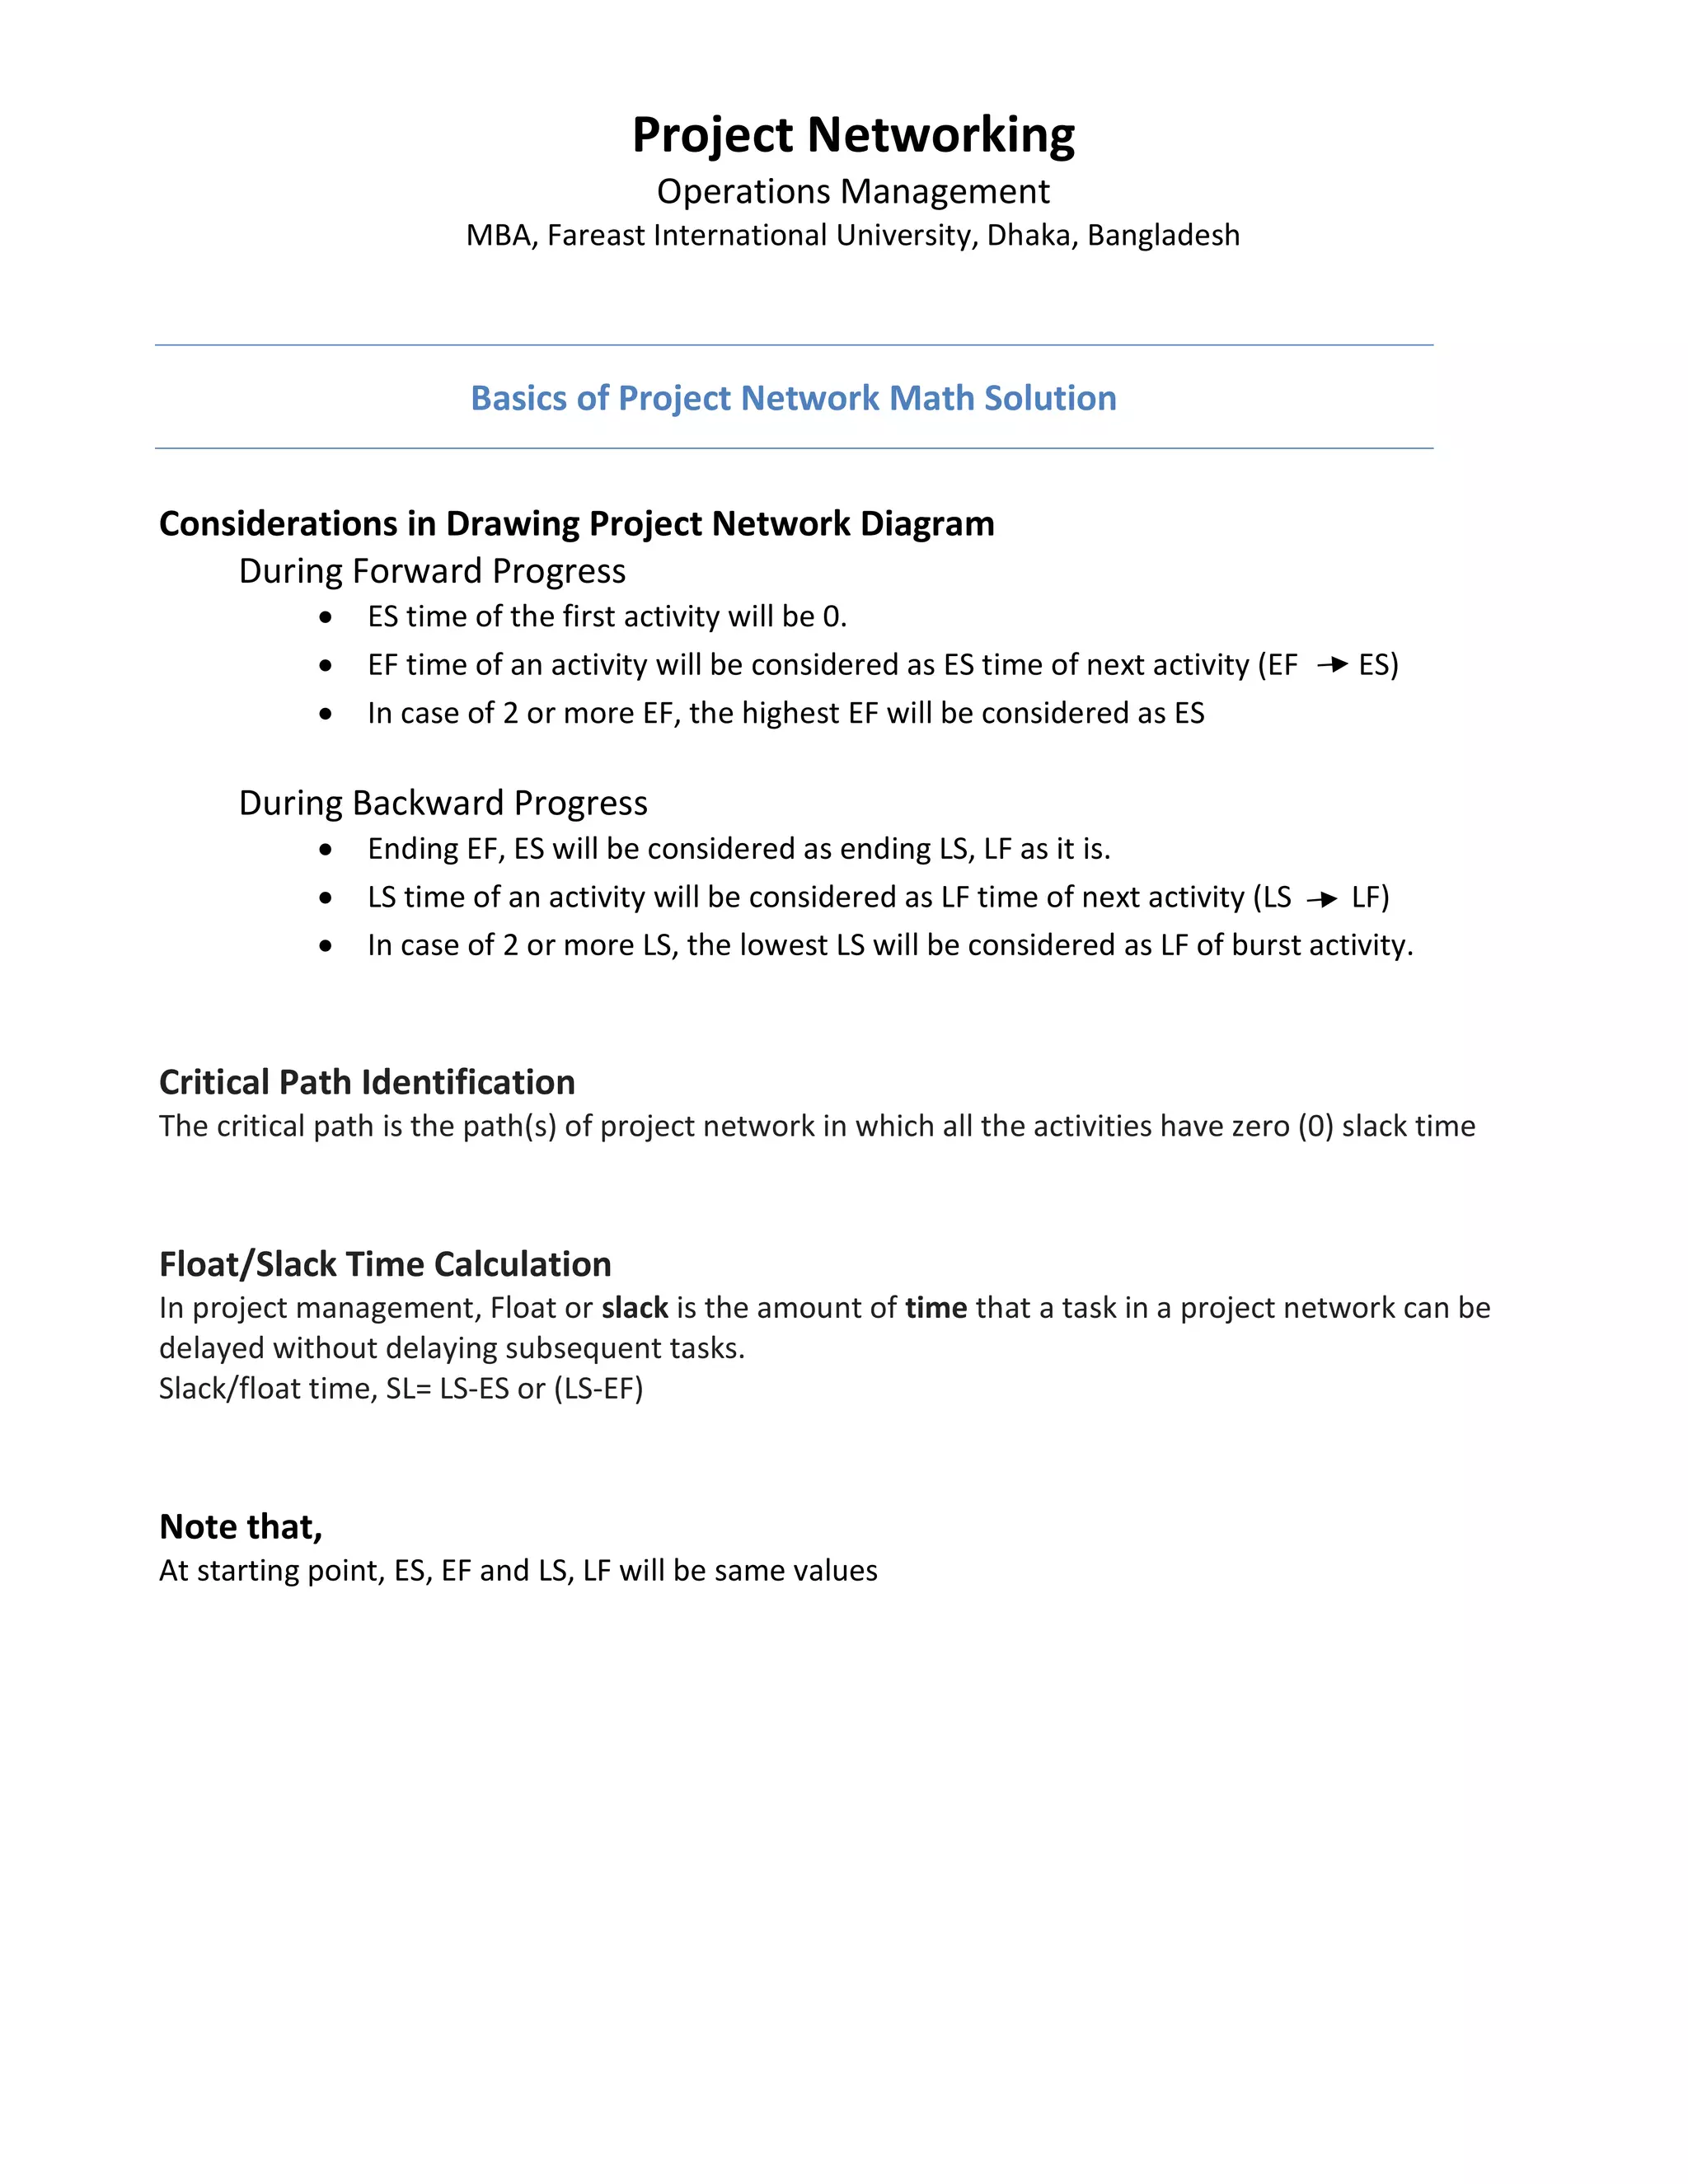
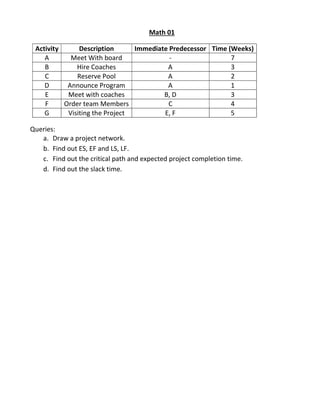
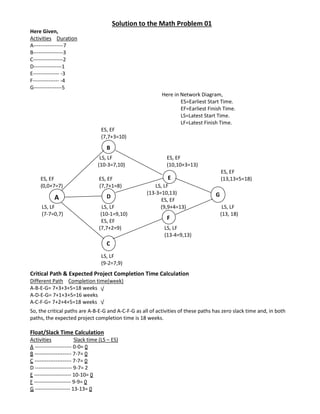
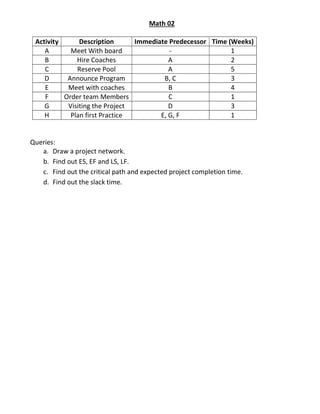
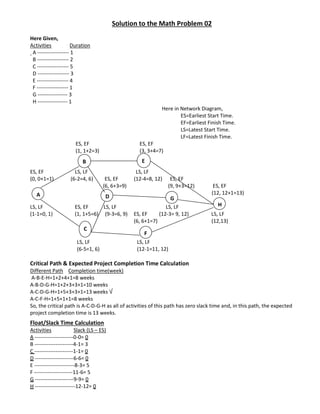
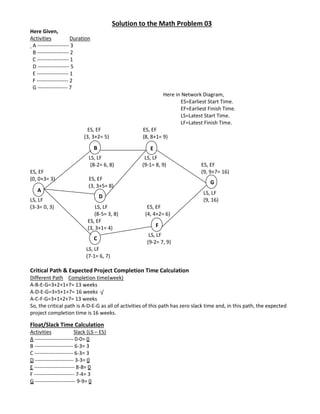
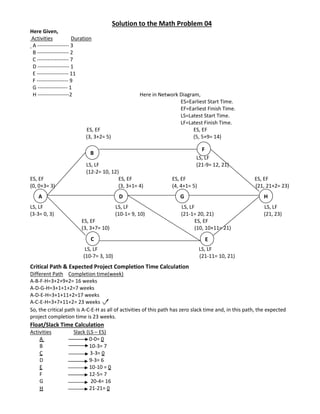

The document outlines project network operations management concepts, focusing on creating project network diagrams and calculating essential metrics such as earliest start and finish times (ES and EF), latest start and finish times (LS and LF), slack time, and critical paths. It includes detailed solutions for multiple math problems, allowing users to understand how to identify critical paths, expected project completion times, and slack times for various project activities. The critical paths highlighted demonstrate that they have zero slack time, indicating the most time-sensitive sequences of tasks within the project.


