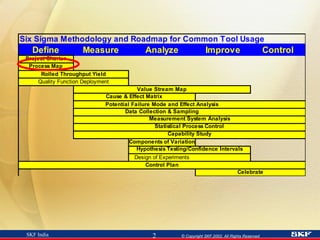
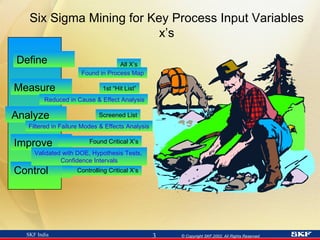
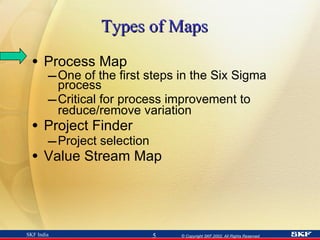
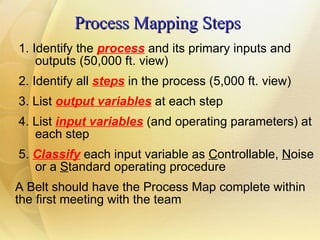
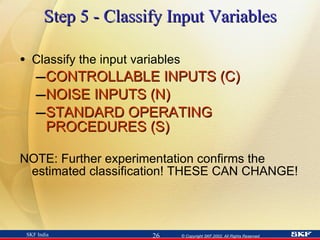
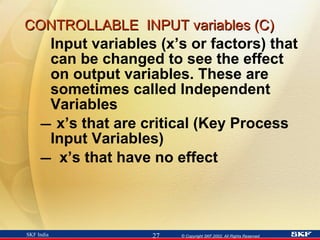
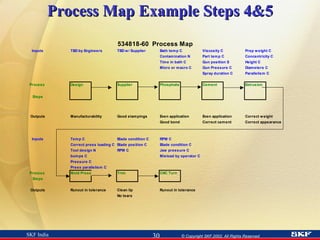
Six Sigma Process Mapping
 
Six Sigma Mining for Key Process Input Variables x’s Define Measure Analyze Improve Control Found Critical X’s Controlling Critical X’s All X’s 1st “Hit List” Screened List Found in Process Map Reduced in Cause & Effect Analysis Filtered in Failure Modes & Effects Analysis Validated with DOE, Hypothesis Tests,  Confidence Intervals
Objectives Provide overview of types of maps  Link Process Mapping with process improvement  Explain how to create a process map Show examples Do an exercise
Types of Maps Process Map One of the first steps in the Six Sigma process Critical for process improvement to reduce/remove variation Project Finder Project selection Value Stream Map
Project Work  Common Characteristics More questions than answers Dynamic Parallel activities, rather than sequenced Communication necessary Documentation necessary May be difficult to know where to start You may not be the expert
These are some questions we will need to answer!  Remember, we are trying to learn   How will we identify the x’s?
A Process Map Is Used to begin EVERY project! A graphical tool to illustrate the way a process is currently working Dynamic A team effort done by “walking the process” A tool to GAIN PROCESS KNOWLEDGE!
Uses of Process Maps Learn about a process through questioning Data collection Determine details of a project What factors to investigate or omit Where and how to sample Identify process owners Evaluate ALL types of processes Management, Administrative, Financial, Service, Design, Manufacturing
Process Maps Describe Major activities/tasks Value added and non-value added steps Process boundaries Inputs (x’s) Outputs (y’s or Y’s) being measured or in need of measurement systems Where data is (or should be) collected Current operating parameters
Process Map =  Process Flow Chart
Process Map Shows inputs and outputs Shows the steps of the flow of the process  May or may not show decisions  Shows the steps of how the process actually works Helps streamline flow Helps make process improvements by understanding, and controlling inputs to eliminate variation  Does not show inputs and outputs Shows the flow of the process Shows decisions and alternate pathways May not show the process steps as-is.  Rather, it may reflect the process as it should be (for your ISO procedure, for example) Helps streamline flow Does not focus on reducing variation (Process) Flow Chart
Process Maps and Flow Charts Process maps Drive reduction in variation Value Stream Flow charts  Reduce Waste Our primary focus will be on  Process Mapping FEED
Process Mapping Terms   Input  variables may influence process steps  x ’s or factors Output  variables or customer requirements  “ Big  Y ’s” when referring to final output “ Little y’s” when referring to measurements taken upstream Understand and control the x’s to control the  Y ’s
Process Mapping Steps 1. Identify the  process  and its primary inputs and  outputs (50,000 ft. view)  2. Identify all  steps  in the process (5,000 ft. view) 3. List  output variables  at each step 4. List  input variables  (and operating parameters) at  each step 5.  Classify   each input variable as  C ontrollable,  N oise  or a  S tandard operating procedure A Belt should have the Process Map complete within the first meeting with the team
Step 1:  (High Level) Identify the Process and Inputs/Outputs Identify external inputs Raw materials Energy requirements Incoming information Identify end customer requirements (outputs, or Y’s) on-time correct quantity perfect quality CTQ
Examples - Step 1 Order Entry EDI FAX Email . . Price & availability Confirmation of order Promise date Order number . . Inputs Outputs Non- Manufacturing The 50,000 ft. view Molding Stamping C Prep C Solvent C Nozzle S . Coverage Thickness Hardness Color Leak Test . Inputs Outputs Manufacturing
Step 2:  Identify All Steps in the Process   Identify the process flow steps Tips – Try to show in 3 – 8 Steps Start with the end and the beginning. Then, fill in the middle. Include all value-added and non value-added steps Process steps, inspection/test, rework, scrap points WALK THE PROCESS! A Process Map isn’t done on the computer! While you walk the process you will also be identifying x’s and y’s (next steps)
Manufacturing Example - Step 2
Non-Manufacturing Example - Step 2 STEP 1 Answer Phone /  Greet Customer STEP 2 Determine  Part Number /  price / need date STEP 3 Get PO #  STEP 4 Identify ship to address,  method of shipment STEP 8 Verify plant receipt of order STEP 7 Verify order info -  fax to customer /  transmit to plant STEP 6 Input order  on computer STEP 5 Complete order  worksheet
Step 3:  List Output Variables   Include all output variables (the y’s). Defines the scope and objectives of the process Indicates where measurements are taken during the process Labels and differentiates between what is and what is not currently measured Defines “In-Process”  parameters (y’s) which are measured UPSTREAM from the final output (Y)  Tip: May be easier to list the outputs and inputs (Steps 3 and 4)  by step  before moving on to the next step
Manufacturing Example - Step 3
Non-Manufacturing Example - Step 3   STEP 1 Answer Phone /  Greet Customer STEP 2 Determine  Part Number /  price / need date STEP 3 Get PO #  STEP 4 Identify ship to address,  method of shipment OUTPUTS Prompt answer Live body Customer info Pricing Availability Customer PO Ship to address Method of shipment
Non-Manufacturing Example - Step 3 (Continued)   Complete order info from customer Order in computer All fields completed Promise date Printed confirmation Correct info Confirmation to customer Order sent to plant Completed order entry OUTPUTS STEP 8 Verify plant receipt of order STEP 7 Verify order info -  fax to customer / transmit to plant STEP 6 Input order  on computer STEP 5 Complete order  worksheet
Step 4:  List Input Variables List all input variables (x’s or factors)
Step 5 - Classify Input Variables Classify the input variables CONTROLLABLE INPUTS (C) NOISE INPUTS (N) STANDARD OPERATING PROCEDURES (S) NOTE: Further experimentation confirms the estimated classification! THESE CAN CHANGE!
CONTROLLABLE  INPUT variables (C) Input variables (x’s or factors) that can be changed to see the effect on output variables. These are sometimes called Independent Variables x’s that are critical (Key Process Input Variables) x’s that have no effect
NOISE (N) Inputs that impact the outputs but are: 1. Uncontrollable 2. Too costly to control 3. Preferably not controlled Example - An environmental variable such as humidity
STANDARD OPERATING PROCEDURE (S) Inputs that are defined by operating procedures that may be considered “common sense activities” Examples: Training, Cleaning, Preventive Maintenance
Process Map Example Steps 4&5
Non-Manufacturing Example - Steps 4&5 Complete order info from customer Order worksheet form  C   Customer supplied info  N Order in computer All fields completed Promise date Printed confirmation Order worksheet  C Computer entry screens  C Lead time info from mfrg.  N Correct info Confirmation to customer Order sent to plant Printed confirmation  sheet  C Customer contact info  N Confirmation procedure  C Completed order entry Correct info in computer  C Mfrg plant contact  C OUTPUTS INPUTS STEP 8 Verify plant receipt of order STEP 7 Verify order info -  fax to customer / transmit to plant STEP 6 Input order  on computer STEP 5 Complete order  worksheet
Preparing the Process Map Team Effort  Manufacturing engineers Line operators Line supervisors Maintenance technicians Possible Inputs to Mapping Brainstorming Operator manuals Engineering specifications Operator experience 6M’s Man, Machine (Equipment), Method (Procedures), Measurement, Materials, Mother Nature (Environment) Keep it Simple – Use Excel to allow copying into next tool (Cause and Effect matrix)
Process Map Summary Process Mapping Provides Inputs to  Cause and Effect Matrix Potential Failure Mode Effect Analysis Control Plan Capability Studies Experimentation Process Mapping helps us gain process knowledge!
Your First Process Map Assignment 1. Study the flowchart of the  Order Pickers Company 2. Create a Process Map  individually 3.   Compare and  discuss your process map with partners
The  Order Pickers Company   “Flow Chart” RECEIVE  Products Put Away Order Rec’v Pick Consolidate PACK/SHIP KEY: Process Step Inspection/Test Rework Inventory
SKF Example
A Champion Calls You, the Six Sigma Green Belt, to Help the Team She needs quality improved to land a big customer –The customer is a national distributor Currently, the quality of our product line is only 2 Sigma The customer will buy all lines if each line meets quality levels Best-In-Class among competitors is 4 Sigma 6 Sigma capability on the CTQ’s will guarantee the business – if able to ship-on-time Potential sales > $1,000,000 annually Scrap, rework, inspection costs exceed $250,000 annually The product family includes several molded products. One product line quality is world-class already and exceeds the expectations of this potential customer
Process Mapping Exercise 2   View the process as a team, one step at a time Observe the operator demonstrating his/her operation based on the written procedures at the station Ask questions of the operator to gain process knowledge about the inputs and outputs at the given step You have 5 minutes to view and question the entire process. After viewing/questioning the process, return with the team to the room to begin constructing the process map and answering Part II of the assignment. FOCUS ON THE PROCESS, NOT THE PEOPLE!
Exercise to Apply Learning Observe the factory with your team Create a Process Map Be sure to include all elements of good Process Maps Draw on flipchart Presentations and “Advice”
Assignment (Part II) Describe the similarities and differences between  “ Process Mapping” and “Flowcharting” If the labeling of the inputs is correct, what behaviors and disciplines will be required of the operators? of the line supervision? of the senior management? Who should prepare, complete and assess the maps?  What are you looking for?  How and when should maps be updated?
Review Questions - True or False?   Use YES/NO Cards   For constructing a process map, inputs should be determined while walking and questioning the process with the team Outputs listed on your process map are always measured Process inputs are classified as Controllable or Noise or SOP A process map should reflect the best way a process should operate To make an accurate process map, it is best to do it alone so that you are not distracted by others It is OK for a Belt to draft a Map for the Team to start from Once a process map is constructed, it is never changed
Process Map Questions to Verify Quality of Map Does it cover the project scope? Who helped develop the map? Did I get the operators input? Does it reflect current state or the desired process? Are all non value-added steps included? Are all inputs and outputs listed? Were any quick-hits found from this effort? What process steps does the team feel can be eliminated? What characterizes controlled and noise variables? What measurements are taken within the process?  What measurements SHOULD be taken throughout the process? Did you and your team “walk the process?” How often? What is the next step and what is the timeline? Is there a lot of waste to warrant a Value Stream Map first?
Update Tool Knowledge Histogram

6 sigma-process-mapping-1233778357447980-3

  • 1.
  • 2.
  • 3.
    Six Sigma Miningfor Key Process Input Variables x’s Define Measure Analyze Improve Control Found Critical X’s Controlling Critical X’s All X’s 1st “Hit List” Screened List Found in Process Map Reduced in Cause & Effect Analysis Filtered in Failure Modes & Effects Analysis Validated with DOE, Hypothesis Tests, Confidence Intervals
  • 4.
    Objectives Provide overviewof types of maps Link Process Mapping with process improvement Explain how to create a process map Show examples Do an exercise
  • 5.
    Types of MapsProcess Map One of the first steps in the Six Sigma process Critical for process improvement to reduce/remove variation Project Finder Project selection Value Stream Map
  • 6.
    Project Work Common Characteristics More questions than answers Dynamic Parallel activities, rather than sequenced Communication necessary Documentation necessary May be difficult to know where to start You may not be the expert
  • 7.
    These are somequestions we will need to answer! Remember, we are trying to learn How will we identify the x’s?
  • 8.
    A Process MapIs Used to begin EVERY project! A graphical tool to illustrate the way a process is currently working Dynamic A team effort done by “walking the process” A tool to GAIN PROCESS KNOWLEDGE!
  • 9.
    Uses of ProcessMaps Learn about a process through questioning Data collection Determine details of a project What factors to investigate or omit Where and how to sample Identify process owners Evaluate ALL types of processes Management, Administrative, Financial, Service, Design, Manufacturing
  • 10.
    Process Maps DescribeMajor activities/tasks Value added and non-value added steps Process boundaries Inputs (x’s) Outputs (y’s or Y’s) being measured or in need of measurement systems Where data is (or should be) collected Current operating parameters
  • 11.
    Process Map = Process Flow Chart
  • 12.
    Process Map Showsinputs and outputs Shows the steps of the flow of the process May or may not show decisions Shows the steps of how the process actually works Helps streamline flow Helps make process improvements by understanding, and controlling inputs to eliminate variation Does not show inputs and outputs Shows the flow of the process Shows decisions and alternate pathways May not show the process steps as-is. Rather, it may reflect the process as it should be (for your ISO procedure, for example) Helps streamline flow Does not focus on reducing variation (Process) Flow Chart
  • 13.
    Process Maps andFlow Charts Process maps Drive reduction in variation Value Stream Flow charts Reduce Waste Our primary focus will be on Process Mapping FEED
  • 14.
    Process Mapping Terms Input variables may influence process steps x ’s or factors Output variables or customer requirements “ Big Y ’s” when referring to final output “ Little y’s” when referring to measurements taken upstream Understand and control the x’s to control the Y ’s
  • 15.
    Process Mapping Steps1. Identify the process and its primary inputs and outputs (50,000 ft. view) 2. Identify all steps in the process (5,000 ft. view) 3. List output variables at each step 4. List input variables (and operating parameters) at each step 5. Classify each input variable as C ontrollable, N oise or a S tandard operating procedure A Belt should have the Process Map complete within the first meeting with the team
  • 16.
    Step 1: (High Level) Identify the Process and Inputs/Outputs Identify external inputs Raw materials Energy requirements Incoming information Identify end customer requirements (outputs, or Y’s) on-time correct quantity perfect quality CTQ
  • 17.
    Examples - Step1 Order Entry EDI FAX Email . . Price & availability Confirmation of order Promise date Order number . . Inputs Outputs Non- Manufacturing The 50,000 ft. view Molding Stamping C Prep C Solvent C Nozzle S . Coverage Thickness Hardness Color Leak Test . Inputs Outputs Manufacturing
  • 18.
    Step 2: Identify All Steps in the Process Identify the process flow steps Tips – Try to show in 3 – 8 Steps Start with the end and the beginning. Then, fill in the middle. Include all value-added and non value-added steps Process steps, inspection/test, rework, scrap points WALK THE PROCESS! A Process Map isn’t done on the computer! While you walk the process you will also be identifying x’s and y’s (next steps)
  • 19.
  • 20.
    Non-Manufacturing Example -Step 2 STEP 1 Answer Phone / Greet Customer STEP 2 Determine Part Number / price / need date STEP 3 Get PO # STEP 4 Identify ship to address, method of shipment STEP 8 Verify plant receipt of order STEP 7 Verify order info - fax to customer / transmit to plant STEP 6 Input order on computer STEP 5 Complete order worksheet
  • 21.
    Step 3: List Output Variables Include all output variables (the y’s). Defines the scope and objectives of the process Indicates where measurements are taken during the process Labels and differentiates between what is and what is not currently measured Defines “In-Process” parameters (y’s) which are measured UPSTREAM from the final output (Y) Tip: May be easier to list the outputs and inputs (Steps 3 and 4) by step before moving on to the next step
  • 22.
  • 23.
    Non-Manufacturing Example -Step 3 STEP 1 Answer Phone / Greet Customer STEP 2 Determine Part Number / price / need date STEP 3 Get PO # STEP 4 Identify ship to address, method of shipment OUTPUTS Prompt answer Live body Customer info Pricing Availability Customer PO Ship to address Method of shipment
  • 24.
    Non-Manufacturing Example -Step 3 (Continued) Complete order info from customer Order in computer All fields completed Promise date Printed confirmation Correct info Confirmation to customer Order sent to plant Completed order entry OUTPUTS STEP 8 Verify plant receipt of order STEP 7 Verify order info - fax to customer / transmit to plant STEP 6 Input order on computer STEP 5 Complete order worksheet
  • 25.
    Step 4: List Input Variables List all input variables (x’s or factors)
  • 26.
    Step 5 -Classify Input Variables Classify the input variables CONTROLLABLE INPUTS (C) NOISE INPUTS (N) STANDARD OPERATING PROCEDURES (S) NOTE: Further experimentation confirms the estimated classification! THESE CAN CHANGE!
  • 27.
    CONTROLLABLE INPUTvariables (C) Input variables (x’s or factors) that can be changed to see the effect on output variables. These are sometimes called Independent Variables x’s that are critical (Key Process Input Variables) x’s that have no effect
  • 28.
    NOISE (N) Inputsthat impact the outputs but are: 1. Uncontrollable 2. Too costly to control 3. Preferably not controlled Example - An environmental variable such as humidity
  • 29.
    STANDARD OPERATING PROCEDURE(S) Inputs that are defined by operating procedures that may be considered “common sense activities” Examples: Training, Cleaning, Preventive Maintenance
  • 30.
  • 31.
    Non-Manufacturing Example -Steps 4&5 Complete order info from customer Order worksheet form C Customer supplied info N Order in computer All fields completed Promise date Printed confirmation Order worksheet C Computer entry screens C Lead time info from mfrg. N Correct info Confirmation to customer Order sent to plant Printed confirmation sheet C Customer contact info N Confirmation procedure C Completed order entry Correct info in computer C Mfrg plant contact C OUTPUTS INPUTS STEP 8 Verify plant receipt of order STEP 7 Verify order info - fax to customer / transmit to plant STEP 6 Input order on computer STEP 5 Complete order worksheet
  • 32.
    Preparing the ProcessMap Team Effort Manufacturing engineers Line operators Line supervisors Maintenance technicians Possible Inputs to Mapping Brainstorming Operator manuals Engineering specifications Operator experience 6M’s Man, Machine (Equipment), Method (Procedures), Measurement, Materials, Mother Nature (Environment) Keep it Simple – Use Excel to allow copying into next tool (Cause and Effect matrix)
  • 33.
    Process Map SummaryProcess Mapping Provides Inputs to Cause and Effect Matrix Potential Failure Mode Effect Analysis Control Plan Capability Studies Experimentation Process Mapping helps us gain process knowledge!
  • 34.
    Your First ProcessMap Assignment 1. Study the flowchart of the Order Pickers Company 2. Create a Process Map individually 3. Compare and discuss your process map with partners
  • 35.
    The OrderPickers Company “Flow Chart” RECEIVE Products Put Away Order Rec’v Pick Consolidate PACK/SHIP KEY: Process Step Inspection/Test Rework Inventory
  • 36.
  • 37.
    A Champion CallsYou, the Six Sigma Green Belt, to Help the Team She needs quality improved to land a big customer –The customer is a national distributor Currently, the quality of our product line is only 2 Sigma The customer will buy all lines if each line meets quality levels Best-In-Class among competitors is 4 Sigma 6 Sigma capability on the CTQ’s will guarantee the business – if able to ship-on-time Potential sales > $1,000,000 annually Scrap, rework, inspection costs exceed $250,000 annually The product family includes several molded products. One product line quality is world-class already and exceeds the expectations of this potential customer
  • 38.
    Process Mapping Exercise2 View the process as a team, one step at a time Observe the operator demonstrating his/her operation based on the written procedures at the station Ask questions of the operator to gain process knowledge about the inputs and outputs at the given step You have 5 minutes to view and question the entire process. After viewing/questioning the process, return with the team to the room to begin constructing the process map and answering Part II of the assignment. FOCUS ON THE PROCESS, NOT THE PEOPLE!
  • 39.
    Exercise to ApplyLearning Observe the factory with your team Create a Process Map Be sure to include all elements of good Process Maps Draw on flipchart Presentations and “Advice”
  • 40.
    Assignment (Part II)Describe the similarities and differences between “ Process Mapping” and “Flowcharting” If the labeling of the inputs is correct, what behaviors and disciplines will be required of the operators? of the line supervision? of the senior management? Who should prepare, complete and assess the maps? What are you looking for? How and when should maps be updated?
  • 41.
    Review Questions -True or False? Use YES/NO Cards For constructing a process map, inputs should be determined while walking and questioning the process with the team Outputs listed on your process map are always measured Process inputs are classified as Controllable or Noise or SOP A process map should reflect the best way a process should operate To make an accurate process map, it is best to do it alone so that you are not distracted by others It is OK for a Belt to draft a Map for the Team to start from Once a process map is constructed, it is never changed
  • 42.
    Process Map Questionsto Verify Quality of Map Does it cover the project scope? Who helped develop the map? Did I get the operators input? Does it reflect current state or the desired process? Are all non value-added steps included? Are all inputs and outputs listed? Were any quick-hits found from this effort? What process steps does the team feel can be eliminated? What characterizes controlled and noise variables? What measurements are taken within the process? What measurements SHOULD be taken throughout the process? Did you and your team “walk the process?” How often? What is the next step and what is the timeline? Is there a lot of waste to warrant a Value Stream Map first?
  • 43.

Editor's Notes

  • #8 !
  • #12 Process maps are not process flow charts
  • #20 Here’s an example
  • #30 .
  • #38 Can still mold critters and coins. Use critters for the failure modes of wire protruding and too hard or soft. Or, make up your own for the critter or coin.
  • #40 See PowerPoint of CR Bug Process Map for example class should get close results to
  • #42 Conduct the quiz orally with the participants: 1 T 2 T 3 T 4 F 5 F 6 T 7 F ALTHOUGH THERE IS NOT MUCH NEED AFTER MEASURE PHASE