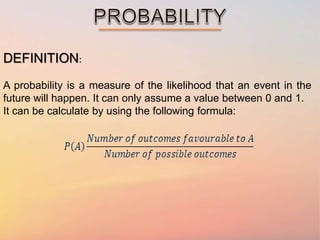
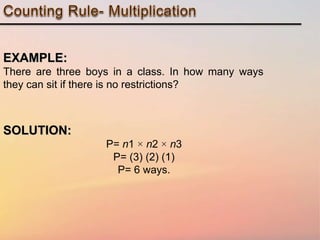
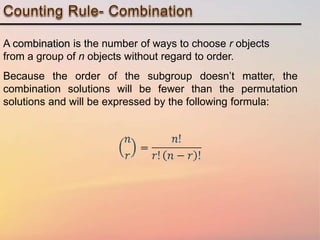
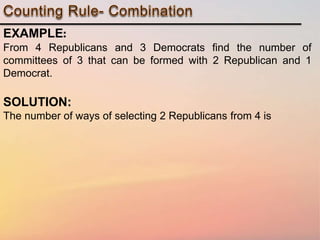
This document defines probability as a measure between 0 and 1 of the likelihood of a future event occurring. It can be calculated using formulas. An event with a probability of 0 is impossible and will never happen, while an event with a probability of 1 is certain and will definitely happen. Examples are provided to demonstrate calculating probabilities of outcomes from dice rolls or seating arrangements. The document also defines permutations as arrangements that consider order important, and provides a formula to calculate permutations. Combinations are defined as arrangements that do not consider order, and a different formula is given to calculate combinations.
A binomial random variable is the number of successes x in n repeated trials of a binomial experiment. The probability distribution of a binomial random variable is called a binomial distribution. Suppose we flip a coin two times and count the number of heads (successes).
Regression Analysis is simplified in this presentation. Starting with simple linear to multiple regression analysis, it covers all the statistics and interpretation of various diagnostic plots. Besides, how to verify regression assumptions and some advance concepts of choosing best models makes the slides more useful SAS program codes of two examples are also included.
Today’s overwhelming number of techniques applicable to data analysis makes it extremely difficult to define the most beneficial approach while considering all the significant variables.
The analysis of variance has been studied from several approaches, the most common of which uses a linear model that relates the response to the treatments and blocks. Note that the model is linear in parameters but may be nonlinear across factor levels. Interpretation is easy when data is balanced across factors but much deeper understanding is needed for unbalanced data.
Analysis of variance (ANOVA) is a collection of statistical models and their associated estimation procedures (such as the "variation" among and between groups) used to analyze the differences among means. ANOVA was developed by the statistician Ronald Fisher. ANOVA is based on the law of total variance, where the observed variance in a particular variable is partitioned into components attributable to different sources of variation. In its simplest form, ANOVA provides a statistical test of whether two or more population means are equal, and therefore generalizes the t-test beyond two means. In other words, the ANOVA is used to test the difference between two or more means.Analysis of variance (ANOVA) is an analysis tool used in statistics that splits an observed aggregate variability found inside a data set into two parts: systematic factors and random factors. The systematic factors have a statistical influence on the given data set, while the random factors do not. Analysts use the ANOVA test to determine the influence that independent variables have on the dependent variable in a regression study.
Sir Ronald Fisher pioneered the development of ANOVA for analyzing results of agricultural experiments.1 Today, ANOVA is included in almost every statistical package, which makes it accessible to investigators in all experimental sciences. It is easy to input a data set and run a simple ANOVA, but it is challenging to choose the appropriate ANOVA for different experimental designs, to examine whether data adhere to the modeling assumptions, and to interpret the results correctly. The purpose of this report, together with the next 2 articles in the Statistical Primer for Cardiovascular Research series, is to enhance understanding of ANVOA and to promote its successful use in experimental cardiovascular research. My colleagues and I attempt to accomplish those goals through examples and explanation, while keeping within reason the burden of notation, technical jargon, and mathematical equations.
this ppt gives you adequate information about Karl Pearsonscoefficient correlation and its calculation. its the widely used to calculate a relationship between two variables. The correlation shows a specific value of the degree of a linear relationship between the X and Y variables. it is also called as The Karl Pearson‘s product-moment correlation coefficient. the value of r is alwys lies between -1 to +1. + 0.1 shows Lower degree of +ve correlation, +0.8 shows Higher degree of +ve correlation.-0.1 shows Lower degree of -ve correlation. -0.8 shows Higher degree of -ve correlation.
Probability ,Binomial distribution, Normal distribution, Poisson’s distributi...AZCPh
Definition of probability, Binomial distribution, Normal distribution Poisson’s distribution, properties – problems .
Mathematical / classical probability equation , The multiplicative law of probability when are not mutually exclusive, THE BINOMIAL DISTRIBUTION – with continuous data, The standard normal probability curve
this presentation includes a brief about the HIPS polymer, its chemical & mechanical properties, manufacturing process and applications in various flieds
Goodbye CLI, hello API: Leveraging network programmability in security incid...Joel W. King
Automation and Orchestration has been the purview of cloud computing and system administration, but now is increasingly important to security operations and network administration. By automating the data collection and corrective action component of incident response, significant time savings can be realized. Corrective actions often need be applied to multiple assets in the organization and automation improves consistency and time savings as well. This talk describes how security and IT orchestration can be integrated through code reuse and integration with APIs.
We demonstrate how Phantom and Ansible can be integrated to automate the incident response data collection, corrective action, and notification.
Artificial Intelligence and Robotics is one of the exciting new frontiers. 2015 was the year that self-driving cars became a reality, robots gained all sorts of new abilities, and many worried about the threat of super-intelligent future AI.
The ground is shifting quickly in this field, with new AI developments announced on a seemingly weekly basis and commercial applications filter through to market.
Speakers include:
- Dr Chris Brauer, Director of Innovation and Senior Lecturer at Goldsmiths, University of London
- Devika Thapar, AI: Watson Financial Services Leader at IBM
- Jonathan Seal, Strategy Director at Mando
- Lorenzo Wood, Chief Innovation Officer, DigitasLBi
We Are OpenStack: Jonathan Bryce, OpenStack FoundationOpenStack
Audience: All levels
About: Fresh from the OpenStack Summit Austin, Jonathan Bryce will cover the latest news and talk about emerging trends in cloud adoption. Hear about recent users, enterprise workload, container integration and developments in the global community.
Speaker Bio: Jonathan Bryce – Executive Director, OpenStack Foundation
Jonathan Bryce, who has spent his career building the cloud, is Executive Director of the OpenStack Foundation. Previously he was a founder of The Rackspace Cloud. He started his career working as a web developer for Rackspace, and during his tenure, he and co-worker Todd Morey had a vision to build a sophisticated web hosting environment where users and businesses alike could turn to design, develop and deploy their ideal web site – all without being responsible for procuring the technology, installing it or making sure it is built to be always available. This vision became The Rackspace Cloud. Since then he has been a major driver of OpenStack, the open source cloud software initiative.
OpenStack Australia Day - Sydney 2016
https://events.aptira.com/openstack-australia-day-sydney-2016/
Permutations and Combinations IIT JEE+Olympiad Lecture 3 Parth Nandedkar
Follows JEE Advanced syllabus, covering these topics:
Difference between Distinguishable and Indistinguishable objects,
Partitioning Indistinguishable Objects,
Counting Number of Groups formed,
No of ways of Choosing objects from a larger set,
Pascal's Triangle and nCr,
Using nCr multiplication to solve Road network problems.
Report on
Millat tractors Financial Highlight
history, vision mission product introduction
Ratio Analysis 2006 to 2014 with graph
Share prices of 10 years of every each day.
We all have good and bad thoughts from time to time and situation to situation. We are bombarded daily with spiraling thoughts(both negative and positive) creating all-consuming feel , making us difficult to manage with associated suffering. Good thoughts are like our Mob Signal (Positive thought) amidst noise(negative thought) in the atmosphere. Negative thoughts like noise outweigh positive thoughts. These thoughts often create unwanted confusion, trouble, stress and frustration in our mind as well as chaos in our physical world. Negative thoughts are also known as “distorted thinking”.
2024.06.01 Introducing a competency framework for languag learning materials ...Sandy Millin
http://sandymillin.wordpress.com/iateflwebinar2024
Published classroom materials form the basis of syllabuses, drive teacher professional development, and have a potentially huge influence on learners, teachers and education systems. All teachers also create their own materials, whether a few sentences on a blackboard, a highly-structured fully-realised online course, or anything in between. Despite this, the knowledge and skills needed to create effective language learning materials are rarely part of teacher training, and are mostly learnt by trial and error.
Knowledge and skills frameworks, generally called competency frameworks, for ELT teachers, trainers and managers have existed for a few years now. However, until I created one for my MA dissertation, there wasn’t one drawing together what we need to know and do to be able to effectively produce language learning materials.
This webinar will introduce you to my framework, highlighting the key competencies I identified from my research. It will also show how anybody involved in language teaching (any language, not just English!), teacher training, managing schools or developing language learning materials can benefit from using the framework.
Model Attribute Check Company Auto PropertyCeline George
In Odoo, the multi-company feature allows you to manage multiple companies within a single Odoo database instance. Each company can have its own configurations while still sharing common resources such as products, customers, and suppliers.
Welcome to TechSoup New Member Orientation and Q&A (May 2024).pdfTechSoup
In this webinar you will learn how your organization can access TechSoup's wide variety of product discount and donation programs. From hardware to software, we'll give you a tour of the tools available to help your nonprofit with productivity, collaboration, financial management, donor tracking, security, and more.
Palestine last event orientationfvgnh .pptxRaedMohamed3
An EFL lesson about the current events in Palestine. It is intended to be for intermediate students who wish to increase their listening skills through a short lesson in power point.
Unit 8 - Information and Communication Technology (Paper I).pdfThiyagu K
This slides describes the basic concepts of ICT, basics of Email, Emerging Technology and Digital Initiatives in Education. This presentations aligns with the UGC Paper I syllabus.
The Roman Empire A Historical Colossus.pdfkaushalkr1407
The Roman Empire, a vast and enduring power, stands as one of history's most remarkable civilizations, leaving an indelible imprint on the world. It emerged from the Roman Republic, transitioning into an imperial powerhouse under the leadership of Augustus Caesar in 27 BCE. This transformation marked the beginning of an era defined by unprecedented territorial expansion, architectural marvels, and profound cultural influence.
The empire's roots lie in the city of Rome, founded, according to legend, by Romulus in 753 BCE. Over centuries, Rome evolved from a small settlement to a formidable republic, characterized by a complex political system with elected officials and checks on power. However, internal strife, class conflicts, and military ambitions paved the way for the end of the Republic. Julius Caesar’s dictatorship and subsequent assassination in 44 BCE created a power vacuum, leading to a civil war. Octavian, later Augustus, emerged victorious, heralding the Roman Empire’s birth.
Under Augustus, the empire experienced the Pax Romana, a 200-year period of relative peace and stability. Augustus reformed the military, established efficient administrative systems, and initiated grand construction projects. The empire's borders expanded, encompassing territories from Britain to Egypt and from Spain to the Euphrates. Roman legions, renowned for their discipline and engineering prowess, secured and maintained these vast territories, building roads, fortifications, and cities that facilitated control and integration.
The Roman Empire’s society was hierarchical, with a rigid class system. At the top were the patricians, wealthy elites who held significant political power. Below them were the plebeians, free citizens with limited political influence, and the vast numbers of slaves who formed the backbone of the economy. The family unit was central, governed by the paterfamilias, the male head who held absolute authority.
Culturally, the Romans were eclectic, absorbing and adapting elements from the civilizations they encountered, particularly the Greeks. Roman art, literature, and philosophy reflected this synthesis, creating a rich cultural tapestry. Latin, the Roman language, became the lingua franca of the Western world, influencing numerous modern languages.
Roman architecture and engineering achievements were monumental. They perfected the arch, vault, and dome, constructing enduring structures like the Colosseum, Pantheon, and aqueducts. These engineering marvels not only showcased Roman ingenuity but also served practical purposes, from public entertainment to water supply.
Read| The latest issue of The Challenger is here! We are thrilled to announce that our school paper has qualified for the NATIONAL SCHOOLS PRESS CONFERENCE (NSPC) 2024. Thank you for your unwavering support and trust. Dive into the stories that made us stand out!
1. DEFINITION:
A probability is a measure of the likelihood that an event in the
future will happen. It can only assume a value between 0 and 1.
It can be calculate by using the following formula:
2. If the probability of an event occurring is 0, then it is an
impossible event means it will never happen.
If the probability of an event occurring is 1, then it is a
certain event, means it will definitely happen.
3. EXAMPLE:
six faced cubical dice is thrown once, what is the probability of
getting an even number?
SOLUTION:
Number of possible outcomes= 6 {1, 2, 3, 4, 5, 6}
Number of targeted outcomes (even numbers)= 3 {2, 4, 6}
4.
5. If an operation can be performed in n1 ways, if for each of
these a second operation can be performed in n2 ways,
third operation can be performed in n3 ways and so on,
then the sequence of k operations can be performed in
n1.n2. n3…..nk ways.
P = n1 × n2 × n3…. nk
Note:
Every event should be different or independent with each other.
6. EXAMPLE:
There are three boys in a class. In how many ways
they can sit if there is no restrictions?
SOLUTION:
P= n1 × n2 × n3
P= (3) (2) (1)
P= 6 ways.
7.
8. A permutation is any arrangement of r objects selected from
n possible objects. The order of arrangement is important in
permutations.
The formula for calculating permutation is:
9. EXAMPLE:
2 markers are drawn from 3 markers. Find the number of
permutations that can be possible?
SOLUTION:
n=3
r= 2
The total number of sample points is
10.
11. A combination is the number of ways to choose r objects
from a group of n objects without regard to order.
Because the order of the subgroup doesn’t matter, the
combination solutions will be fewer than the permutation
solutions and will be expressed by the following formula:
12. EXAMPLE:
From 4 Republicans and 3 Democrats find the number of
committees of 3 that can be formed with 2 Republican and 1
Democrat.
SOLUTION:
The number of ways of selecting 2 Republicans from 4 is