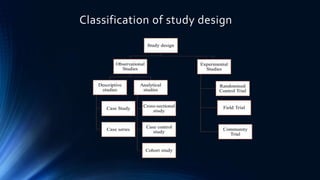
Biostatistics and
research
methodology
Need for research
Definition
• Research is a systematic and scientific method of finding solutions by
obtaining various types of data and systematic analysis of the
multiple aspects of the issues related.
• The techniques or the specific procedure which helps to identify,
choose, process, and analyze information about a subject is called
Research Methodology
Need for research
• To improve the quality
• To innovate new ideas
• To evaluate about the quality of objects or events.
• To predict areas where correlations are already known.
• To correlate the relationships between two phenomena are investigated to
see whether and how they influence each other.
• To compare two or more contrasting cases can be examined to highlight
differences and similarities between them, leading to a better
understanding
• To control an event or situation by understanding what the cause is.
Types of research
• Basic research:
Basic Research motive is to collect data to enhance knowledge. It doesn’t focus on
creating or inventing anything during the process.This type of Research is like an
investigation carried on basic principles, and it is also termed as theoretical
Research.
• Applied research:
A researcher solves problems with already known and proved theories when they
apply applied research methods.
• Problem oriented research:
This type of research methods aims to understand what the exact problem is and
what would be the best solution to this problem.The problem-oriented Research
justifies its name as it focuses on the issue to find out relevant outcomes.
.
• Problem solving research:
• After application of the Problem-oriented research method, there comes a
Problem-solving research method. In this type of research method, the
Researcher tries to understand the exact problem, and starts working on
different measures to solve that problem.
• Qualitative research:
• Qualitative Research focuses on the phenomenon related to quality which
has no connection with numeric values, descriptive, applies to reason etc. It
aims to understand the feeling, meaning, and to explain the situation.
• Quantitative research:
• This type of research method is particular and uses a structured way to
collect data and analyze it to get the results. In this computational and
statistical process is involved to gather and analyze data. It is all about
numbers.This method of Research is dependent on the measurement of
quantity or amount, not the quality of a product.
Experimental design technique
• Experimental research designs are concerned with
examination of effect of independent variable on dependent
variable, where the independent variable is manipulated
through treatment(s) and the effect of those treatments are
observed on dependent variable.
• It is defined as ‘Observations under controlled conditions’.
• Experimental Design - A blueprint of the procedure that
enables the researcher to test his hypothesis by reaching valid
conclusions about relationships between independent and
dependent variables.
• It refers to the conceptual framework within which the
experiment is conducted.
• Experimental research design is one of the
founding quantitative research methods.
• Experimental research are
of two types –
Laboratory and Field research.
Experimental research design
The different types of experimental research design are based on the
how the researcher classifies the subjects according to various
conditions and groups.
Types of Experimental Research Design
There are three primary types of experimental research design:
1. Pre-experimental research design
2. True experimental research design
3. Quasi-experimental research design
Essential characteristics
• An experiment research design must essentially consist of
the following four characteristics :
1. Manipulation
2. Control
3. Randomization
4. Replication
Pre-experimental design
• This research design is considered very weak, because
the researcher has very little control over the
experiment.
TYPES OF PRE-EXPERIMENTAL RESEARCH DESIGN:
I. One-shot case design
II. One-group pretest-posttest design
III. Static-group design
2.True experiment research design
• True experimental research designs are those where
researchers have complete control over the extraneous
variables & can predict confidently that the observed
effect on the dependable variable is only due to the
manipulation of the independent variable.
Quasi experimental design
• Quasi-experimental research is research that resembles
experimental research but is not true experimental research.
• It lacks one condition i.e. randomization
TYPES OF QUASI-EXPERIMENTAL DESIGN
Non-randomized control group design
Time-series design
Need for design of experiment
Introduction
(also referred as experimental design)
It is a statistical tool for improving product design and solving
production problems.
When analysing a process, experiments are often used to evaluate
which process inputs have a significant impact on the process output
and what the target level the inputs should be to achieve a desired
output.
Why DOE is required?
• Reduce time to develop new product.
• Improve performance of existing processes.
• Improve reliability and performance of products.
• Achieve product and process robustness.
• Perform evaluation of materials, design of alternatives, setting component and
system tolerance.
Types of DOE
One factorial
It focuses on only one factor having an impact.
In single factor experiments, ANOVA models are used to compare the
mean response value at different levels.
This process of single factor experiments is often referred as one-way
ANOVA.
Two-factorial
It is the design where two factors are investigated at two levels.
In this firstly individual effects of different groups is determined,
then the interaction of all groups is determined, which will give the required
information like,
- %Variation.
- Design information.
Full factorial
This method look completely at all factors included in the experimentation
with more number of runs.
In full factorial method all possible combinations that are associated with
the factors and their levels are studied.
If we use more than two levels for each factor, we can also study whether
the effect on the response is linear or if there is any curve in the
experimental region for each factor and for the interactions.
(This method is used if we are investigating one factor at different levels)
Fractional factorial
This method look at more factors with fewer runs.
Using a fractional factorial method involves major assumption-
that higher order interactions (those between 3 or more factors) are not
significant.
Response Surface Analysis (RSM)
RSM explores the relationship between several explanatory variables
and one or more response variables.
RSM is an off-line optimization technique, in which usually two
factors are studied but three or more factors can be studied.
With RSM, we run a series of full factorial experiments and map the
response to generate mathematical equations that describe how
factors affect the response.
Graphs
Graphs
• It can be defined as a pictorial presentation or a diagram represents data or values in an
organised manner.
• 2D drawing showing a relationship by means of a line, a series of bars, or other symbols.
• Independent variable is shown on X- axis and dependent variable is shown on the Y-axis.
• The perpendicular intersect at a point called origin.
Types of graph
 Pie Chart
 Histogram
 Cubic Graph
• A pie chart is a type of graph that represents the data in the circular
graph.
• The slices of Pie shows the relative size of data, it is a type of pictorial
representation.
• It requires list of categorical variables & the numerical variable.
• The Pie chart is called circle chart.
• The total value of pie is always 100%.
Pie chart in pharmacy
Histogram
• It is an accurate representation of the
distribution of numerical data.
• The Histogram shows continuous data in
order to column.
• It is same as the line graph but it is
represented as an column format.
• There is no gaps in between bars.
Histogram in pharmacy
Cubic graph
• A cubic graph is a graph in which all vertices
have degree three.
• Cubic graph is a 3- regular graph, these are
also called trivalent graphs.
• Standard form of cubic graph- f(x) = ax3 +
bx2 + cx + d.
• The highest power of X variable is 3.
Cubic graph in pharmacy
Response surface plot
Response surface plots such as surface plots are useful for
establishing desirable response values and operating conditions .
The response surface is viewed as two-dimensional plane where all
points that have the same response are connected to produce
contour lines of constant responses .
One of the most commonly use experimental designs for
optimization is the response surface methodology (RSM) because it
allows evaluating the effects of multiple factors and their interactions
on one or more response variables
These graphs are widely used for analysis and interpretations of
research studies
These plots gives us an idea and pictorial representation in which we
can determined different types of factors simultaneously .
These plots are widely used for response values .
Variations and changes can be analyzed through this plot
It is helpful in recording multiple factors
Contour plot graph
Contour plot graph
• Contour plots are topographical
maps drawn from three-
dimensional data.They are also
called as level plot.
• One variable is represented on the
horizontal axis and a second
variable is represented on the
vertical axis.The third variable is
represented by a color gradient and
isolines (lines of constant value) .
• Contour plots are a way to show
a three-dimensional surface on
two- dimensional plane.
• A contour plot is constructed
from three variables.The X andY
variables are shown on the
horizontal and vertical axes,
respectively.The Z variable is
represented by a colored
gradient.
Contour plot graph uses
• This type of graph is widely used in cartography, where contour lines
on a topological map indicate elevations that are the same.
• Many other disciples use contour graphs include: astrology,
meteorology, and physics.
• Contour lines commonly show altitude (like height of a geographical
features), but they can also be used to show density, brightness, or
electric potential.
Cohort studies
Cohort study
• A study design that identifies and selects two groups of patients out of a population of
interest and places them into one of two cohorts, one cohort who are exposed to an
intervention and another cohort have not been exposed that intervention. They are then
followed over time to see if they develop the outcome of interest at various time points.
• Cohort studies are almost always prospective, but some can be retrospective cohort studies.
• Retrospective cohort studies are also called historical cohort studies and can evaluate a
medical event from a time point in the past that then evaluates data up to the present.
Pictorial depiction
Elements of cohort studies
• Selection of study subjects
• Obtaining data on exposure
• Selection of comparison group
• Follow up
• Analysis
Advantages Disadvantages
• Incidence can be calculated
• Direct estimate of risk
• Allows the conclusion of cause effect
relationship
• Several possible outcome related to
exposure can be studied
simultaneously
• Large population is needed
• Not suitable for rare diseases
• It is time consuming and expensive
• certain administrative problems like loss of
staff ,loss of funding and extensive record
keeping are common
• Problem of attrition of initial cohort is
common
• Study itself may alter people’s behaviour
Observational studies
• An observational study is a study in which the researcher does not actively control
the value of any variable, but simply observes the values as they naturally exist.
• Observational studies are ones where researchers observe the effect of a risk factor,
diagnostic test, treatment or other intervention without trying to change who is or is
not exposed to it.
Types of observational studies
• Cohort studies and case control studies are two types of observational studies:
1. Cohort study or panel study: for research purpose, a cohort is any group of people
who are linked in some way. For instance, a birth includes all people born within a
given time frame.
2. Case control study: Researcher identify people with an existing health problem
(cases) and a similar group without the problem (controls) and then compare them
with respect to an exposure or exposures.
3. Cross- sectional studies: It is a type of study design in which the investigator
measures the outcome and the exposure in the population, and may study their
association.
4. Longitudinal study: correlation research study that involves repeated observations
of the same variables over long periods of time
Experimental studies
Study design
• Study design is a tool on which the credibility of research findings depends.
• Here a relationship between the research question and the factors influencing
them is found out by using different methods.
• Study design depends on a multitude of factors like research question and
goal, skills of the researcher, availability of funds, time duration during which
a study is to be conducted, existing knowledge about the research
question/disease, duration of latency of a disease and on whether it is a rare
or common disease.
• Basically there are two types of study design-
• Observational – It does not involves any intervention by the researcher.
• Experimental – It does involves intervention by the researcher
Classification of study design
Randomized controlled trial
• Randomized controlled trial
Field Trial and Community Trial
• Field trials are the trials that in which data is taken from the ground
and not from some hospital and institution i.e., the data is taken on the
basis of intervention from the healthy population. Like vaccine
effectiveness studies, nutritional interventions, interventions in
maternal and neonatal health (family planning, treatment of sexually
transmitted infections, good prenatal control, kangaroo mother
programs) etc.
• Community trials- It is the same as of the field trials but the major
difference is this type of trail is limited to community of a particular
geographical region. Intervention in dengue or other vector disease,
study of drug abuse in a particular region.
Designing clinical trial, and
various phases
.
Importance of clinical trial
• Clinical trials are important for discovering new treatments for
diseases, as well as new ways to detect, diagnose, and reduce the
chance of developing the disease.
• Clinical trials can show researchers what does and doesn't work in
humans that cannot be learned in the laboratory or in animals.
Types of clinical design
• Parallel
• Cross over
• Factorial
• Randomized withdrawal approach
• Adaptive
• Superiority
• Non Inferiority
Parallel group design
• A parallel design, also called a parallel group study, compares two or
more treatments. Participants are randomly assigned to either group,
treatments are administered, and then the results are compared. It is
the “gold standard” for phase 3 clinical trials.
• A key element of this design is randomization, which places
participants randomly into a group.This randomization reduces the
risk of erroneous results (i.e. statistical bias).
• Although it’s common to include one control group (as in a controlled study), administering a
placebo is not an essential element of the design. Other options include:
1. One treatment group, and oneTreatment-as-Usual group.
2. Two active treatment groups. One of the groups might receive an active comparator (a
treatment that’s known to be effective).
3. One treatment group and a sham comparator.A sham comparator is an intervention that
appears identical to the investigative treatment, but doesn’t contain an active ingredient or
procedure. For example, a person might receive an injection of saline solution instead of the
experimental drug.
4. One treatment group and one “no intervention” group.The no intervention group receives
either no treatment at all, a sham or a placebo.
Blinding, where participants and researchers do not know which group the participant is in or
which treatment is being administered, is usually used to prevent bias.
Comparison to Crossover Designs
• A crossover design (a type of repeated measures design) is where groups
receive all treatments in a different order. For example, groupA might receive
treatment X then treatmentY, while group B receives treatmentY then
treatment X. By comparison, a parallel study has all groups receiving
completely separate treatments in parallel. For example, groupA receives
treatment X while group B receives treatmentY.
• One major advantage of a crossover design is that, for the same number of
participants, the crossover has a higher statistical power than the parallel
study.This is because participants act as their own controls. Parallel studies
require a separate comparison group and therefore tend to be more
expensive.
• On the other hand, crossover designs may have carryover effects, where
effects from one treatment affect the second treatment. If this is a concern, a
parallel design is a better alternative.
Various phases
Various phases
• Clinical trials testing new treatments are divided into different
stages, called phases.The earliest phase trials may look at whether a
drug is safe or the side effects it causes. Later phase trials aim to test
whether a new treatment is better than existing treatments.
• There are 3 main phases of clinical trials – phases 1 to 3. Phase 1 trials
are the earliest phase trials and phase 3 are later phase trials.
Phase o trials
• These studies aim to find out if a drug behaves in the way researchers expect it to
from their laboratory studies.
• Phase 0 studies usually only involve a small number of people and they only have a
very small dose of a drug.The dose of the drug is too small to treat your cancer, but
you are also less likely to have side effects.
• Phase 0 trials aim to find out things such as
1. whether the drug reaches the cancer cells
2. what happens to the drug in the body
3. how cancer cells in the body respond to the drug
It might also require extra scans and give extra samples of blood and cancer tissue
(biopsies) to help the researchers work out what is happening.
Phase 1 trial
• They are usually small trials, recruiting only a few patients. The trial may be open to people with any type of advanced cancer,
usually those who have already had all other available treatments.
Phase 1 trials aim to find out:
1. how much of the drug is safe to give
2. what the side effects are
3. how the body gets rid the of drug
4. if the treatment helps shrink the cancer
• Patients are recruited very slowly onto phase 1 trials. So even though they don't recruit many people, they can take a long time
to complete.
• They are often dose escalation studies.This means that the first few patients that take part (called a cohort or group) are given
a very small dose of the drug. If all goes well, the next group have a slightly higher dose.The dose is gradually increased with
each group.The researchers monitor the side effects people have and how they feel, until they find the best dose.
• In a phase 1 trial you may have lots of blood tests because the researchers look at how your body copes with and gets rid of the
drug.They carefully record any side effects you may have and when you have them.
• The main aim of phase 1 trials is to find out about doses and side effects. They need to do this first, before testing the potential
new treatment to see if it works. Some people taking part may benefit from the new treatment, but many won't.
Phase 2 trials
• Phase 2 is sometimes written as phase II. Not all treatments tested in a phase 1 trial make it to a phase 2 trial.
• These trials can be for people who all have the same type of cancer, or for people who have different types of cancer.
• Phase 2 trials aim to find out:
1. if the new treatment works well enough to be tested in a larger phase 3 trial
2. which types of cancer the treatment works for
3. more about side effects and how to manage them
4. more about the best dose to use
• These treatments have been tested in phase 1 trials, but you may still have side effects that the doctors don't know about.Treatments can
affect people in different ways.
• Phase 2 trials are usually larger than phase 1.There may be up to 100 or so people taking part. Sometimes in a phase 2 trial, a new treatment
is compared with another treatment already in use, or with a dummy drug (placebo).
• Some phase 2 trials are randomised.This means the researchers put the people taking part into treatment groups at random.
Phase 3 trials
• Phase 3 is sometimes written as phase III.These trials compare new treatments with the best currently available treatment (the standard
treatment).
• Phase 3 trials aim to find out:
1. which treatment works better for a particular type of cancer
2. more about the side effects
3. how the treatment affects people’s quality of life
• They may compare standard treatment with:
1. a completely new treatment
2. different doses of the same treatment
3. having the same treatment more, or less, often
4. a new way of giving a standard treatment (radiotherapy for example)
• Phase 3 trials usually involve many more patients than phase 1 or 2.This is because differences in success rates may be small. So, the trial needs
many patients to be able to show the difference.
• Sometimes phase 3 trials involve thousands of people in many different hospitals and even different countries. Most phase 3 trials are randomised.
This means the people taking part are put into treatment groups at random.
Phase 4 trials
• Phase 4 is sometimes written as phase IV.These trials are done after a
drug has been shown to work and has been licensed.
• Phase 4 trials aim to find out:
1. more about the side effects and safety of the drug
2. what the long term risks and benefits are
3. how well the drug works when it’s used more widely
Thank you

Biostatistics and Research Methodology Semester 8

  • 1.
  • 2.
  • 3.
    Definition • Research isa systematic and scientific method of finding solutions by obtaining various types of data and systematic analysis of the multiple aspects of the issues related. • The techniques or the specific procedure which helps to identify, choose, process, and analyze information about a subject is called Research Methodology
  • 4.
    Need for research •To improve the quality • To innovate new ideas • To evaluate about the quality of objects or events. • To predict areas where correlations are already known. • To correlate the relationships between two phenomena are investigated to see whether and how they influence each other. • To compare two or more contrasting cases can be examined to highlight differences and similarities between them, leading to a better understanding • To control an event or situation by understanding what the cause is.
  • 5.
    Types of research •Basic research: Basic Research motive is to collect data to enhance knowledge. It doesn’t focus on creating or inventing anything during the process.This type of Research is like an investigation carried on basic principles, and it is also termed as theoretical Research. • Applied research: A researcher solves problems with already known and proved theories when they apply applied research methods. • Problem oriented research: This type of research methods aims to understand what the exact problem is and what would be the best solution to this problem.The problem-oriented Research justifies its name as it focuses on the issue to find out relevant outcomes. .
  • 6.
    • Problem solvingresearch: • After application of the Problem-oriented research method, there comes a Problem-solving research method. In this type of research method, the Researcher tries to understand the exact problem, and starts working on different measures to solve that problem. • Qualitative research: • Qualitative Research focuses on the phenomenon related to quality which has no connection with numeric values, descriptive, applies to reason etc. It aims to understand the feeling, meaning, and to explain the situation. • Quantitative research: • This type of research method is particular and uses a structured way to collect data and analyze it to get the results. In this computational and statistical process is involved to gather and analyze data. It is all about numbers.This method of Research is dependent on the measurement of quantity or amount, not the quality of a product.
  • 7.
  • 8.
    • Experimental researchdesigns are concerned with examination of effect of independent variable on dependent variable, where the independent variable is manipulated through treatment(s) and the effect of those treatments are observed on dependent variable. • It is defined as ‘Observations under controlled conditions’.
  • 9.
    • Experimental Design- A blueprint of the procedure that enables the researcher to test his hypothesis by reaching valid conclusions about relationships between independent and dependent variables. • It refers to the conceptual framework within which the experiment is conducted. • Experimental research design is one of the founding quantitative research methods. • Experimental research are of two types – Laboratory and Field research.
  • 10.
    Experimental research design Thedifferent types of experimental research design are based on the how the researcher classifies the subjects according to various conditions and groups. Types of Experimental Research Design There are three primary types of experimental research design: 1. Pre-experimental research design 2. True experimental research design 3. Quasi-experimental research design
  • 13.
    Essential characteristics • Anexperiment research design must essentially consist of the following four characteristics : 1. Manipulation 2. Control 3. Randomization 4. Replication
  • 14.
    Pre-experimental design • Thisresearch design is considered very weak, because the researcher has very little control over the experiment. TYPES OF PRE-EXPERIMENTAL RESEARCH DESIGN: I. One-shot case design II. One-group pretest-posttest design III. Static-group design
  • 15.
    2.True experiment researchdesign • True experimental research designs are those where researchers have complete control over the extraneous variables & can predict confidently that the observed effect on the dependable variable is only due to the manipulation of the independent variable.
  • 16.
    Quasi experimental design •Quasi-experimental research is research that resembles experimental research but is not true experimental research. • It lacks one condition i.e. randomization TYPES OF QUASI-EXPERIMENTAL DESIGN Non-randomized control group design Time-series design
  • 17.
    Need for designof experiment
  • 18.
    Introduction (also referred asexperimental design) It is a statistical tool for improving product design and solving production problems. When analysing a process, experiments are often used to evaluate which process inputs have a significant impact on the process output and what the target level the inputs should be to achieve a desired output.
  • 19.
    Why DOE isrequired? • Reduce time to develop new product. • Improve performance of existing processes. • Improve reliability and performance of products. • Achieve product and process robustness. • Perform evaluation of materials, design of alternatives, setting component and system tolerance.
  • 20.
    Types of DOE Onefactorial It focuses on only one factor having an impact. In single factor experiments, ANOVA models are used to compare the mean response value at different levels. This process of single factor experiments is often referred as one-way ANOVA.
  • 21.
    Two-factorial It is thedesign where two factors are investigated at two levels. In this firstly individual effects of different groups is determined, then the interaction of all groups is determined, which will give the required information like, - %Variation. - Design information.
  • 22.
    Full factorial This methodlook completely at all factors included in the experimentation with more number of runs. In full factorial method all possible combinations that are associated with the factors and their levels are studied. If we use more than two levels for each factor, we can also study whether the effect on the response is linear or if there is any curve in the experimental region for each factor and for the interactions. (This method is used if we are investigating one factor at different levels)
  • 23.
    Fractional factorial This methodlook at more factors with fewer runs. Using a fractional factorial method involves major assumption- that higher order interactions (those between 3 or more factors) are not significant.
  • 24.
    Response Surface Analysis(RSM) RSM explores the relationship between several explanatory variables and one or more response variables. RSM is an off-line optimization technique, in which usually two factors are studied but three or more factors can be studied. With RSM, we run a series of full factorial experiments and map the response to generate mathematical equations that describe how factors affect the response.
  • 25.
  • 26.
    Graphs • It canbe defined as a pictorial presentation or a diagram represents data or values in an organised manner. • 2D drawing showing a relationship by means of a line, a series of bars, or other symbols. • Independent variable is shown on X- axis and dependent variable is shown on the Y-axis. • The perpendicular intersect at a point called origin. Types of graph  Pie Chart  Histogram  Cubic Graph
  • 27.
    • A piechart is a type of graph that represents the data in the circular graph. • The slices of Pie shows the relative size of data, it is a type of pictorial representation. • It requires list of categorical variables & the numerical variable. • The Pie chart is called circle chart. • The total value of pie is always 100%.
  • 28.
    Pie chart inpharmacy
  • 29.
    Histogram • It isan accurate representation of the distribution of numerical data. • The Histogram shows continuous data in order to column. • It is same as the line graph but it is represented as an column format. • There is no gaps in between bars.
  • 30.
  • 31.
    Cubic graph • Acubic graph is a graph in which all vertices have degree three. • Cubic graph is a 3- regular graph, these are also called trivalent graphs. • Standard form of cubic graph- f(x) = ax3 + bx2 + cx + d. • The highest power of X variable is 3.
  • 32.
  • 33.
  • 34.
    Response surface plotssuch as surface plots are useful for establishing desirable response values and operating conditions . The response surface is viewed as two-dimensional plane where all points that have the same response are connected to produce contour lines of constant responses . One of the most commonly use experimental designs for optimization is the response surface methodology (RSM) because it allows evaluating the effects of multiple factors and their interactions on one or more response variables
  • 35.
    These graphs arewidely used for analysis and interpretations of research studies These plots gives us an idea and pictorial representation in which we can determined different types of factors simultaneously . These plots are widely used for response values . Variations and changes can be analyzed through this plot It is helpful in recording multiple factors
  • 37.
  • 38.
    Contour plot graph •Contour plots are topographical maps drawn from three- dimensional data.They are also called as level plot. • One variable is represented on the horizontal axis and a second variable is represented on the vertical axis.The third variable is represented by a color gradient and isolines (lines of constant value) .
  • 39.
    • Contour plotsare a way to show a three-dimensional surface on two- dimensional plane. • A contour plot is constructed from three variables.The X andY variables are shown on the horizontal and vertical axes, respectively.The Z variable is represented by a colored gradient.
  • 40.
    Contour plot graphuses • This type of graph is widely used in cartography, where contour lines on a topological map indicate elevations that are the same. • Many other disciples use contour graphs include: astrology, meteorology, and physics. • Contour lines commonly show altitude (like height of a geographical features), but they can also be used to show density, brightness, or electric potential.
  • 41.
  • 42.
    Cohort study • Astudy design that identifies and selects two groups of patients out of a population of interest and places them into one of two cohorts, one cohort who are exposed to an intervention and another cohort have not been exposed that intervention. They are then followed over time to see if they develop the outcome of interest at various time points. • Cohort studies are almost always prospective, but some can be retrospective cohort studies. • Retrospective cohort studies are also called historical cohort studies and can evaluate a medical event from a time point in the past that then evaluates data up to the present.
  • 43.
  • 44.
    Elements of cohortstudies • Selection of study subjects • Obtaining data on exposure • Selection of comparison group • Follow up • Analysis
  • 45.
    Advantages Disadvantages • Incidencecan be calculated • Direct estimate of risk • Allows the conclusion of cause effect relationship • Several possible outcome related to exposure can be studied simultaneously • Large population is needed • Not suitable for rare diseases • It is time consuming and expensive • certain administrative problems like loss of staff ,loss of funding and extensive record keeping are common • Problem of attrition of initial cohort is common • Study itself may alter people’s behaviour
  • 46.
  • 47.
    • An observationalstudy is a study in which the researcher does not actively control the value of any variable, but simply observes the values as they naturally exist. • Observational studies are ones where researchers observe the effect of a risk factor, diagnostic test, treatment or other intervention without trying to change who is or is not exposed to it.
  • 48.
    Types of observationalstudies • Cohort studies and case control studies are two types of observational studies: 1. Cohort study or panel study: for research purpose, a cohort is any group of people who are linked in some way. For instance, a birth includes all people born within a given time frame. 2. Case control study: Researcher identify people with an existing health problem (cases) and a similar group without the problem (controls) and then compare them with respect to an exposure or exposures. 3. Cross- sectional studies: It is a type of study design in which the investigator measures the outcome and the exposure in the population, and may study their association. 4. Longitudinal study: correlation research study that involves repeated observations of the same variables over long periods of time
  • 49.
  • 50.
    Study design • Studydesign is a tool on which the credibility of research findings depends. • Here a relationship between the research question and the factors influencing them is found out by using different methods. • Study design depends on a multitude of factors like research question and goal, skills of the researcher, availability of funds, time duration during which a study is to be conducted, existing knowledge about the research question/disease, duration of latency of a disease and on whether it is a rare or common disease. • Basically there are two types of study design- • Observational – It does not involves any intervention by the researcher. • Experimental – It does involves intervention by the researcher
  • 51.
  • 52.
  • 54.
    Randomized controlled trial •Randomized controlled trial
  • 55.
    Field Trial andCommunity Trial • Field trials are the trials that in which data is taken from the ground and not from some hospital and institution i.e., the data is taken on the basis of intervention from the healthy population. Like vaccine effectiveness studies, nutritional interventions, interventions in maternal and neonatal health (family planning, treatment of sexually transmitted infections, good prenatal control, kangaroo mother programs) etc. • Community trials- It is the same as of the field trials but the major difference is this type of trail is limited to community of a particular geographical region. Intervention in dengue or other vector disease, study of drug abuse in a particular region.
  • 56.
    Designing clinical trial,and various phases .
  • 57.
    Importance of clinicaltrial • Clinical trials are important for discovering new treatments for diseases, as well as new ways to detect, diagnose, and reduce the chance of developing the disease. • Clinical trials can show researchers what does and doesn't work in humans that cannot be learned in the laboratory or in animals.
  • 58.
    Types of clinicaldesign • Parallel • Cross over • Factorial • Randomized withdrawal approach • Adaptive • Superiority • Non Inferiority
  • 59.
    Parallel group design •A parallel design, also called a parallel group study, compares two or more treatments. Participants are randomly assigned to either group, treatments are administered, and then the results are compared. It is the “gold standard” for phase 3 clinical trials. • A key element of this design is randomization, which places participants randomly into a group.This randomization reduces the risk of erroneous results (i.e. statistical bias).
  • 60.
    • Although it’scommon to include one control group (as in a controlled study), administering a placebo is not an essential element of the design. Other options include: 1. One treatment group, and oneTreatment-as-Usual group. 2. Two active treatment groups. One of the groups might receive an active comparator (a treatment that’s known to be effective). 3. One treatment group and a sham comparator.A sham comparator is an intervention that appears identical to the investigative treatment, but doesn’t contain an active ingredient or procedure. For example, a person might receive an injection of saline solution instead of the experimental drug. 4. One treatment group and one “no intervention” group.The no intervention group receives either no treatment at all, a sham or a placebo. Blinding, where participants and researchers do not know which group the participant is in or which treatment is being administered, is usually used to prevent bias.
  • 62.
    Comparison to CrossoverDesigns • A crossover design (a type of repeated measures design) is where groups receive all treatments in a different order. For example, groupA might receive treatment X then treatmentY, while group B receives treatmentY then treatment X. By comparison, a parallel study has all groups receiving completely separate treatments in parallel. For example, groupA receives treatment X while group B receives treatmentY. • One major advantage of a crossover design is that, for the same number of participants, the crossover has a higher statistical power than the parallel study.This is because participants act as their own controls. Parallel studies require a separate comparison group and therefore tend to be more expensive. • On the other hand, crossover designs may have carryover effects, where effects from one treatment affect the second treatment. If this is a concern, a parallel design is a better alternative.
  • 65.
  • 66.
    Various phases • Clinicaltrials testing new treatments are divided into different stages, called phases.The earliest phase trials may look at whether a drug is safe or the side effects it causes. Later phase trials aim to test whether a new treatment is better than existing treatments. • There are 3 main phases of clinical trials – phases 1 to 3. Phase 1 trials are the earliest phase trials and phase 3 are later phase trials.
  • 68.
    Phase o trials •These studies aim to find out if a drug behaves in the way researchers expect it to from their laboratory studies. • Phase 0 studies usually only involve a small number of people and they only have a very small dose of a drug.The dose of the drug is too small to treat your cancer, but you are also less likely to have side effects. • Phase 0 trials aim to find out things such as 1. whether the drug reaches the cancer cells 2. what happens to the drug in the body 3. how cancer cells in the body respond to the drug It might also require extra scans and give extra samples of blood and cancer tissue (biopsies) to help the researchers work out what is happening.
  • 69.
    Phase 1 trial •They are usually small trials, recruiting only a few patients. The trial may be open to people with any type of advanced cancer, usually those who have already had all other available treatments. Phase 1 trials aim to find out: 1. how much of the drug is safe to give 2. what the side effects are 3. how the body gets rid the of drug 4. if the treatment helps shrink the cancer • Patients are recruited very slowly onto phase 1 trials. So even though they don't recruit many people, they can take a long time to complete. • They are often dose escalation studies.This means that the first few patients that take part (called a cohort or group) are given a very small dose of the drug. If all goes well, the next group have a slightly higher dose.The dose is gradually increased with each group.The researchers monitor the side effects people have and how they feel, until they find the best dose. • In a phase 1 trial you may have lots of blood tests because the researchers look at how your body copes with and gets rid of the drug.They carefully record any side effects you may have and when you have them. • The main aim of phase 1 trials is to find out about doses and side effects. They need to do this first, before testing the potential new treatment to see if it works. Some people taking part may benefit from the new treatment, but many won't.
  • 70.
    Phase 2 trials •Phase 2 is sometimes written as phase II. Not all treatments tested in a phase 1 trial make it to a phase 2 trial. • These trials can be for people who all have the same type of cancer, or for people who have different types of cancer. • Phase 2 trials aim to find out: 1. if the new treatment works well enough to be tested in a larger phase 3 trial 2. which types of cancer the treatment works for 3. more about side effects and how to manage them 4. more about the best dose to use • These treatments have been tested in phase 1 trials, but you may still have side effects that the doctors don't know about.Treatments can affect people in different ways. • Phase 2 trials are usually larger than phase 1.There may be up to 100 or so people taking part. Sometimes in a phase 2 trial, a new treatment is compared with another treatment already in use, or with a dummy drug (placebo). • Some phase 2 trials are randomised.This means the researchers put the people taking part into treatment groups at random.
  • 71.
    Phase 3 trials •Phase 3 is sometimes written as phase III.These trials compare new treatments with the best currently available treatment (the standard treatment). • Phase 3 trials aim to find out: 1. which treatment works better for a particular type of cancer 2. more about the side effects 3. how the treatment affects people’s quality of life • They may compare standard treatment with: 1. a completely new treatment 2. different doses of the same treatment 3. having the same treatment more, or less, often 4. a new way of giving a standard treatment (radiotherapy for example) • Phase 3 trials usually involve many more patients than phase 1 or 2.This is because differences in success rates may be small. So, the trial needs many patients to be able to show the difference. • Sometimes phase 3 trials involve thousands of people in many different hospitals and even different countries. Most phase 3 trials are randomised. This means the people taking part are put into treatment groups at random.
  • 72.
    Phase 4 trials •Phase 4 is sometimes written as phase IV.These trials are done after a drug has been shown to work and has been licensed. • Phase 4 trials aim to find out: 1. more about the side effects and safety of the drug 2. what the long term risks and benefits are 3. how well the drug works when it’s used more widely
  • 73.