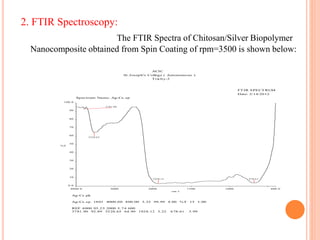
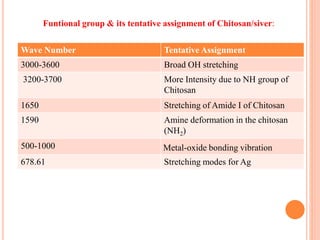
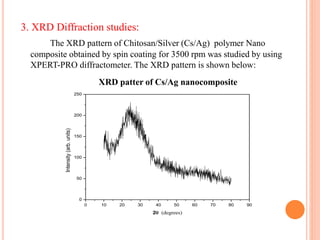
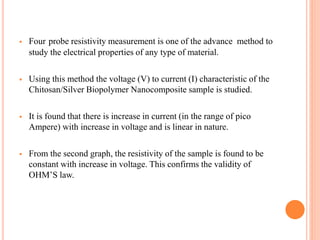
SYNTHESIS AND CHARACTERIZATION
OF CHITOSAN/SILVER BIOPOLYMER
NANOCOMPOSITES
Submitted by
SUMAN NEPAL
Reg: No: 10PPH832
Under the Guidance of
Dr. B. PRAKASH M.Sc., M.Phil.,
DEPARTMENT OF PHYSICS
St. JOSEPH’S COLLEGE (Autonomous)
Nationally Re-Accredited with A+ Grade College with Potential for
Excellence
(Affiliated to Bharathidasan University)
Tiruchirappalli-620 002
April-2012
Chapter Title
I
Literature Survey
Polymer
Chitosan Bio Polymer
Silver Nanoparticle
II
Experimental Methods
Synthesis
Ultra Sonication Method
Spin Coating Method
III Characterization Technique
IV
Result & Discussion
UV-Vis Spectroscopy
FTIR Spectroscopy
XRD Method
LCR Method: Dielectric Constant
Four Probe Resistivity Measurement
V Conclusion
VI Bibliography
CONTENT
I. LITERATURE SURVEY:
Polymer:
It is a large molecule (macro molecule) composed of repeating structural
units typically connected by covalent bonds. The structural unit that is
repeating in the structure is called Monomers.
Classification of Polymers:
Polymer
Natural/Bio Polymer Synthetic/Industrial polymer
e.g.-Chitosan, Protein e.g.-Polypropylene(PP), Teflon
CHITOSAN BIOPOLYMER:
 It is a derivative of Chitin, which is a biopolymer.
 Chitin is a natural polymer which is found abundant in nature.
 It is found on exoskeleton of Crustaceans (crabs and shrimp) and cells of
Fungi.
 Chitosan is a derivative of Chitin and is obtained by deacetylation of the
later.
 Chemical structure of Chitosan:
USES OF CHITOSAN:
Wastewater treatment -Removal of Metal ions
-Hocculant/Coagulant:
-Proteins
-Dye
-Amino Acid
Food Industry -Removal of Dye, Suspended solids
-Preservative
-Color Stabilization
-Animal Feed Additive
Medical -Bandages
-Blood Cholesterol Control
-Controlled Release of Drugs
-Skin Burn
-Contact Lens
Biotechnology -Enzyme Immobilization
-Protein Separation
Agriculture -Seed Coating
-Fertilizer
-Controlled Agrochemical Release
Cosmetics -Moisturizer
-Face, Hand and Body Creams
SILVER NANOPARTICLE:
 Nanoparticles are microscopic particles of dimension between 1-100nm,
where, 1nm =
 The properties like Mechanical, Thermal, Electrical etc. of the particle
changes dramatically from size ranging to macroscopic to microscopic
dimensions.
 Silver Nanoparticles are the particles of silver(Ag) whose size is in the
range of 1-100nm.
Synthesis of silver nanoparticle:
Ion implantation:
 The particles grow in a substrate by the bombardments of silver ions.
Wet chemistry:
 Reduction of silver salt, like silver nitrate with a reducing agent like
sodium borohydride in the presence of colloidal stabilizer.
10-9m
USES OF SILVER NANO PARTICLE :
Silver nanoparticle has immense applications in medical fields.
 Silver ions are bioactive and in sufficient concentration readily kills
bacteria in vitro.
 Wound dressings containing silver are in use due to anti-bacterial property
of silver nanoparticle.
 It is used in bone prostheses, reconstructive orthopedic surgery and cardiac
devices.
 In short the uses of silver nanoparticles are listed below:
 Medical use:
1. Bone cement
2. Surgical instruments
3. Wound dressings
4. Diagnostic applications like Biosensors
5. Antibacterial agent, incorporated in wound dressings, cosmetics,
footwear, plastics etc.
6. Has efficient optical and electrical applications.
II. EXPERIMENTAL METHODS:
The Chitosan/Silver Biopolymer Nanocomposite were synthesized by following two
methods:
1. Ultra Sonication Method
2. Spin Coating Method
Chemicals used:
 Chitosan
 Silver Nitrate
 Sodium Hydro-oxide
 Acetic Acid
 Acetone
Following formula is used to calculate the required amount of silver nitrate used as a solute.
Weight of Silver Nitrate= in grams
Where, M is Molarity in moles/litre,
X is mol.weight of silver nitrate =169.87gm/mol
V is the volume of the solvent (stack solution of Acetic Acid)
Synthesis:
 For 0.1M silver nitrate, M=0.1M, amount of silver nitrate required to dissolve
in 100ml of Acetic Acid is equal to 1.698gm.
 1%(V/V) Stack solution of Acetic Acid was prepared and magnetic stirring was
allowed for 24 hours.
 1.698gm of silver nitrate was added to 100ml of stack solution and again
magnetic stirring was allowed till the complete homogeneous solution was
obtained.
 0.5gm of Chitosan was again dissolved in the above solution and magnetic
stirring was allowed for 24 hours and was Sonicated for 30 minutes.
 For the successive Sonication time, 10ml of the solution was poured on petry
dish and in this way 5 samples were prepared and kept in oven for 4 hours in
constant temperature of 68C.
 The film of chitosan/silver bio polymer nanocomposites were prepared by Spin
Coating method. It is one of the method in which the samples are coated on
substrate (glass plates) by spinning the coater. By the action centrifugal force
the films are coated.
 In this way 3 samples were prepared for spinning rpm of 2500, 3000 and 3500
respectively and characterization was taken.
III. CHARACTERIZATION TECHNIQUES:
The sample obtained by Spin Coating method was allowed for following
characterization techniques:
1. Ultraviolet Vis Absorption Spectroscopy
2. FTIR Spectroscopy
3. XRD Diffraction
The electrical and dielectric properties and its variation with Frequency were
studied from:
a. Four Probe Resistivity Measurement
b. Dielectric constant Measurement (LCR Method)
IV. RESULTS AND DISCUSSIONS:
1. UV-Vis Spectroscopy:
The Absorption Spectra of Chitosan/Silver Biopolymer
Nanocomposite obtained from Spin Coating of rpm=3500 is shown
below:
ACIC
St.Joseph's College( Autonomous)
Trichy-2
UV spectrum
Spectrum Name: AG-CS.SP
Instrument Model: Lambda 35
Date: 2/13/2012
320.0 400 500 600 700 800 900 1000 1100.0
-0.040
-0.03
-0.02
-0.01
0.00
0.01
0.02
0.03
0.04
0.05
0.06
0.07
0.08
0.09
0.100
nm
A
427.07,0.045360
1.0 1.5 2.0 2.5 3.0 3.5 4.0 4.5
0.00E+000
2.00E+011
4.00E+011
6.00E+011
8.00E+011
1.00E+012
1.20E+012
1.40E+012
1.60E+012
(h)
2
E=h(eV)
1.0 1.5 2.0 2.5 3.0 3.5 4.0 4.5
0.006
0.008
0.010
0.012
0.014
0.016
0.018
0.020
0.022
0.024
0.026
E=h(eV)
Extinctioncoefficient(K)
Optical band Gap of Cs/Ag
Variation of extinction
coefficient(K) with energy
 From the UV-Vis –NIR spectra, the presence of Ag nanoparticle was
observed in the frequency range of 300 to 500 nm.
 Compared with pure Cs thin films, Cs/Ag nanocomposite showed
absorption band at 427.07nm which attributes the presence of silver
nanoparticle.
 According to L.H.Li et al , the absorption band for macro crystalline Ag
showed a peak about 457nm which is shifted to 427.07nm. The difference
in the peak reveales the presence of Ag particle of nanometer size.
 From the transmittance spectra of the film it can be predicted that the
percentage of transmittance value was increased from 40% to 106% by
increasing the rpm while spin coating.
 The variation of energy E=hν with (αhν)2 is shown in previous slide from
which a extrapolated line along x-axis gives Band Gap of 3eV.
 The graph that shows the variation of Extinction coefficient (K) with
Energy is shown in previous slide from which it predicts with increase in
energy the extinction coefficient decreases.
2. FTIR Spectroscopy:
The FTIR Spectra of Chitosan/Silver Biopolymer
Nanocomposite obtained from Spin Coating of rpm=3500 is shown below:
FTIR SPECTRUM
ACIC
St.Joseph's College ( Autonomous )
Trichy-2
Spectrum Name: Ag-Cs.sp
Date: 2/14/2012
Ag-Cs .pk
Ag-Cs .sp 1801 4000.00 400.00 3.22 99.99 4.00 %T 15 1.00
REF 4000 95.25 2000 5.74 600
3781.90 92.89 3528.65 64.90 1928.12 3.22 678.61 3.99
4000.0 3000 2000 1500 1000 400.0
0.0
10
20
30
40
50
60
70
80
90
100.0
cm-1
%T
3781.90
3528.65
1928.12 678.61
Wave Number Tentative Assignment
3000-3600 Broad OH stretching
3200-3700 More Intensity due to NH group of
Chitosan
1650 Stretching of Amide I of Chitosan
1590 Amine deformation in the chitosan
(NH2)
500-1000 Metal-oxide bonding vibration
678.61 Stretching modes for Ag
Funtional group & its tentative assignment of Chitosan/siver:
 The recorded spectra of the sample showed the functional groups and other
modes of vibrations. Some of the main characteristic absorption peak in
the sample and their tentative assignment are listed on the table.
 According to S.W. Ali et al , absorption band at 3424.11 cm-1, indicates
the combined peak of the NH2 and OH group stretrching vibration in
chitosan.
 Also by studying the spectra of the sample, a shift from 3424.11 cm-1 to
3528.65 cm-1 shows the doping of nanoparticle on the matrix of Chitosan.
 The peak at 678.61cm-1 conforms the presence of silver nano particle on the
chitosan bio polymer.
 Binding of Ag with N of the Amine and Amide groups results in decreasing
of intensity of Amine and Amide peak at 1633.59 cm-1. It also indicates the
binding of Ag with O and N with those groups.
3. XRD Diffraction studies:
The XRD pattern of Chitosan/Silver (Cs/Ag) polymer Nano
composite obtained by spin coating for 3500 rpm was studied by using
XPERT-PRO diffractometer. The XRD pattern is shown below:
0 10 20 30 40 50 60 70 80 90
0
50
100
150
200
250
Intensity(arb.units)
2 (degrees)
XRD patter of Cs/Ag nanocomposite
 The range of the XRD spectrum is from 100 to 800.
 Form the literature the XRD pattern of the chitosan showed characteristics
peaks of 10.30 and 23.50,aparna et al,.
 The diffraction pattern of Cs/Ag showed a characteristic peaks at 38.30 and
670, L-H.Li et al.
 Also the charecteristic peak at 10.30 of Chitosan/Silver is sharp that
indicates the uniform distribution of silver nanoparticle on the chitosan
matrix.
 From the XRD pattern, the presence of Silver Nanoparticle is confirmed in
the matrix of Chitosan Bio polymer.
4. Dielectric Constant Measurement (LCR Method):
The variation of real and Imaginary component of dielectric constant with
frequency is shown below:
100 1000 10000 100000
0.0015
0.0020
0.0025
0.0030
0.0035
0.0040
0.0045
0.0050
0.0055
Frequency (Hz)
'
100 1000 10000 100000
-0.0005
0.0000
0.0005
0.0010
0.0015
0.0020
0.0025
0.0030
0.0035
0.0040
"
Frequency (Hz)
Real part of dielectric constant
Imaginary part of dielectric
constant
 The real 𝜀’ ans imaginary 𝜀” components of the dielectric constants were
calculated from the following relations:
𝜀”= 𝜀’D
Where, 𝜀0 is the permittivity of the free space (8.854 10-34 Farads/meter),
A is the area of the electrodes,
d is the thickness of the sample,
D is the Dissipation factor.
 The Dielectric constant describes the stored energy while the Dielectric loss
describes the dissipated energy.
 The real and imaginary part of dielectric constant decreases with increase in
Frequency. However the decrease in ε’ is more rapid than ε”.
 Decrease in dielectric constant with increase in Frequency is due to
decrease in polarization.
5. Four Probe Resistivity Measurement:
The following graph shows the V to I characteristic of the sample.
0 5 10 15 20 25
0
500
1000
1500
2000
2500
Current(PA)
Voltage(V)
0 5 10 15 20 25
0
2
4
6
8
10
12
14
RESISTANCEG
VOLTAGE (v)
Voltage Vs Resistance
Voltage (v) to Current (I)
characteristics
 Four probe resistivity measurement is one of the advance method to
study the electrical properties of any type of material.
 Using this method the voltage (V) to current (I) characteristic of the
Chitosan/Silver Biopolymer Nanocomposite sample is studied.
 It is found that there is increase in current (in the range of pico
Ampere) with increase in voltage and is linear in nature.
 From the second graph, the resistivity of the sample is found to be
constant with increase in voltage. This confirms the validity of
OHM’S law.
V. CONCLUSION:
 Chitosan /Silver(Ag) polymer nano composite films were
synthesized by Ultra Sonication method.
 The basic concepts and theories behind the polymers ,
nanocomposites and characterization techniques have been
understood.
 The XRD studies confirmed the presence of silver nanoparticles in
the chitosan polymer matrix.
 The functional groups present in the chitosan/silver biopolymer
nanocomposite films are confirmed by FTIR analysis.
 The functional group and modes of vibration were well matched
with the literature data.
 The electrical properties of the samples were characterized by LCR
measurement method.
 It was found that the dielectric constant decrease with increase in
frequency due to decrease in polarization.
 The absorption and transmittance spectra of the sample are obtained
by UV-Vis spectroscopy. The optical band gap is obtained to be 3eV.
 The V to I characteristic of the sample is studied by Four Probe
method.
VI. BIBLIOGRAPHY:
 Li-Hua Li, Jian-Cheng /deng, Hui-Ren Deng, Zi-Ling Liu, Xiao-Li
Li, Chemical engineering journal 160(2010)378-382
 Muhammed Rafeeq P E, Junise V, Saraswathi R. Krishnan P.N,
ChemPhysChem, 761(2001)25-35
 Maribel G. Guzman, Jean Dille, Stephan Godet, World Academy of
Science, Engineering and Technology 43(2008)
 Aparna,ChemPhysChem 2005,6,1221-1231
 S.Wazed Ali, S.Rajendran, Mangala Joshi, Carbohydrate
Polymer,83(2011)438-446
 WANG ChengLin, SUN Lan, XIE,Kun Peng & LIN Chang Jian,
Science in China series B:Chemistry 2009
 R.R. Khaydarov, R. A. Khaydarov, S.Evgra Fova and Y.Estrin, Silver
nano particle as an anti microbial agent
 G. Cruz, G. Ribelles, M.S. Sanchez, Journal of Biomedical
Materials Research part B: Applied biomaterials, (2007), 303.
thank you

Presentation1 832

  • 1.
    SYNTHESIS AND CHARACTERIZATION OFCHITOSAN/SILVER BIOPOLYMER NANOCOMPOSITES Submitted by SUMAN NEPAL Reg: No: 10PPH832 Under the Guidance of Dr. B. PRAKASH M.Sc., M.Phil., DEPARTMENT OF PHYSICS St. JOSEPH’S COLLEGE (Autonomous) Nationally Re-Accredited with A+ Grade College with Potential for Excellence (Affiliated to Bharathidasan University) Tiruchirappalli-620 002 April-2012
  • 2.
    Chapter Title I Literature Survey Polymer ChitosanBio Polymer Silver Nanoparticle II Experimental Methods Synthesis Ultra Sonication Method Spin Coating Method III Characterization Technique IV Result & Discussion UV-Vis Spectroscopy FTIR Spectroscopy XRD Method LCR Method: Dielectric Constant Four Probe Resistivity Measurement V Conclusion VI Bibliography CONTENT
  • 3.
    I. LITERATURE SURVEY: Polymer: Itis a large molecule (macro molecule) composed of repeating structural units typically connected by covalent bonds. The structural unit that is repeating in the structure is called Monomers. Classification of Polymers: Polymer Natural/Bio Polymer Synthetic/Industrial polymer e.g.-Chitosan, Protein e.g.-Polypropylene(PP), Teflon
  • 4.
    CHITOSAN BIOPOLYMER:  Itis a derivative of Chitin, which is a biopolymer.  Chitin is a natural polymer which is found abundant in nature.  It is found on exoskeleton of Crustaceans (crabs and shrimp) and cells of Fungi.  Chitosan is a derivative of Chitin and is obtained by deacetylation of the later.  Chemical structure of Chitosan:
  • 5.
    USES OF CHITOSAN: Wastewatertreatment -Removal of Metal ions -Hocculant/Coagulant: -Proteins -Dye -Amino Acid Food Industry -Removal of Dye, Suspended solids -Preservative -Color Stabilization -Animal Feed Additive Medical -Bandages -Blood Cholesterol Control -Controlled Release of Drugs -Skin Burn -Contact Lens Biotechnology -Enzyme Immobilization -Protein Separation Agriculture -Seed Coating -Fertilizer -Controlled Agrochemical Release Cosmetics -Moisturizer -Face, Hand and Body Creams
  • 6.
    SILVER NANOPARTICLE:  Nanoparticlesare microscopic particles of dimension between 1-100nm, where, 1nm =  The properties like Mechanical, Thermal, Electrical etc. of the particle changes dramatically from size ranging to macroscopic to microscopic dimensions.  Silver Nanoparticles are the particles of silver(Ag) whose size is in the range of 1-100nm. Synthesis of silver nanoparticle: Ion implantation:  The particles grow in a substrate by the bombardments of silver ions. Wet chemistry:  Reduction of silver salt, like silver nitrate with a reducing agent like sodium borohydride in the presence of colloidal stabilizer. 10-9m
  • 7.
    USES OF SILVERNANO PARTICLE : Silver nanoparticle has immense applications in medical fields.  Silver ions are bioactive and in sufficient concentration readily kills bacteria in vitro.  Wound dressings containing silver are in use due to anti-bacterial property of silver nanoparticle.  It is used in bone prostheses, reconstructive orthopedic surgery and cardiac devices.  In short the uses of silver nanoparticles are listed below:  Medical use: 1. Bone cement 2. Surgical instruments 3. Wound dressings 4. Diagnostic applications like Biosensors 5. Antibacterial agent, incorporated in wound dressings, cosmetics, footwear, plastics etc. 6. Has efficient optical and electrical applications.
  • 8.
    II. EXPERIMENTAL METHODS: TheChitosan/Silver Biopolymer Nanocomposite were synthesized by following two methods: 1. Ultra Sonication Method 2. Spin Coating Method Chemicals used:  Chitosan  Silver Nitrate  Sodium Hydro-oxide  Acetic Acid  Acetone Following formula is used to calculate the required amount of silver nitrate used as a solute. Weight of Silver Nitrate= in grams Where, M is Molarity in moles/litre, X is mol.weight of silver nitrate =169.87gm/mol V is the volume of the solvent (stack solution of Acetic Acid)
  • 9.
    Synthesis:  For 0.1Msilver nitrate, M=0.1M, amount of silver nitrate required to dissolve in 100ml of Acetic Acid is equal to 1.698gm.  1%(V/V) Stack solution of Acetic Acid was prepared and magnetic stirring was allowed for 24 hours.  1.698gm of silver nitrate was added to 100ml of stack solution and again magnetic stirring was allowed till the complete homogeneous solution was obtained.  0.5gm of Chitosan was again dissolved in the above solution and magnetic stirring was allowed for 24 hours and was Sonicated for 30 minutes.  For the successive Sonication time, 10ml of the solution was poured on petry dish and in this way 5 samples were prepared and kept in oven for 4 hours in constant temperature of 68C.  The film of chitosan/silver bio polymer nanocomposites were prepared by Spin Coating method. It is one of the method in which the samples are coated on substrate (glass plates) by spinning the coater. By the action centrifugal force the films are coated.  In this way 3 samples were prepared for spinning rpm of 2500, 3000 and 3500 respectively and characterization was taken.
  • 10.
    III. CHARACTERIZATION TECHNIQUES: Thesample obtained by Spin Coating method was allowed for following characterization techniques: 1. Ultraviolet Vis Absorption Spectroscopy 2. FTIR Spectroscopy 3. XRD Diffraction The electrical and dielectric properties and its variation with Frequency were studied from: a. Four Probe Resistivity Measurement b. Dielectric constant Measurement (LCR Method)
  • 11.
    IV. RESULTS ANDDISCUSSIONS: 1. UV-Vis Spectroscopy: The Absorption Spectra of Chitosan/Silver Biopolymer Nanocomposite obtained from Spin Coating of rpm=3500 is shown below: ACIC St.Joseph's College( Autonomous) Trichy-2 UV spectrum Spectrum Name: AG-CS.SP Instrument Model: Lambda 35 Date: 2/13/2012 320.0 400 500 600 700 800 900 1000 1100.0 -0.040 -0.03 -0.02 -0.01 0.00 0.01 0.02 0.03 0.04 0.05 0.06 0.07 0.08 0.09 0.100 nm A 427.07,0.045360
  • 12.
    1.0 1.5 2.02.5 3.0 3.5 4.0 4.5 0.00E+000 2.00E+011 4.00E+011 6.00E+011 8.00E+011 1.00E+012 1.20E+012 1.40E+012 1.60E+012 (h) 2 E=h(eV) 1.0 1.5 2.0 2.5 3.0 3.5 4.0 4.5 0.006 0.008 0.010 0.012 0.014 0.016 0.018 0.020 0.022 0.024 0.026 E=h(eV) Extinctioncoefficient(K) Optical band Gap of Cs/Ag Variation of extinction coefficient(K) with energy
  • 13.
     From theUV-Vis –NIR spectra, the presence of Ag nanoparticle was observed in the frequency range of 300 to 500 nm.  Compared with pure Cs thin films, Cs/Ag nanocomposite showed absorption band at 427.07nm which attributes the presence of silver nanoparticle.  According to L.H.Li et al , the absorption band for macro crystalline Ag showed a peak about 457nm which is shifted to 427.07nm. The difference in the peak reveales the presence of Ag particle of nanometer size.  From the transmittance spectra of the film it can be predicted that the percentage of transmittance value was increased from 40% to 106% by increasing the rpm while spin coating.  The variation of energy E=hν with (αhν)2 is shown in previous slide from which a extrapolated line along x-axis gives Band Gap of 3eV.  The graph that shows the variation of Extinction coefficient (K) with Energy is shown in previous slide from which it predicts with increase in energy the extinction coefficient decreases.
  • 14.
    2. FTIR Spectroscopy: TheFTIR Spectra of Chitosan/Silver Biopolymer Nanocomposite obtained from Spin Coating of rpm=3500 is shown below: FTIR SPECTRUM ACIC St.Joseph's College ( Autonomous ) Trichy-2 Spectrum Name: Ag-Cs.sp Date: 2/14/2012 Ag-Cs .pk Ag-Cs .sp 1801 4000.00 400.00 3.22 99.99 4.00 %T 15 1.00 REF 4000 95.25 2000 5.74 600 3781.90 92.89 3528.65 64.90 1928.12 3.22 678.61 3.99 4000.0 3000 2000 1500 1000 400.0 0.0 10 20 30 40 50 60 70 80 90 100.0 cm-1 %T 3781.90 3528.65 1928.12 678.61
  • 15.
    Wave Number TentativeAssignment 3000-3600 Broad OH stretching 3200-3700 More Intensity due to NH group of Chitosan 1650 Stretching of Amide I of Chitosan 1590 Amine deformation in the chitosan (NH2) 500-1000 Metal-oxide bonding vibration 678.61 Stretching modes for Ag Funtional group & its tentative assignment of Chitosan/siver:
  • 16.
     The recordedspectra of the sample showed the functional groups and other modes of vibrations. Some of the main characteristic absorption peak in the sample and their tentative assignment are listed on the table.  According to S.W. Ali et al , absorption band at 3424.11 cm-1, indicates the combined peak of the NH2 and OH group stretrching vibration in chitosan.  Also by studying the spectra of the sample, a shift from 3424.11 cm-1 to 3528.65 cm-1 shows the doping of nanoparticle on the matrix of Chitosan.  The peak at 678.61cm-1 conforms the presence of silver nano particle on the chitosan bio polymer.  Binding of Ag with N of the Amine and Amide groups results in decreasing of intensity of Amine and Amide peak at 1633.59 cm-1. It also indicates the binding of Ag with O and N with those groups.
  • 17.
    3. XRD Diffractionstudies: The XRD pattern of Chitosan/Silver (Cs/Ag) polymer Nano composite obtained by spin coating for 3500 rpm was studied by using XPERT-PRO diffractometer. The XRD pattern is shown below: 0 10 20 30 40 50 60 70 80 90 0 50 100 150 200 250 Intensity(arb.units) 2 (degrees) XRD patter of Cs/Ag nanocomposite
  • 18.
     The rangeof the XRD spectrum is from 100 to 800.  Form the literature the XRD pattern of the chitosan showed characteristics peaks of 10.30 and 23.50,aparna et al,.  The diffraction pattern of Cs/Ag showed a characteristic peaks at 38.30 and 670, L-H.Li et al.  Also the charecteristic peak at 10.30 of Chitosan/Silver is sharp that indicates the uniform distribution of silver nanoparticle on the chitosan matrix.  From the XRD pattern, the presence of Silver Nanoparticle is confirmed in the matrix of Chitosan Bio polymer.
  • 19.
    4. Dielectric ConstantMeasurement (LCR Method): The variation of real and Imaginary component of dielectric constant with frequency is shown below: 100 1000 10000 100000 0.0015 0.0020 0.0025 0.0030 0.0035 0.0040 0.0045 0.0050 0.0055 Frequency (Hz) ' 100 1000 10000 100000 -0.0005 0.0000 0.0005 0.0010 0.0015 0.0020 0.0025 0.0030 0.0035 0.0040 " Frequency (Hz) Real part of dielectric constant Imaginary part of dielectric constant
  • 20.
     The real𝜀’ ans imaginary 𝜀” components of the dielectric constants were calculated from the following relations: 𝜀”= 𝜀’D Where, 𝜀0 is the permittivity of the free space (8.854 10-34 Farads/meter), A is the area of the electrodes, d is the thickness of the sample, D is the Dissipation factor.  The Dielectric constant describes the stored energy while the Dielectric loss describes the dissipated energy.  The real and imaginary part of dielectric constant decreases with increase in Frequency. However the decrease in ε’ is more rapid than ε”.  Decrease in dielectric constant with increase in Frequency is due to decrease in polarization.
  • 21.
    5. Four ProbeResistivity Measurement: The following graph shows the V to I characteristic of the sample. 0 5 10 15 20 25 0 500 1000 1500 2000 2500 Current(PA) Voltage(V) 0 5 10 15 20 25 0 2 4 6 8 10 12 14 RESISTANCEG VOLTAGE (v) Voltage Vs Resistance Voltage (v) to Current (I) characteristics
  • 22.
     Four proberesistivity measurement is one of the advance method to study the electrical properties of any type of material.  Using this method the voltage (V) to current (I) characteristic of the Chitosan/Silver Biopolymer Nanocomposite sample is studied.  It is found that there is increase in current (in the range of pico Ampere) with increase in voltage and is linear in nature.  From the second graph, the resistivity of the sample is found to be constant with increase in voltage. This confirms the validity of OHM’S law.
  • 23.
    V. CONCLUSION:  Chitosan/Silver(Ag) polymer nano composite films were synthesized by Ultra Sonication method.  The basic concepts and theories behind the polymers , nanocomposites and characterization techniques have been understood.  The XRD studies confirmed the presence of silver nanoparticles in the chitosan polymer matrix.  The functional groups present in the chitosan/silver biopolymer nanocomposite films are confirmed by FTIR analysis.  The functional group and modes of vibration were well matched with the literature data.  The electrical properties of the samples were characterized by LCR measurement method.  It was found that the dielectric constant decrease with increase in frequency due to decrease in polarization.  The absorption and transmittance spectra of the sample are obtained by UV-Vis spectroscopy. The optical band gap is obtained to be 3eV.  The V to I characteristic of the sample is studied by Four Probe method.
  • 24.
    VI. BIBLIOGRAPHY:  Li-HuaLi, Jian-Cheng /deng, Hui-Ren Deng, Zi-Ling Liu, Xiao-Li Li, Chemical engineering journal 160(2010)378-382  Muhammed Rafeeq P E, Junise V, Saraswathi R. Krishnan P.N, ChemPhysChem, 761(2001)25-35  Maribel G. Guzman, Jean Dille, Stephan Godet, World Academy of Science, Engineering and Technology 43(2008)  Aparna,ChemPhysChem 2005,6,1221-1231  S.Wazed Ali, S.Rajendran, Mangala Joshi, Carbohydrate Polymer,83(2011)438-446  WANG ChengLin, SUN Lan, XIE,Kun Peng & LIN Chang Jian, Science in China series B:Chemistry 2009  R.R. Khaydarov, R. A. Khaydarov, S.Evgra Fova and Y.Estrin, Silver nano particle as an anti microbial agent  G. Cruz, G. Ribelles, M.S. Sanchez, Journal of Biomedical Materials Research part B: Applied biomaterials, (2007), 303.
  • 25.