Downloaded 926 times


![CRSYSTALLOGRAPHIC DIRECTIONS
A crystallographic direction is defined as the line between two vectors. The
following steps are utilized in the determination of the three dimensional
indices:
1. A vector of conventional length is positioned such that it passes through
the origin of the coordinate system.
2. The length of the vector projection on each of the three axes is
determined; these are measured in terms of the unit cell dimensions a,b
and c.
3. These three numbers are multiplied or divided by a common factor to
reduce them to the smallest integer values.
4. The three indices are enclosed in square brackets :
[uvw]. The u, v and w integers
correspond to the reduced projections along
the x, y and z axes, respectively](https://image.slidesharecdn.com/xrdtechniqueandapplication-151216181023/85/XRD-principle-and-application-4-320.jpg)
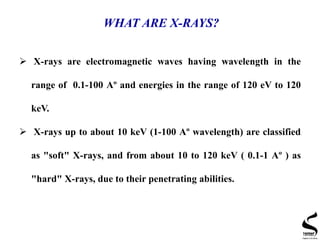
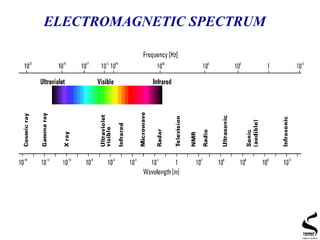
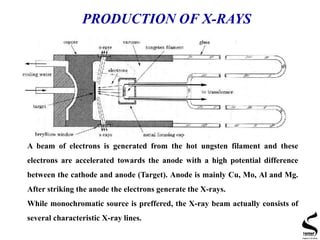
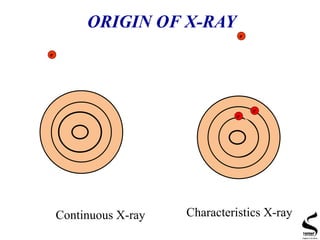
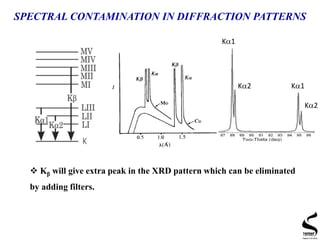
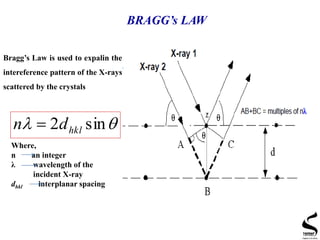
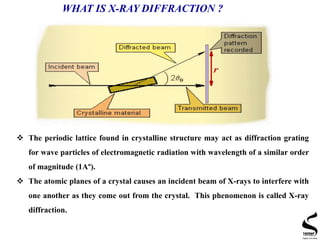
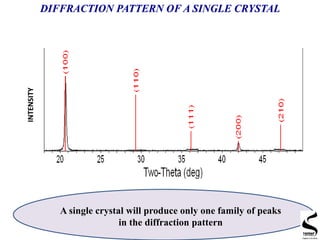
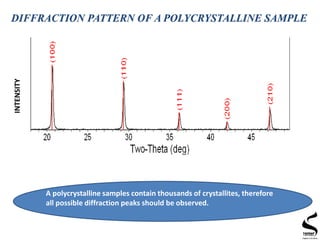
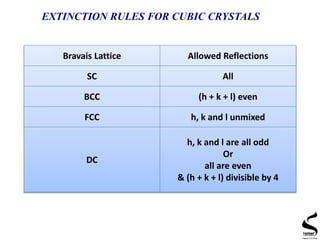
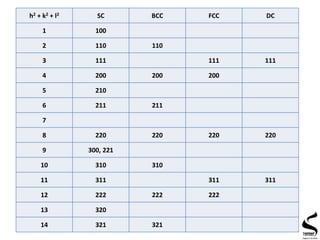
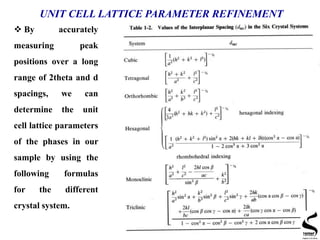

X-ray diffraction is a technique used to analyze the crystal structure of materials. It works by firing x-rays at a crystalline sample and measuring the angles and intensities of the x-rays that are diffracted. The document discusses key concepts like Bragg's law, unit cells, miller indices, and how x-ray diffraction is used to determine properties like phase identification, crystallite size, strain, and lattice parameters. It also outlines the basic components of an x-ray diffractometer and sources of error in measurements.